


 English (pdf)
 Article in xml format
 Article references
 Send this article by e-mail
 Cited by SciELO
  Cited by Google
  Similars in
SciELO
Similars in
SciELO  Similars in Google
 Permalink
1. Introduction
Since the oil crisis in 1973, wind energy has once again played an important role in generating electricity. The first machines used to produce electricity were large wind turbines towers of several meters high, but due to a growing technological evolution, the design, construction, and implementation of low potential turbines is increasing.
In 2007, a research was performed on the potential application of small wind turbines in urban buildings for energy generation [1]. The study consisted on modelling the wind flow through the fluid dynamics software ANSYS CFX. The data survey was performed around selected houses, either isolated or within a set of similar houses, and the collected results were compared with the data arisen from wind tunnel tests. The wind speed simulation was carried out as a function of the average height of the building, H, under wind flows from different directions (only the four cardinal points north, south, east, and west were considered) to assess potential points for the settlement of the wind turbines, z, (front, gable, corner and center of the buildings). It was observed that the wind flow is interrupted nearly at the height of the rooftop and that there was a considerable correlation between the wind speed and its direction. From the wind flow analysis, an annual energy yield of 520 kWh was estimated by means of the Rayleigh distribution function for a house hypothetically located in West London that had served as a model.
In 2011, a study related to an analysis for the location of wind micro-turbines mounted on roofs was presented [2]. A numerical study used CFD (Computational Fluids Dynamics) on the characteristics of the wind flow, under different angles of attack, on the edge, corner and center of roofs in three suburban landscapes: inclined, pyramidal, and flat roofs; this experiment was conducted in order to find optimal turbine mounting locations. The results indicated that flat roofs have higher yields and more consistent energy than other locations.
In the same year, a research work related to the performance of wind micro-turbine, in an urban environment, under real climatic conditions was also published [3]. The method used to estimate the wind potential was to record, using a Davis Vantage Pro2 plus weather station, data on wind speed, wind direction, atmospheric pressure, and humidity. From the data recorded, a frequency distribution is performed for wind velocities where it was found that wind speeds are well below the turbine cut-off velocity. For the estimation of the energy generated, the useful power of the turbine was calculated by neglecting the mechanical and generator performance and additionally, the air was considered as an ideal dry gas and with water vapor. It also presented a theoretical review of the methods for estimating wind resource in urban environments, for wind turbines mounted on buildings. There are a variety of methods for estimating the wind resource at a specific site based on data from other locations: taking a small set of local, regional or national measurements and correlating them to predict local wind speed; use data from a wind atlas; NOABL and MetOffice databases; Rayleigh and Weibull frequency distributions. As for the methods used for the estimation of energy production is the Weibull and Rayleigh distribution function, manufacturer power curves, NOABL database and MetOffice.
A study in 2013 related to the prediction of power from normal and Weibull distributions for small turbines in urban environments [4]. Two models, tested in urban and rural locations in Dublin (Ireland), the Albers approximation and the Weibull distribution based only on average wind speed, standard deviation, and turbulence intensity, were postulated.
In a national level in Bogotá (2004), [5] researchers from the Department of Mining and Energy Planning (UPME) and from the Unit of Mining Planning (IDEAM) developed the Atlas of Wind and Wind Energy in Colombia, in which maps of the average wind velocities were presented in an monthly and annually basis. It also contained values of the average density of wind energy at heights of 20 and 50 meters in a monthly and annually basis from different areas of the country. In addition, an aerodynamic analysis for electric power generation via axial vertical turbines was presented for Bogotá city [6]. The methodology consisted of collecting data on the highest wind speeds from the meteorological station for the pre-determined locality of Fontibón (Bogotá). For the aforementioned locality, wind speeds from 2.5 to 3.0 m/s were recorded. Regarding the aerodynamic study of the turbine, the vertical wind velocity profile was determined from the potential model and the logarithmic model (Lysen profile), under a roughness length Z 0=0.8 and a roughness coefficient α=0.2312. Afterwards, with basis on the estimated velocity values from a twelve-months survey, the authors determined the scale parameters through the graphical method as being c=3.31 m/s and the shape parameter k=1.27 for the Weibull function. Finally, at hands of these parameters, a wind power density of 28.98 W/m2 and a wind energy of 253.86 kWh/m2 were obtained.
In the area 'Páramo de Chontales' (Boyacá), the methodology for the estimation of wind potential initially consisted on measuring wind speed with a meteorological station located in the study area [7]. Afterwards, from the recorded data, monthly organized, the wind frequency distribution was calculated, as well as the percentage of time in which the wind blows, for a certain interval of velocities; in this way, the probability of occurrence is measured. Finally, the estimated value of the wind power density was calculated by means of the Weibull distribution function, whose shape and scale parameters, obtained from the graphic method, were 2.15 and 5.32 m/s respectively. In 2013, the Santo Tomás de Aquino University performed a study of the wind potential in their campus in Tunja (Boyacá). The methodology consisted of recording wind velocity data, preliminarily for 8 months, with a Davis Vantage Pro2 meteorological station located 14 m above the ground. A wind frequency table was then produced with velocity values ranging from 0.5 to 3.0 m/s in 0.5 m/s intervals and from this analysis it was determined, using the graphical method, a parameter of shape scale 2.6437 m/s and scale 0.4891 of the Weibull function. Finally, from the scale parameter, a wind potential of 102.97 W was obtained in the study area [8].
It is necessary to know the local wind velocity not only for the design of devices related to wind energy (such as determining the most suitable turbine for the available wind resource in a specific region and analysing the optimal amount of wind generators [9], or for the multivariate control of wind turbines [10]), but also for other different situations such as solar collectors, biotic pump modelling or the evaluation of evaporation losses in swimming pools [11] [12] [13]. Studies have been carried out to estimate the wind potential of several cities, characterizing the wind velocity in a statistical manner, using the Weibull probability distribution to implement urban wind turbines [14]; however, within a zone, there are different profiles for wind velocities, which generates the need for the evaluation of the wind potential at the micro-local level.
In this research, an estimation of the wind potential at the Universidad ECCI (terrace of the P building) is carried out to evaluate if the wind conditions are appropriate for the implementation of a low power wind turbine, currently unused in the generation of electric energy. This turbine was designed ~ 10 years ago by a group of students [15].
2. Materials and Methods
2.1 Study area (Sample)
The study area, located in Bogotá (Colombia) and the closest and most reliable reference area, corresponds to the meteorological station located at the National University of Bogotá. The study area is located at a length of 74°4'29 " W, latitude 4°38'32" N and at a height above sea level of 2495 m. Table 1 shows the roughness parameters that characterize the study area.
2.2 Measuring instruments and techniques
Garmin Etrex 10 GPS: A device used to determine the altitude above the sea level, latitude, and longitude of the study area.
ADC Wind Brunton Anemometer: A device used to determine the points in the study area with higher wind flow.
Davis Vantage Pro2 plus Wireless Weather Station 6162: An Automatic Station, which consists of a series of sensors that allow real-time recording of meteorological variables.
Davis Vantage Pro2 Console: It enables wireless transmission of weather variables captured with the weather station.
Software Weatherlink 5.9.0: It is a software that allows, through a USB port connection, to extract in real time, through a data logger the data stored in the console.
Excel®: It is the means to store the data and allows the elaboration of the graphs of the frequency of winds, the estimation of the wind velocity with the application of the power law, The Weibull distribution function and their respective scale parameters, and finally the determination of the wind potential in the study area.
2.3 Estimation of the wind resource
In order to estimate the wind speed at the height of the turbine axis (approximately 23 m), based on the data from the National University weather station, which has anemometers located at a height of approximately 2.0 m, the power law is applied. This law is frequently used in studies worldwide, including Colombia, for the estimation of the wind resource and the development of wind atlas [5].
The power law depends mainly on the velocities, the height of the study area, the height of the reference zone, and fundamentally on an exponent known as the power law exponent or wind roughness coefficient (α), which is directly related to the surface roughness of the terrain. For the purposes of this study, the equation [1], used for the analysis of the wind velocity around an array of heterogeneous heights is used [16], which simulates matrices of buildings in urban environments, and which could be considered similar to the study area.
Where z is the height above the ground, d is the height of displacement and z0 is the length of roughness.
2.4 Estimation of wind potential
Once the estimation of the wind velocity data in the study area has been carried out, the main objective of the research corresponds to the estimation of the wind potential.
In order to determine the density of the wind potential, the Weibull distribution function is used, equation [2]. This distribution is widely utilized in studies of estimation of the wind potential, and their respective parameters of shape k and scale c.

2.5 Estimation of the Eolic power in the study zone
After having characterized the Weibull distribution function, with their respective factors k and c, an estimated value of the wind power density in the study area is obtained. This value is obtained by two methods: the first one was used by Alvarez for the estimation of the wind potential in the campus of the Santo Tomas University (8), and the second method is to calculate the available power, the maximum power and the actual output power of the turbine [17].
3. Results and Discussion
3.1 Estimation of the wind velocity at the height of the turbine axis.
After the surface roughness coefficient has been defined (α = 0.522), the wind velocity prediction at the height of the turbine axis, U(z) is determined from the wind velocity data for a certain reference height, U(zr) in this case at the height of the anemometers of the Universidad Nacional de Colombia.
Due to the amount of data processed during the period between the 1st of January and the 24th of March, and in order to evaluate the approximation of the method, only the behaviour of the velocity -estimated and real- for the months of January and March is presented in Figure 1. The horizontal axis of the graphs has a scale in intervals of 10 minutes during the respective months.
In the same way, a graph is done where a comparison of the data of average velocity recorded by the meteorological station of Universidad ECCI and the average speed is estimated from the power law, as it may be observed in Figure 2.
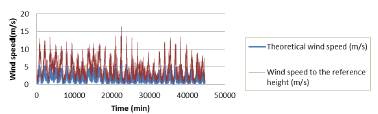
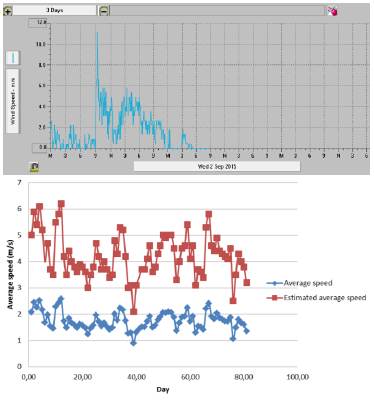
Figure 2 Comparison between records and estimates of average air velocity. Top: Wind speed data recorded in September 2015 by the anemometer located on the terrace of the P (Universidad ECCI) headquarters and processed with weatherlink software 5.9.0. Bottom: Estimation of average wind speed per day for the period from 1 January to 24 March 2015. The constant increase between Thursday and Saturday is due to the fact that the weather station did not record data for three days.
3.2 Wind Speed frequency histogram
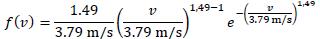
Since the wind speed is an amount of random nature, we proceed to realize the frequency distribution of the wind speed, with speeds intervals of 1.0 m/s, just like it is observed in Table 2, and finally we elaborate the respective frequency histograms (Figure 3). The accumulated relative frequency is gived by F(v), equation [3] which is defined as [18] [19] [20]:

Where k and c are the form and scale parameters respectively.
3.3 Weibull distribution function s characterization
The method to estimate parameters of scale and shape, of the Weibull function, corresponds to the graphic method.
Table 2 Frequencies distribution of wind speed.
| Speed intervals (m/s) | Frequency | Class mark V (m/s) |
|---|---|---|
| 0.0 to 1.0 | 648 | 0.5 |
| 1.0 to 20 | 1877 | 1.5 |
| 2.0 to 3.0 | 1894 | 2.5 |
| 3.0 to 4.0 | 1602 | 3.5 |
| 4.0 to 5.0 | 1339 | 4.5 |
| 5.0 to 6.0 | 1313 | 5.5 |
| 6.0 to 7.0 | 744 | 6.5 |
| 7.0 to 8.0 | 570 | 7.5 |
| 8.0 to 9.0 | 411 | 8.5 |
| 9.0 to 10.0 | 293 | 9.5 |
| 10.0 to 11.0 | 187 | 10.5 |
| 11.0 to 12.0 | 65 | 11.5 |
| 12.0 to 13.0 | 41 | 12.5 |
| 13.0 to 14.0 | 21 | 13.5 |
| 14.0 to 15.0 | 2 | 14.5 |
| 15.0 to 16.0 | 0 | 15.5 |
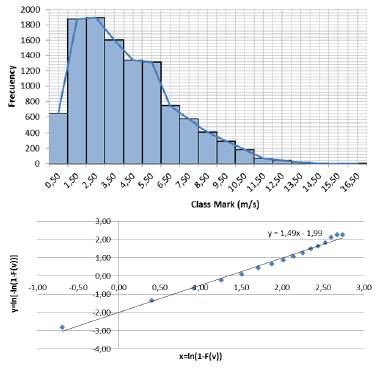
Figure 3 Values of absolute frequency and class mark to estimate the speeds during the study period. Top: Frequency histogram of wind speed estimated during the study period. Bottom: Method of linear regression to estimate the Weibull parameters.
In this method, used worldwide [8] [18] [19] [20] calculus of cumulative frequencies, from the speed data, class marks and the relative frequencies and then we proceed to obtain the ordered couples (x i ,y i ) as well as the respective graph (Figure 3).
In the graphical method the slope of the straight line, product of linear regression, corresponds to the shape parameter fc, whose value obtained was:

Indicating a scattering of the 14.9% of the data regarding the mean value of the wind speed.
While the value obtained from the scale parameter c, which represents the wind speed with more frequency was:

From the parameters, of shape and scale, we proceed to characterize the Weibull's distribution function.
The Weibull's distribution function to a class mark of 0.5 m/s are presented in Table 3.
3.4 Methods for wind potential estimation in the study zone
3.4.1 First method
The first method consists in calculating the average value of the wind power, using the following equation [4] [8]:
 (4)
(4)for a scale factor value, c = 3.79 m/s of the Weibull function; the real radius of the blades, r = 0.89 m, of the Universidad ECCI micro-turbine; an air density of 1.33 kg/ m3 for a height of turbine axis z = 23 m and temperature of 13°C, that represents the average temperature in the city of Bogotá; take from IDEAM data base and a power coefficient Cpmax = 1, is obtained the following average value of the power delivered for the wind in the zone of study.

Although, this method permits an approximation of the wind potential in the study zone, it does not permit to find the wind potential for the different values of speed and not represent the real data, because neglects the limit of Betz and the lost energy in the generator and transmitter.
3.4.2 Second method
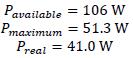
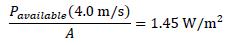
In this second method, the output power of the turbine and the wind's potential density were determined. In the first instance the available power is obtained equation [5], maximum power equation [6] and the real power equation [7] in the turbine considering an air density, equals to 1.33 kg/m3, a wind speed of 4.0 m/s, that represents approximately the value of scale factor and some characteristics of the ECCI wind micro-turbine, such as radius of blade (r = 0.89 m), power coefficient (CP = 0.48486) and performance mechanical-electric of the system multiplier-generator (ηTηG = 0.8) [17]:
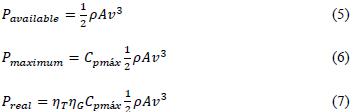
The maximum and real power of the turbine at 4.0 m/s wind speed are:
For calculating the power wind density, the equation [8] was
used [17]:
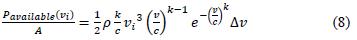
And taking a speed interval of 0.1 m/s, the shape and scale parameter 3.79 m/s and 1.49, to obtain the following density power values available
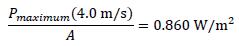
Maximum power density
To determine the maximum power density we used the same procedure of the available power density but, additionally, it was multiplied by the maximum density coefficient CPmáx = 0.5925.
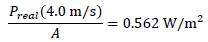
Real power density
To determinate the real power density was multiplied the available power density by the power coefficient CP = 0.48486 and the electrical and mechanical performance of the system multiplier-generator ηTηG = 0.8, characteristic of the Universidad ECCI micro-turbine.
Some of the characteristics of the micro-turbine are presented in Table 4.
4. Conclusions
The application of the power law permitted to estimate the values of wind speed in the study zone, for a shaft height of the turbine. These estimated values are compared to the values recorded by Meteorological Station Universidad ECCI.
The Weibull function was used to estimate wind potential and wind power density. The parameters of form and scale obtained, using linear regression method were respectively c = 3.79 m/s and k = 1.49 the first parameter indicates that the wind velocity that occurs most frequently is 3.79 m/s, the other parameter states that only 14.9% of the data are close to the average value of the wind speed.
The wind micro-turbine, designed by graduates of the Universidad ECCI, is operated at a wind speed of 4.0 m/s, approximately the average wind speed. It generates only a useful power of 41.0 W ; that would not be sufficient to feed energy to a room of the Universidad ECCI. Actual wind power density for turbine specifications, regardless of the swept area, when the micro-turbine operates at a speed of 4.0 m / s reaches a value of 0.226 W/m2. This result implies a possible modification in the radius of the blades that allows to reach higher powers. The useful power that would provide the turbine could be aimed to store it in a battery bank or it would serve as a pilot test to turn on a panel of 40 light bulbs led.

