


 English (pdf)
 Article in xml format
 Article references
 Send this article by e-mail
 Cited by SciELO
  Cited by Google
  Similars in
SciELO
Similars in
SciELO  Similars in Google
 Permalink
1. Introduction
A voltage sag is a sudden short duration drop of the RMS voltage at power frequency, between 10% and 90% of the nominal value with durations from half-cycle to a few seconds. Usually this disturbance is characterized by the retained voltage (deep), its duration and the phase jump [1] [2]. Furthermore, its presence increases the current in remote locations of electrical system and affects the operation of sensitive devices and equipment.
Voltage sags affect the operation (mal-operation or interruption) of sensitive devices and equipment, in many occasions leads to complete interruptions of the industrial process and affect the proper operation of power and distribution systems [2]. For these reasons, voltage sags are among the most frequent and one of the main power quality (PQ) problems [1].
The study of sags has increased the interest on mitigation methods to preventing or reducing their effects. The conventional methods are by using capacitor banks, introduction of new parallel feeders (distributed generation-DG), power electronic devices and uninterruptible power supplies (UPS). Generally, the distributed generation (DG) usually helps to mitigate voltage sags because increases voltage profiles of buses under fault condition and also helps to maintain the voltages during the fault [3]. In addition, a factor as the DG penetration level can modify the system behavior with respect to voltage sags occurrence.
On the other hand, the distribution static compensator (DSTATCOM) is a device used to mitigate voltage sags and other PQ solutions such as power factor correction, voltage stabilization, flicker suppression and harmonic control [4] [5]. Additionally, the DSTATCOM has the capability to sustain reactive current at low voltage, reduces land use and can be developed as a voltage and frequency support by replacing capacitors connected with batteries as energy storage [6].
Because the characteristics of voltage sags can be affected by the presence of a mitigation device, the response of the IEEE-13 distribution test system using different DG penetration levels and a twelve-pulse DSTATCOM is analyzed in this paper. To understand the DG unit operation, the DSTATCOM configuration and the distribution system response, modelling and digital simulations are made using the Alternative Transient Program (ATP/EMTP).
The rest of the paper is organized as follows. Section II describes the methods and materials used in this work including: the features of IEEE-13 node test feeder, the methodology used to identify the critical nodes of the distribution system, the definition of case studies and the modelling process for the DG unit and the DSTATCOM using ATP/EMTP. Simulation results when the DG unit and the DSTATCOM are connected to the distribution system under voltage sag conditions are analyzed in section III. Finally, conclusions of this work are presented in section IV
2. Methods and Materials
2.1 Description of the distribution tests system
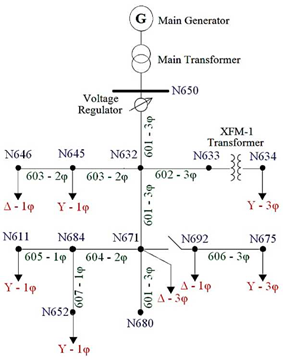
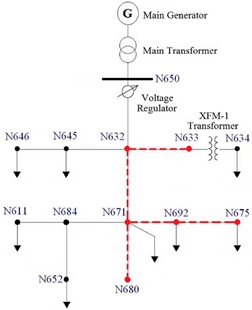
Figure 1 shows the scheme of the IEEE-13 system used in this work. This system consist of 13 buses which are interconnected by means of 10 lines (three and single phase lines), one generation unit, one main Δ-Y transformer to 115/4.16 kV, one in-line Y-Y transformer to 4.16/0.480 kV, one voltage regulator unit, two shunt capacitor banks, unbalanced spot and distributed loads [7]. In addition, in steady state the IEEE 13-bus system present three types of disturbances: (a) voltage imbalances, (b) load unbalance and (c) reactive power flows.
Although several types of tools have been used to simulate voltage sags, the present work has been based on the development of models in ATP/EMTP. The capability of this tool to the voltage sags analysis is shown in [8],[9].
2.1 Critical buses identification
The critical bus of a system is a point of load connection where the occurrence of faults will lead to the reduction of the voltage profile in all buses of the network. To analyze how much the IEEE-13 system is affected by the occurrence of a fault the following local function is used:
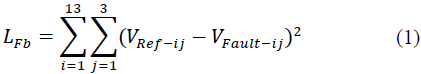
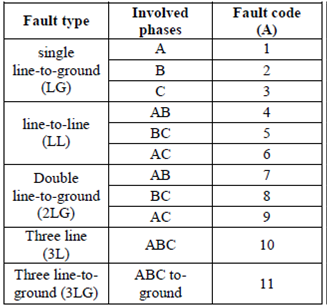
where, F is the shunt fault type according to the Table 1, b is the bus where the fault is produced, i is each bus in the system, j is the phase, V Ref-i ¡ is the pre-fault voltage in p.u. and V Faut-ij is the voltage in p.u. under fault condition.
The use of a squared difference in Equation (1) prevents negative values in the local function when 𝑉𝑓𝑎𝑢𝑙𝑡−𝑖𝑗 > 𝑉𝑝𝑟𝑒− .
To assess the complete effect that each bus has on the others buses in the system an overall function (O b ) is proposed. The equation of this function is given by:
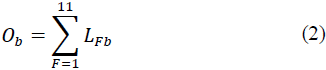
Where, L Fb is the local function for each fault condition (see Eq. (1)). Table 2 presents the overall function for the 13 nodes of the system organized in descendent order. Since the overall function is a parameter that totalizes the effect of local functions by fault type for a node of interest, can be considered as critical bus of the system the one with the largest overall function. To analyze the response of the test system in presence of sags using DG and DSTATCOM, in this work were selected as interest buses the five with the largest overall function. These are the nodes 632, 633, 671, 675 and 680.
For the analysis presented here, the bus 650 is not taken into account as critical bus due to its relevance and proximity to principal generator, because any fault on this bus will produce the system collapse. However, depending on the number of system nodes, for other case study can be used a different selection criteria.
2.3 Case studies
To predict the voltage sag features at a bus of interest, this work applies a method of stochastic generation of disturbances based on the model of the system and statistical data of fault [2]. The application of this method requires the generation of random values that are used to obtain the location of disturbance, the type of fault and the fault resistance (depth of voltage sag). The IEEE-13 bus test feeder has been simulated in 200 different voltage sag scenarios. The characteristics of faults have been randomly generated in a MATLAB® routine. The parameters used during simulations are the following:
Location of fault: the fault may occur at any critical node (632, 633, 671, 675 and 680) or at any line that connect the critical buses. This paper assumes that the fault position in each line may occur in three positions (25%, 50% and 75%). The fault density function at buses and lines is 65% and 35%, respectively. Figure 2 shows with a dashed line the critical zones defined in this paper for the IEEE-13 system.
Probability of fault types: LG: 75%, LL: 15%, 2LG: 6%, 3L and 3LG: 4%
Fault resistance: eight (8) different values between 0.19Q and 0.85Q are established. The fault resistance is selected by a uniform density function.
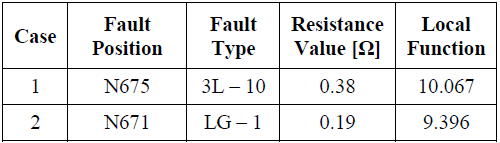
In each simulation, the results of the fault scenarios are used to estimate the local function and to compare the voltage profiles before and after the voltage sag condition. The case studies in which the alternatives for voltage sag mitigation (DG unit and the DSTATCOM) will be evaluated are two conditions with the largest L fb . A summary of these cases are presented in Table 3.
2.4 A TP/EMTP model of the distributed generation unit
In this paper, only one distributed source is installed. This DG unit is a power synchronous generator whose ratings and electric parameters are shown in Table 4. Other specifications of the synchronous generator using in this paper are described in [10]. In simulations, this generator will be connected to all buses of the IEEE-13 test system. No information about the mechanical behavior of the generator is provided, for this reason a single representation in ATP/EMTP simulations is used. However, to choice the best generator model transient and stable state simulations were considered.
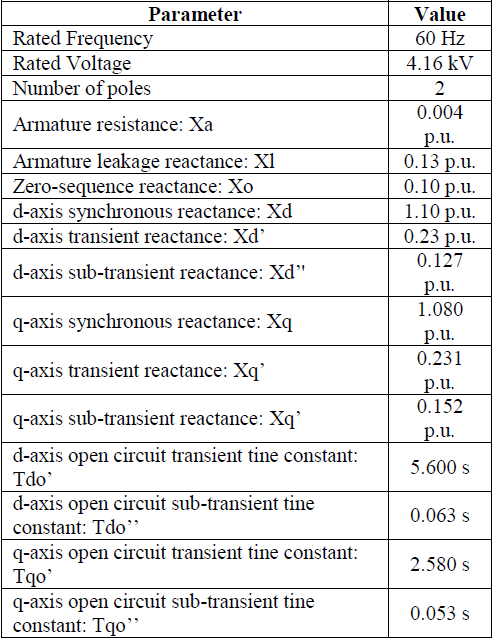
This is important because in transient conditions, as the occurrence of voltage sag, the machine must behave as stable as possible during the fault to compensate its effects [10].
2.5 A TP/EMTP model of the DSTATCOM device
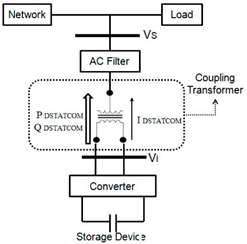
The DSTATCOM is a three-phase and shunt connected power device. It consists of a DC source or DC capacitor, a three-phase inverter module (based on IGBT, thyristor, etc.), a control stage, an AC filter, and a coupling transformer [11]. The basic structure of a DSTATCOM is shown in Figure 3. In this work, the energy storage unit of the DSTATCOM is a DC source connected in parallel with a capacitor C s . This element stores the energy needed to mitigate the voltage sag and it is used by the DSTATCOM to inject the reactive power. To determine the size of C s in a three-phase system the following equation is used [13]:

Here V dc is the voltage across C DC per phase, V dstat is the voltage peak value per phase, ΔI L is the difference between the current before and after the fault (in the load), T is the period of one cycle of voltage and current and V c máx is the upper limit of the energy storage in C s per phase.
The value of V dc is determined from ATP/EMTP simulations for each case study. On the other hand, the value of V c máx is the upper limit of the voltage of the capacitor C DC . This voltage can be two or three times of Vdc.
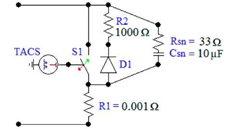
With respect to the stage of power electronics, a twelve-pulse inverter configuration was used. This arrangement uses two 6-pulse inverters connected in parallel and share the same DC-source. For each six-pulse inverter, six bidirectional semiconductors are used. An ideal type-13 switch controlled by TACS is used as semiconductor valve. Figure 4 shows the configuration in ATP/EMTP for one of the branches that make up the six-pulse inverter. The resistances R1 and R2 represent the inverter losses and the resistance Rsn and capacitor Csn complete the snubber circuit.
The control stage used here is divided in two parts. The first section controls the DSTATCOM output voltage varying the DC voltage of the capacitor C s . The second section controls the phase shift of the DSTATCOM output voltages. This control is achieved by variations in the switching angle of each type-13 switch using a TACS-Source-Pulse-23. Each TACS circuit produces a square signal (pulse train) that acts as a pulse width modulation (PWM) generator.
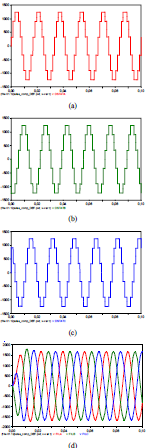
Figure 5 Filter input and output signals (a) Input voltage phase-A (b) Input voltage phase-B (c) Input voltage phase-C (d) filtered (output) three-phase voltages.

Finally, due to the DSTATCOM output voltages are signals composed by rectangular pulses, a filter LC to reduce the harmonic distortion is implemented. The values of the inductance and the capacitance of the filter are 10 mH and 253 liF, respectively. This filter has a cut-off frequency of 100 Hz. The input signals (DSTATCOM output voltages) and the output signals of the LC filter are illustrated in Figure 5. Finally, the THD for the output voltages was 0.283%. A detailed description of the elements that conforms each stage of the compensator and its implementation using ATP/EMTP are presented in [12].
3. Results and Analysis
3.1 Methodology of simulations
To analyze the impact of the DG unit and the DSTATCOM on voltage sags occurred in the IEEE-13 system, the following method was applied:
Step 1 : Analyze the IEEE-13 test system under voltage sag condition before to use the mitigation alternative
(DG unit or DSTATCOM)
Step 2 : Define the penetration levels for DG unit. In this paper, PL of 20%, 50% and 100% have been selected with respect to the total real power of the system (1.25
MVA)
Step 3 : Connect the synchronic generator (DG unit) at each three-phase bus of the system and change the penetration level in order to find a solution in which the local function is the smallest possible
Step 4: Analyze the impact of the location of the DG unit and its penetration levels on the voltage sags features
Step 5 : Compare the results of the system voltages with and without the DG unit connection
Step 6: Without the DG unit, connect the DSTATCOM in the bus affected by voltage sag
Step 7: Adjust the angles of the output voltages in the DSTATCOM with the distribution system voltages. This is convenient to reduce the active power exchange
Step 8: Change the voltage of the capacitor C s (V dc ) in order to find a solution in which the local function is the smallest possible and the voltage of all system nodes satisfying the condition V node > 0.9 in p.u
Step 9: Determine the value of C s according to the V dc
and the output voltage of the DSTATCOM
Step 10: Calculate the reactive power injected by the DSTATCOM that improves the voltage profiles of the electrical system and also mitigates the voltage sag
Step 11 : Analyze separately the impact of location and penetration level of the DG unit and the DSTATCOM response on the voltage sag features 76
Step 12: Compare the voltage profiles of the distribution system before and after to connect each mitigation device
3.2 Case Study 1: three-phase voltage sag at node 675
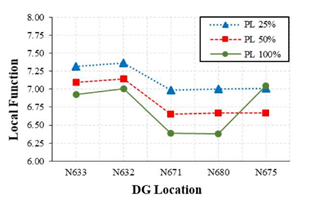
In the first case, an average voltage sag of 0.369 p.u due to a three-line fault (type 10) at bus 675 with a fault resistance of 0.38 Ω is presented. Figure 6 shows the influence of location and DG penetration level (PL) on the local function. In this case, the best location of DG unit is achieved at bus 680 using a high penetration level. In this scenario, the voltage of the affected bus reaches an average value of 0.608 p.u. With this configuration, the local function is reduced from 10.067 to 6.379.
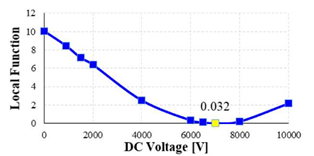
On the other hand, analyzing the response of the IEEE-13 system using the DSTATCOM, after the angles adjustment, V dc is varied from 900 V to 10 kV to obtain a reduction in the local function. This variation is illustrated in Figure 7. In this case, the lowest local function obtained is 0.032 applying a DC voltage of 7 kV.
In addition, the compensator improves the voltage of the bus 675 (affected node) reaching an average value of 0.944 p.u. per phase. For this condition, 𝑉𝐶𝑚á𝑥 = 15000 𝑉, 𝑉𝐷𝑆𝑇𝐴𝑇 = 7935.2 𝑉, Δ𝐼𝐿 = 58.4 𝐴, 𝑇 = 16.67 𝑚𝑠 and 𝑉𝐷𝐶 = 7000 𝑉. From these values, the 𝐶𝐷𝐶 value using Equation (3) is 131.7 μF. Finally, the reactive power of the DSTATCOM is calculated as follows:

where, 𝜔 = 377 rad/s and the nominal line-to-line voltage of the IEEE-13 system is 𝑉𝐿−𝐿 = 4.16 𝑘𝑉. Using Equation (4), the rating reactive power injected by the DSTATCOM is 859.1 kVAR.
3.3 Case Study 2: single-phase voltage sag at node 671
In this case, a voltage sag at bus 671 due to a single-line-to-ground fault (type 1) with a resistance of 0.19 Ω is occurred. This voltage sag condition has a local function of 9.396 and produces a voltage sag of 0.163 p.u. on phase-A. Voltages of phase-B and phase-C are 1.258 and 1.139 p.u., respectively. Figure 8 shows the effect of the location and penetration level of DG unit on local function obtained from ATP/EMTP.
For this condition, the size of DG has a low influence on voltage sag severity. From simulations, the lowest local function obtained is 6.398 connecting the DG unit at bus 675 with a medium penetration level (50%). The DG unit connection improves the voltage of bus 671 phase-A (affected phase) reaching a value of 0.547 p.u.
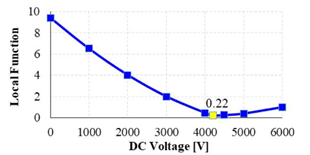
When the compensator is connected for the same voltage sag condition, the DC voltage is also varied from 900 V to 10 kV but the local function is reduced from 9.396 to 0.22 applying 4.2 kV. Figure 9 shows the behavior of the local function with respect to Vdc. Voltage of the bus 671 phase-A is improved with the DSTATCOM obtaining a value of 1.021 p.u.
Using the DSTATCOM, the capacitor 𝐶𝐷𝐶 is used to inject reactive power to the system during the voltage sag with 𝑉𝐶 𝑚á𝑥 = 15000 𝑉, 𝑉𝐷𝑆𝑇𝐴?? = 8.45 𝑘𝑉, Δ𝐼𝐿 = 20.9 𝐴, 𝑇 = 16.67 𝑚𝑠 and 𝑉𝐷𝐶 = 4.2 𝑘𝑉. From these values, the 𝐶𝑆 value is 42.6 μF and the injected reactive power of DSTATCOM is 277.9 kVAR. These values are lower than those presented in case 1 because the voltage sag affects only one phase at bus 671.
4. Discussion
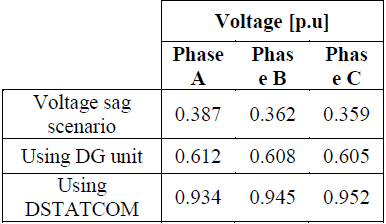
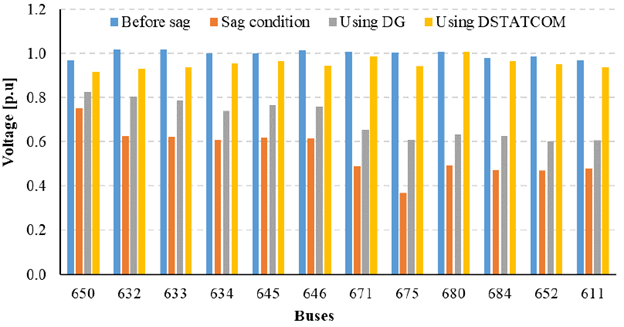
In order to compare the response of the voltage sag mitigation alternatives, Table 5 presents the RMS voltages per phase before and after the connection of each device during the voltage sag condition at bus 675 (case 1). In addition, Figure 9 shows the average voltage profile of each bus of the distribution test system during the disturbance and its response when the DG unit and the DSTATCOM are connected separately.
With respect to the voltage sag condition in case 1, it is possible to note that both the DG unit and the DSTATCOM improve the voltage of the affected node. However, when the DG unit is connected at the bus 675 the sag depth decreases about 24%, while the DSTATCOM improves the voltage of the bus 675 up to 57%, mitigating the voltage sag completely.
In addition, when the DSTATCOM is used all voltages of test system are also improved near to the reference value (before sag occurrence) achieving a minimum value of 0.918 p.u. at node 650-phase C and a maximum value of 1.008 p.u. at node 680-phase B.
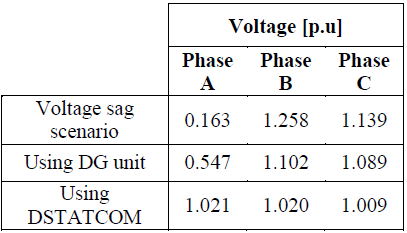
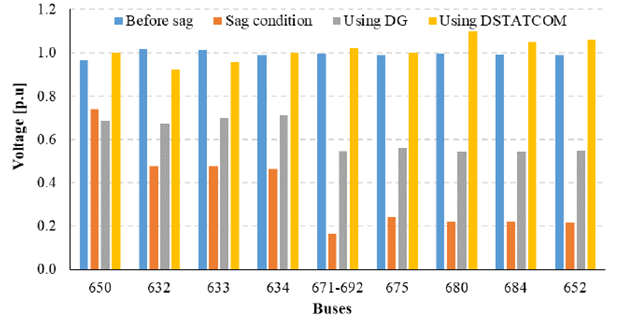
From results obtained for the case 2 (voltage sag at bus 671), Table 6 presents the RMS voltages per phase when each sag mitigation equipment is connected. Besides, Figure 10 shows the voltage profile of the phase-A (affected phase) in the IEEE-13 test system during and after the connection of the DG unit and the DSTATCOM. In this case, buses 645, 646 and 611 were not taken into account because they not have phase-A.
When the results of the simulations are compared for the single-phase voltage sag condition at bus 671, the DG unit improves the voltage of phase-A in the affected bus from 0.163 to 0.547 p.u. (about 38% increase).
On the other hand, when the DSTATCOM is connected the voltage of the affected phase changes from 0.163 p.u to 1.021 p.u.
In addition, when the DG unit is connected all voltages of the IEEE-13 system are also improved obtaining a minimum value of 0.542 p.u. at node 680 phase-A and a maximum value of 1.118 at node 632 phase-C, while using the DSTATCOM the minimum value achieved was 0.923 p.u. at node 632 phase-B and the maximum value was 1.10 p.u. at node 680 phase-C.
In this case, it is important to highlight that although phase-B and phase-C at bus 671 were not affected by the voltage sag condition, during the disturbance, their voltages increase between 14% and 26% with respect to reference value (after voltage sag occurrence). However, when the mitigation devices are connected the average voltage of the unaffected phases (B and C) is reduced to 1.096 p.u. with the DG unit and 1.015 p.u. using the DSTATCOM. These results show that the DSTATCOM besides to completely mitigate the voltage sag is able to maintain the voltage of the unaffected phases close to the reference value.
5. Conclusions
In this paper, the influence of a distributed generation (DG) unit and a twelve-pulse DSTATCOM on the features of voltage sags caused by faults in the IEEE-13 test system has been analyzed. Besides, a method to identify the critical buses based on random generation of disturbances and statistical data of faults was applied. In addition, the models and graphic advantages available in ATP/EMTP were used to conduct all aspects related to the implementation of the DSTATCOM and the DG unit, the IEEE-13 system modelling and the development of intensive simulations.
In order to evaluate the impacts of its installation, the location and size of a new synchronous generator (DG unit) have been taken into account. For cases studies, it was observed that the presence of the DG unit has positive effect on the system, contributes to reduce the voltage sags impact and improves the voltage profiles in all system. However, for several sag conditions the DG unit is not capable to improve completely the voltage profiles of the distribution system.
An increase of the penetration level (PL) of the DG unit causes a reduction in the harmful effects of voltage sags. In fact, the best results were obtained with a medium or high PL. From the analyzed case studies, it is possible conclude that when a voltage sag involves multiple phases the size of DG decrease the local function and the sag severity, while if the voltage sag condition involves a single-phase, the PL has a slightly influence on voltage sag severity. With respect to the location of the DG unit, it is possible to mitigate a voltage sag condition connecting this additional generation unit at any three-phase bus of the IEEE-13 system. However, the best results were achieved when the DG unit was connected at a downstream location of the affected node.
On the other hand, it was observed that the installation of the DSTATCOM is a better alternative than the DG unit for voltage sag mitigation. The DSTATCOM connection at the affected bus improves the voltage profiles, not only in the affected bus, but also in all buses of the test system. In fact, with this device the voltages at affected bus return to reference values (pre-fault condition) and for the case studies analyzed the voltage sag was completely mitigated. Finally, the simulations show that in single-phase voltage sag cases the DSTATCOM besides to completely mitigate the voltage sag is able to maintain the voltage of the unaffected phases close to the reference value.

