


 Inglés (pdf)
 Articulo en XML
 Referencias del artículo
 Enviar articulo por email
 Citado por SciELO
  Citado por Google
  Similares en
SciELO
Similares en
SciELO  Similares en Google
 Permalink
Introduction
Stress concentration around concentrators is of practical importance because, normally, they are the cause of failure [1] [2]. For a long time, stress concentration factors have been found by using experimental approaches that include methods, like photo-elasticity, grating methods, brittle coating methods, and voltage gauge methods [3]. Stress concentration factors have been calculated for different geometries and ratios, the most complete review of stress concentrators with various geometries using the photo-elasticity method is presented in [4].
Experimental tests tend to be costly, take too much time, and are relatively imprecise; added to this is the existence of concentration factors of certain geometries, not found in textbooks, demanding of engineers and researchers to have access to laboratories with tools to construct the respective curves [5]. Besides this, imprecision in the stress concentrator curves can cause, in the best of cases, over-dimensioning of the parts to be designed, which although secure, lead to unnecessary cost increases [6].
Some authors have evidenced similar problems and in response have developed different test to some geometries through finite-element programs. Researchers at the China University on Petroleum used FEM methods to analyze the support capacity of k-joints, bearing in mind the effects of stress concentrations caused by the local geometry and the influence of temperature on the mechanical properties of materials by using ANSYS® for the coupling of the temperature field and the stress field [7].
Sakarya University (Turkey) investigated stress distribution in semi-elliptical corrosion pits under torsion, by creating a series of three-dimensional models to systematically predict concentration factors; the study was conducted with the ANSYS® program [8].
Research at the Shanghai Jiao Tong University studied stress concentrations in bird-beak and conventional t-joints using the FEM method, comparing the types of joints to verify the lowest concentrations.
The ANSYS® general purpose program was used to obtain the concentration factors of both types of t-joints [3]; other authors have used programs of lower cost and of their own development, that at the University of Sarajevo called AlfaK® [9], which is used to analyze stress concentration factors for different shapes.
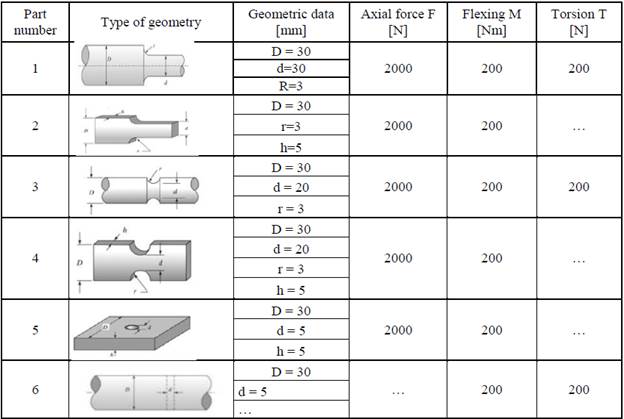
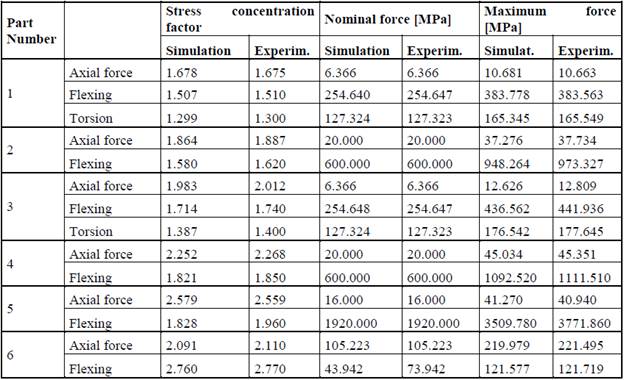
Table 1 shows the geometric configurations carried out for the AlfaK® program; the results obtained were compared to those reported in Table 2. From the results in Table 2, it may be said that the AlfaK® program has adequate precision.
In the study by Muminovic, the AlfaK® program permitted finding stress concentration factors for six cases of geometries, but in practice, designers can find many more cases of different types of geometries, given that the AlfaK® program has space for future development and research [5].
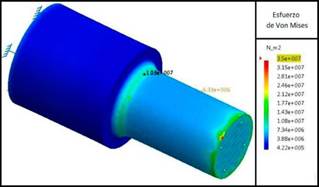
Other studies have been developed through the CATIA V5® program, evidencing the sites that concentrate the different Von-Mises stress (Figure 1). The two previous investigations conducted a geometry study in the AlfaK® program complemented with the CATIA V5® program to visualize the Von-Mises stress. The study presented in this article was carried out in the ANSYS® program and, like the previous, works different geometries to construct different curves with diverse loads.
Furthermore, this research proposes a less time consuming solution when elaborating the stress concentrator curves. Said solution is low cost and does not risk reliability and precision; it uses ANSYS® and Microsoft Office Excel® programs.
This article evidences how the geometries were carried out, their respective meshing with mesh parameters and quality, the types of loads and shapes in which they were applied. Also discussed is the mathematical analysis used to compare the computational data to experimental data; thereafter, the article shows the results of each curve elaborated with its respective analysis. Finally, this document presents the conclusions reached in this research.
2. Methodology
The following methodology will analyze some stress concentrators through the ANSYS® program, showing that the quality of the solutions obtained from these simulations has been within the acceptable interval.
2.1 Geometries
The whole development was conducted by using the different tools offered by the ANSYS® package; the geometric model for all the shapes selected was achieved with the DesignModeler® program. The study presented has four simulation investigations through simulation that differ principally in the shapes of the stress concentrator.
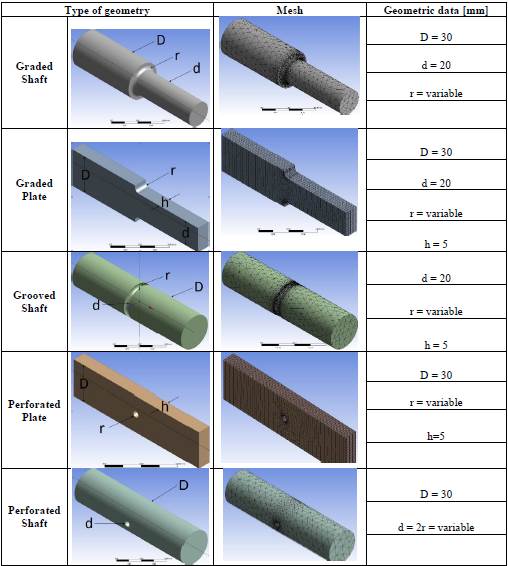
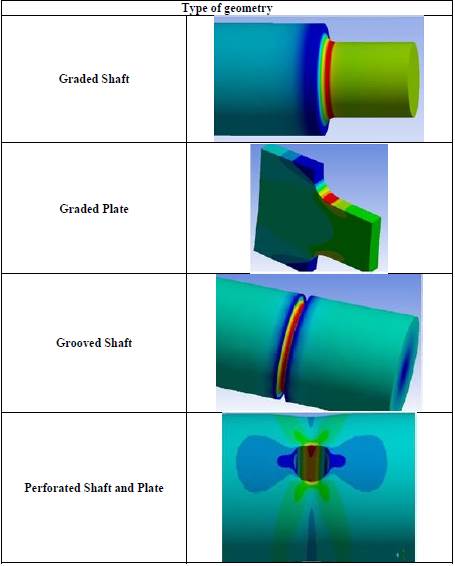
Table 3 shows the different geometries and dimensions developed; these parametrized the radius applied in section change of the cross sections to study their incidence in the stress concentrations.
2.2. Domain discretization
Meshing was conducted in the Mechanical module®, using the methodology proposed by the program developers. The sizing method was used in radii presenting a cross-section change to densify precisely in this zone, given that it is where it is expected to concentrate the greatest amount of stress and more elements will be needed to analyze the result, the values of maximum element size and maximum face size are also parameterized to create bigger mesh elements in the rest of the geometry to diminish progressively the minimum size permitted under the initial default option, thus, generating the increase in the number of elements in the zone to be analyzed. Thereafter, their quality parameters were revised by following the recommendations that indicate ideal obliqueness and orthogonal quality (OQ) values, trying to maintain minimum OQ > 0.1, or maximum obliqueness <0.95. Table 3 presents images of the meshes selected for each geometry under study.
2.3. Solver configuration
Stress concentrations are seen in different ways in the geometries depending on the load applied to the ends. According to the experimental results reported in Applied Strength of Materials by Robert Mott [10], it does not matter if the geometry is similar, stress will behave differently on the surface as in the interior of the geometry. By following the principles of the stress concentrators, the different loads are applied on the outer faces of the geometries; the loads applied were configured according to those reported by [9] and presented in Table 1. All the geometries were configured a load of equal magnitude, but in opposite direction to guarantee the static phenomenon.
2.4. Results obtained
After the simulations, the Solution option was used, selecting the types of results sought. In the study cases, these were, for axial stress and flexing moments: the Von-Mises equivalent stress, and for torsional moments: the maximum shear stress. Upon selecting the result sought, the zones with the maximum force and that of minimum stress were illustrated in color scale.
2.5. Mathematical analysis
The value of the maximum force for different radii in the change of section was entered into Microsoft Office Excel® to calculate the stress concentration factor (Kt) to compare it to the experimental results reported by Mott, (2009). The following shows the equations used to find Kt for axial and flexing loads:

With σ_max being the Von-Mises equivalent stress consulted in the program and σ_nom being the mean nominal stress to which the body is subjected in its section of minimum area if the concentration phenomenon did not occur, σ_nom is found with the following equation for flexing:

With M being the moment for axial loads:

With F being the force applied.
For torsional loads:

With τ_max being the maximum shear stress consulted in the program and τ_nom the maximum shear stress the part would experience in the smaller diameter region, away from the stress concentrators, bearing in mind the principle by Saint-Venant, τ_nom is found with the following equation:

T being the torque applied.
3. Results
Stress concentration is a very common phenomenon occurring in mechanisms, machine elements, and other parts subjected to some type of load, independent of the construction material. The maximum force is concentrated on the abrupt change in the part's cross-sectional area and cannot be calculated through the mean stress model, given that this model is used when the load has uniform distribution. Table 2 evidences how stress is distributed in each of the elements studied, the maximum force is concentrated in a zone, followed by progressively smaller forces; this phenomenon can be noted in all the geometries with variations, depending on the load applied on them.
Figure 2 illustrates the results obtained for the graded shaft when subjected to axial, torsional, and flexing loads.
As observed, strong similarity exists between the experimental curves of the axial and flexing loads and a small error in the curve for the torsional load; this difference is due to an inadequate selection of a parameter in the configuration of results.
In general, upon analyzing the three curves, it may be concluded that independent of the type of load, stress concentration increases with diminished radius according to this figure.
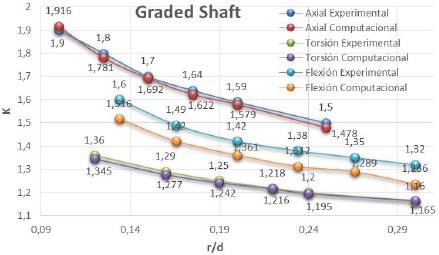
Additionally, the abrupt change of the cross-sectional area results more damaging for graded shafts subjected to axial load and more convenient for the same geometry subjected to flexing load.
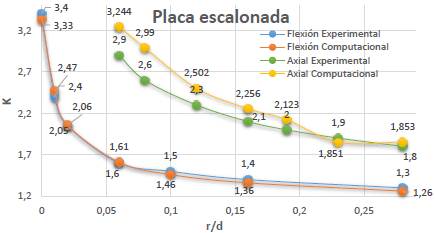
Figure 3 reports the results obtained for the graded plate subjected to flexing and axial load, as noted on the flexing load curve, good similarity exists between the experimental and computational curves. Additionally, with slightly higher errors, but with acceptable results, we find the curve for the graded plate subjected to axial load; the difference of fit between the experimental and computational curves is due to the lack of mesh independence studies that ensure that results obtained will not be affected by this parameter.
Furthermore, it is evident that the radius of agreement and the stress concentration factor have an inversely proportional relation, but said effect occurs faster in plates of this type subjected to flexing; the axial load requires higher radius increases to diminish in equal proportion the magnitude of K.
Figure 4 displays the results obtained in the geometry of grooved shafts subjected to axial and torsional load. From the curves obtained, it may be said that the part supports greater stress when subjected to axial load than when subjected a torsional load of equal magnitude; in addition, it may be noted that the curve showing the axial load results adjusts more to the experimental results than to the results from the torsional load.
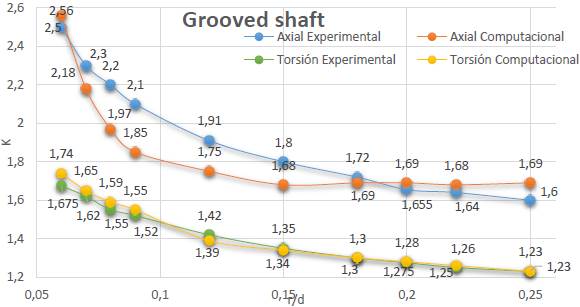
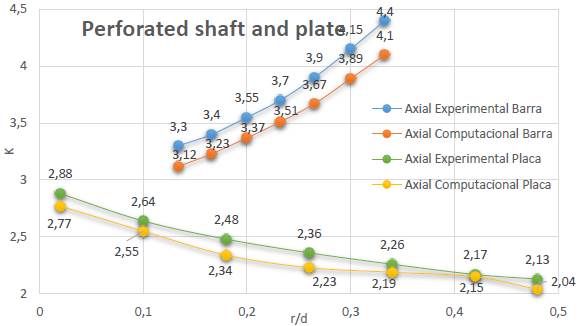
Figure 5 shows the comparison of the results obtained for two geometries with the same load, for perforated shaft and plate, both subjected to axial load. Acceptable differences were obtained, and it should be noted that increased perforation radius increases stress concentrations on the perforated shaft subjected to axial load, but not on the perforated plate.
4. Conclusions
From the model developed in the program, very realistic results were achieved compared to the results obtained with experimental methods published in texts recognized by the academic and scientific community; thus, the simulation methodology was validated in materials mechanical analysis. Due to this, it may be concluded that it is possible to construct curves of stress concentration factors through simulations, with the same reliability as with conventional experimental methods, but at a lower cost.
The DesignModeler® is a very friendly module when constructing geometries, easy to use because its work platform is quite intuitive. The meshing is a complex process because of techniques that must be followed to obtain results from meshes within the acceptable range. As for the densification of elements through geometry, it must be mentioned that as more elements are available in the point being analyzed the result will be more reliable.
The results obtained are acceptable given that the error is low and the graphics obtained are considerably close to those from the scientific literature.

