


 Inglês (pdf)
 Artigo em XML
 Referências do artigo
 Enviar este artigo por email
 Citado por SciELO
  Citado por Google
  Similares em
SciELO
Similares em
SciELO  Similares em Google
 Permalink
1. Introduction
The climatic conditions of the planet have changed since mid-19th century as a result of industrial development, due to the emergence of the affectation of the balance between radiation and atmosphere [25], where an increase in climate variability as a consequence of global warming generates an increase in the amount of energy and humidity in the atmosphere [42]. In this way, there is a heterogeneous increase in temperature due to the concentration of greenhouse gases leading to an increase in the level of the sea surface and greater severity in extreme events [26]. The increase in studies regarding global warming issues has been higher in recent years in different sciences, applying qualitative and quantitative methods, which do not always allow comparisons due to the origin of the information and techniques used. This makes difficult to raise awareness in the global population, given the complexity of the analysis techniques to be expressed in a colloquial language [14].
According to studies by the Intergovernmental Panel of Experts on Climate Change, the global mean temperature of air has increased by 0.6 °C during the last century; the extent of snow cover has decreased by 10%, since the 60's; the average sea level has risen between 0.1 to 0.2 meters during the 20th century [35] and the 1.2% increase of water vapor in the atmosphere leads to more severe and unpredictable localized rainfalls, classified as extreme events [36]. Extreme events are one of the main manifestations of climate change [34], which cause ecological and socioeconomic impacts [16] due to the presence of floods and droughts phenomena, affecting the economy, agriculture, energy, transport, health, water supply, among others [34][33][13].
Extreme rain events are great intensity incidents that might trigger geomorphologic processes of considerable magnitude and important consequences in economic and human loss. Pne of the most significant causes in the appearance of macro climatic phenomena, is the most severe occurrence of the ENSP (El niño-southern oscillation) phenomenon, which results in the increase of material and socio-economic losses by the increase of rains, ground movement and flooding, mainly in the lowland areas of Ecuador, Peru and Bolivia, rainfall deficits and droughts in Colombia and the high plateau (altiplano) of Peru and Bolivia [2]. The scientific community has shown interest in studying how to dampen or reduce climate variability, and what are the critical thresholds in dry or wet conditions. Studies have shown that a 10 % change in the rainfall frequency distribution related to the annual average, is caused by extreme events, as evidenced in patterns seen in case studies of United States, Australia, Japan, United Kingdom Norway, South of Canada, South Africa, Northeast Brazil, Southern China and the ex-former USSR, according to studies by Groisman (1999), Karl (1995), Karl and Knight (1998), Plummer (1999), Iwashima and Yamamoto (1993) and Psborn (2000).
In areas with seasons, the variation in the temporal extension of these has been studied as a result of climate change. Between 1969 and 1980, the European continent has shown a quicker start of spring (early dates), with a trend of 3.5 days / decade [4]. Studies made in North America show that global warming has caused less extreme events in winter, theory explained by the artic amplification of global warming, leading to cold outbreaks less frequent in the winter in the northern hemisphere [38], at showing high positive rates of the North Atlantic Pscillation (NAP) with coefficients of correlation of -0,70 between the NAP (mid February-April) and air temperature in the period from 1989 to 1998 [4].
Trends of rainfall in Colombia have been reflected a decline in Caribbean, Pacific regions, as well as in the south of the Andean region; while in the Amazonian, Prinoquense Foothills and the high plain in Cundinamarca and Boyacá, there has been a rainfall increase.
Colombia will see warming between 1.0 to 1.5°C in the next period, and rainfall changes of +/- 15% of the average annual accumulate between 1961 and 1990, if the trend presented during this period continues [25]. This makes it necessary to deepen the study of the climate trend locally, and thus their alteration on the ecosystem.
The department of Boyacá has been affected by the occurrence of El Niño phenomenon, as occurred in 2010 -2011, which left 80.544 people affected by floods and mudslides: 50 dead, 87 wounded, and one missing person (see figure 1) [30]. Similarly, the rains presented the July 16, 2010, in the high basin of the river Chicamocha, generated overflows and floods in different sectors along the river banks between the municipalities of: Tunja, Tuta, Tap, Sotaquirá, Picatá, Chivatá, Cómbita, Paipa, Duitama, Tibasosa, Santa Rosa de Viterbo, Nobsa, Sogamoso and Firabitova, also, in the municipalities of Tibasosa, Duitama and Sogamoso, more than 300 families were victims of the winter emergency, being relocated in schools and temporary shelters. Also the heavy rain caused the suspension of water service, as a product of the landslide that stoppered several sewer systems of different municipalities [39]. For this reason, the academic community seeks to study variations in the rainfall regime in this region and their consequences on the environment.
The present research analyzes the rainfall pattern of the upper basin of the Chicamocha river, contributing to its probabilistic analysis through the use of Geographic Information Systems and statistical techniques, as a base in the evaluation of risk and vulnerability in populations facing water disasters. Likewise, this research seeks to interrelate rainfall behaviors with global climate patterns, assessing the impact of ENSP phenomenon on rainfall, extreme events, and their trends, to allow concluding how weather has varied in connection with rainfall in the department of Boyacá.
2. Study area
The upper Basin of the Chicamocha River is located in the high mountains of the equatorial Andes of Colombia (Figure 2), hydrographic areas of Sogamoso and Magdalena river, in the east of Boyacá department, Colombia. It rises in the municipalities of Tunja and Tuta, and flows through the municipalities of Picatá and Cómbita, and the valleys of Sotaquirá, Duitama, Paipa, Tibasosa, Nobsa, Santa Rosa de Viterbo, Sogamoso, Firavitoba and Iza municipalities, until it finishes in the hamlet of Vado Castro in the municipality of Sogamoso. The landscape is characterized by plains of lacustrine and fluvio-lacustrine origin, surrounded by mountain chains in sedimentary rocks, with some volcanic bodies in the vicinity of Paipa and a relief of predominantly gentle slopes [28]
The climatology of the basin, due to its own topography and edges of the high plateau, is characterized by having quite dry weathers and low average air temperatures. According to information from the Institute of Hydrology, Meteorology and Environmental Studies (Ideam, by the Spanish acronym), the mean monthly temperature of the basin ranges between 11.5°C and 15.6°C, with an increase in southeast to northwest direction, being higher in the northeast side in the municipalities of Nobsa and Paipa. The lower values of temperature are recorded in the regions located in the upper parts corresponding to the municipalities of Cuítiva and Tunja. A decrease of temperature measured by altitudinal incidence is noticeable; therefore, at 2,500 m.a.s.l., average annual temperature is 14 °C down to 3.5 °C at 3,000 meters.
The temporary behavior of rainfall in the upper basin of Chicamocha river presents a predominance of a bimodal regime, as a consequence of the trade winds and the east branch of the Intertropical Convergence Zone (ITCZ). There are two rainy seasons: in March-April-May (MAM) reaching 300 mm, and a second period of Pctober-November (PN), as well as two dry periods with less rainfall during December-January-February (DEF), July-August (JA). In the area of Sogamoso, limits with Aquitania, the behavior is unimodal, with a rainy period from April to Pctober (AMJJASP), and maximum records during July. From the annual spatial distribution (Figure 3), it is observed that on average the region with the least rainfall regimes is presented in the area southwest of the basin; while to the northeast of the basin, the higher regimes of rainfall are presented.
3. Data and Methodology
For the development of the study, the information of meteorological stations on the island belonging to Ideam was considered, the agency through which we obtained the historical information recorded of the total monthly and maximum monthly rainfall and the location of stations. For the analysis of the incidence of the macroclimatic variables, we used the series of the Southern Oscillation Index (SOI) and Sea Surface Temperature Index (SST) from the NOAA (National Oceanic and Atmospheric Administration) of United States, downloaded from the website www.cpc.ncep.noaa.gov in the Region Niño 3-4.
The SOI measures the strength and phase of the Southern Oscillation, calculated through the deviations from normality in the air pressure difference in the surface between Tahiti in the French Polynesia and Darwin in Australia. During El Niño events, the SOI has a negative value due to the air pressure being below normal in Tahiti and the pressure is higher than normal in Darwin. During La Niña, the reverse effect occurs. The SST identifies the presence of the climate anomaly El Niño when it is greater or equal to +0.5 °C, neutral between-0.5 and +0.5 °C and La Niña, less than or equal to-0.5 °C [22].
The study was carried out in six stages, which are described below:
3.1. Selection of the weather network
For the selection of the time period to study, as a first step, the analysis of existence of information was carried out through check-in schedules of each station, identifying irregularities in the registration of rainfall. Said analysis allowed to select the most representative stations (those with a greater number of years with a record). Following the recommendations of the World Meteorological Organization (WMO), the criterion of selection established was that only the stations that were in a continuous period equal to or exceeding 30 years, and did not present gaps greater than or equal to three consecutive years were selected. Likewise, we determined the percentage of missing data in the historical series within the period of analysis, and disregarded the stations with more than 20% of missing data.
3.2 Quality control of information and atypical data.
The historical series of the climatic variables analyzed had quality problems. This made necessary for each one of the selected stations, to assess atypical data or outliers, using the Tukeyel test. Once the atypical data was identified, its validity was verified by comparing it with the occurrence of ENSO phenomena on reference dates or similar behavior with respect to the nearest station. Information was considered missing data in cases in which the criteria are not fulfilled. Completion of missing data was performed using the software HIDROBAS, which allows, by using statistical techniques, the contrast, correction, completion and restoration of rainfall and temperature data [23].
For the respective start of the correlation analysis and trends of the rainfall, it was necessary to ensure the accountability of the changes caused by the natural dynamics of the weather. Historical climate series may stop being homogeneous when the metering station has undergone changes of instruments, location or change of operator or environment [35]. One way to verify the homogeneity is confirming that the changes observed in a candidate series are also recorded at a nearby reference station, a process carried out through the software HIDROBAS.
3.3. Rainfall thresholds
One of the statistical procedures that allows the determination of extreme events is the frequency analysis, which consists in calculating the magnitude associated with a return period, whose reliability is based on the length and quality of the historical series and of the selected probability distribution [1]. For this study we have compiled daily records of maximum monthly rainfall of the meteorological stations, data with which we identified a series of annual maximum rainfall of each station, with the aim of identifying, in each of the selected stations, the probability distribution with the best adjustment, through the tests of goodness-of-fit R2 and Kolmogorov-Smirnov, and thus observe significant differences between the fitted distributions. Once the distribution with best fit of each of the stations was determined, we proceeded to calculate the value of extreme rainfall with return periods of 5, 10, 50, 100 and 200 years. Within the probability distributions most used in hydrology to quantify the risk associated to extreme rainfall values, there are the statistical distribution functions: Pearson Type III, Gumbel, Weibull and Frechet, especially these last three [5].
Pearson Function (Type III), is an asymmetric function defined for positive values of the variable that are consistent with the properties of most of the hydrological records, or physical variables of interest in hydrology [41]. The distribution of extreme values type I (Gumbell), is a model that represents the limit distribution of n values xi independent and identically distributed in a exponential way as n grows indefinitely [41]. The distribution function for extreme values type III (Weibull), is characterized by that the low values are much higher; the bias is moderately negative, being almost the mirror image of the Erlang distribution [27]. And the distribution function for extreme values type II (Frechet), presents a mathematical expression similar to that of Gumbel, but the reduced variable is linked with the original random variable in logarithmic form [19].
3.4. Analysis of linear correlation of the SOI and the SST with rainfall
The linear correlation of Pearson was calculated, with gaps (lag) between rainfall series of the studied stations, and the SOI and SST indexes. Significant correlations according to test student's t were identified, which allows analyzing the influence or incidence of the mentioned macro variables on rainfall, with a lag of zero, one and two. The Pearson correlation coefficient determines the degree of association between two variables, without assessing the concordance level; it varies between - 1 and + 1, having as an indicator the value of 0, which indicates that there is not linear association between two variables [20].
3.5. Rainfall and temperature trends
The determination of the increasing or decreasing trends of the climate variable of rainfall at an annual rate is developed based on the Mann Kendall non-parametric test, given its validity as results obtained by Hoeffding [1948], Hirsch et al. [1982] and Gilbert [1987]. The application of the Mann-Kendall test, ideal for independent and identically distributed data series, where the significance level for which we reject the research hypothesis (p-value) is less than or equal to 5%. Likewise, the magnitude of the trend is estimated through the Sen method to calculate the slope of a linear trend [40] [10].
4. Result
The period selected in the analysis of rainfall historic time series, which allowed a increased coverage and density of the station, was 1980 to 2012, obtaining 20 stations within the basin and 28 stations around, to generate rainfall fields with a higher interpolation setting (figure 4).
Figure 4 Map of location of the stations (points) for the period 1980 - 2012, Source: authors, 2015.
4.1 Extreme Events
According to the graphical analysis, a better behavior was presented with the probability distribution function of Frechet. This was verified with the test of goodness of fit R2 and Kolmogorov-Smirnov test, which identified that 56% of the stations showed a better fit to the Frechet type probability distribution. While 19% to the Pearson type probability distribution; 20% to the Gumbel type probability distribution and the remaining 3% to the Weibull type probability distribution (figure 5).
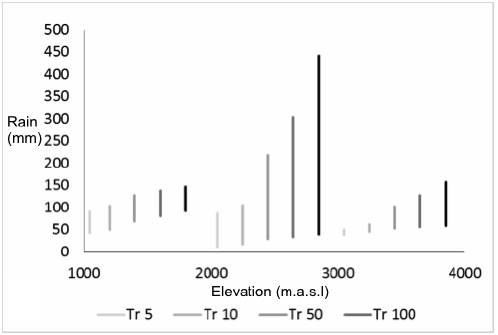
Through the analysis above, we assessed the spatiotemporal variability of the rainfall thresholds for the return periods analyzed. From the change of altitudes, and comparing the hydrologic conditions, significant differences were found in the stations located at an elevation between 2,000 and 3,000 m.a.s.l., with variations of up to four times those presented in other climate zones (figure 6).
4.2 Incidence of SOI and SST
With the historical series of the SPI and SST, we determined the coefficient of Pearson between the macroclimatic variables and monthly rainfall. When analyzing the influence of climatic anomalies from the Pacific, through the SPI with rainfall, a log of zero, one and two months, the largest incidences with the lag of one month are observed, indicating that the climate anomaly presents a higher incidence a month after this occurs. The highest correlation occurs in the months of December to January and June, with values around of 0.37. The months of April, May, and Pctober showed correlation coefficients of about 0.04, indicating null influence of these macroclimatic variables on rainfall behavior. The municipalities of Duitama, Sogamoso and Paipa, presented a relevant positive association (greater than 0,4) during the quarter of JJA. Pn the other hand, in Paipa, Samacá, Siachoque and Villa de Leyva the high incidence occurs in the DEF quarter, corresponding to the dry months in the region of the upper basin of the Chicamocha river (figure 7).
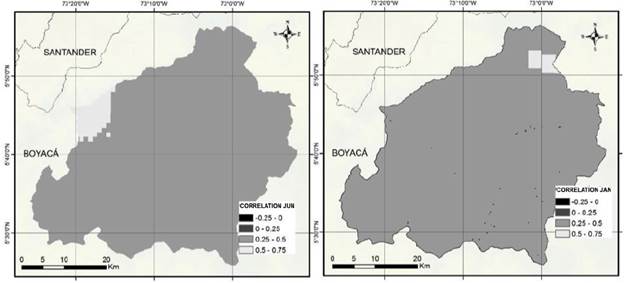
Analyzing the incidence of SST, with rainfall at the time lags of zero, one and two months, the highest rates of correlation are found in lags of 1 and 2, indicating that the climate anomaly presents a higher incidence in the territory of the upper basin of the Chicamocha River in the first and second month after the incidence. Likewise, the highest incidence occurs in the months of December and January, with values around 0.39. Pn the contrary, the months of April, May and October have a correlation coefficient that is close to 0.05, indicating a low influence of the macroclimatic variables on rainfall behavior. The municipalities of Tuta, Duitama, and Toca, have a relevant negative association (less -0,4), during the quarter in JJA, while in Paipa and Duitama the inverse incidence is presented in the DEF quarter (figure 8)
The results found in the incidence analysis of the macroclimatic variables SPI and SST on rainfall validate previous research by Cortés, 2012 and Corredor, Camargo, and Guerrero, 2008, reflecting that in the Boyacá region and in particular in the high basin of the Chicamocha river, the influence of the macroclimatic phenomena is low. Likewise, it is confirmed that the studies conducted by Poveda, G., Gil, M. M., Quiceno, N., 1998, where it was found that the highest dependence of the mentioned macroclimatic variables occurs in the quarters DJF and JJA.
4.3 Trend of rainfall
In general terms, when carrying out the historical analysis of rainfall, it was found that during the period of 1980 to 2012, the rainiest decade corresponded to the period 1980-1990. In this aspect it was followed by the 1990-2000 decade; however, a progressive increase is seen in particular in the stations of Antena Tv and La Rusia, who have presented an increase of up to 20% of the normal mean values, in the period from 2000 to 2010. (Figure 9).
Figure 10 shows the typical example of the rainfall tendency to increase in mm- station level; in addition, it shows the trend of the rainfall seasonal series according to Kendall slope estimator. Regression models were applied to these, according to data dispersion to identify trends or patterns.
Based on the results of the non-parametric Mann-Kendall tests and Sen's slope estimator, the behavior of the historical annual rainfall series during the period 1980 to 2012, show significant changes [confidence level over 90%] on the annual rainfall at 11 stations [22.9%], of which only three are located within the basin (Station of Duitama - Cómbita - San Cristóbal). The 37 remaining stations presented a questionable reliability. The stations with significant changes show an increasing trend according to the Mann-Kendall test.
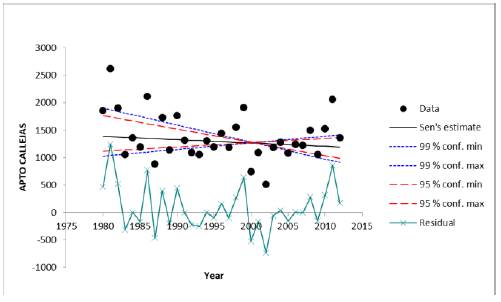
Figure 10 Test of Mann-Kendall, station Apto Callejas, municipality of Sogamoso, Source: authors, 2015.
Figure 11, shows the increasing or decreasing trend of historical series, according to elevation; introducing greater magnitudes between 2,200 to 2,800 meters above sea level, with values that reach up to 11 mm/year; opposed to the range of elevation of 2,900 to 3,200 meters, where rainfall comes to decrease up to a magnitude of - 6 mm/year, in the climate zone of the Paramo of Duitama municipality. The linear trend decreases, in the stations Antena tv, La Rusia, Sena and Sotaquirá with values ranging between -6,4 with- 1.5 mm/year. The most significant increasing trends are located in the stations of Tunguavita [10.9 mm], Surbata Bonza [9,6 mm/year], Nobsa [8.7 mm/year] and Palermo [7.9 mm/year] according to the value of Sen´s slope estimator. When comparing rainfall trends during the period of 1985-2008 obtained by Rojas (2010), we found similar results for the UPTCS station; however, for the Tungavita and Nobsa station, the annual trend is approximately double than that determined by this author; this is attributed to the difference in periods analyzed].
The upper basin of the Chicamocha river presents an average increase of 3mm/year in rainfall; the sub-basins have tendencies of: Chicamocha riverbed presents an average at 7.3 mm/year; Tuta river 6.1 mm/year; Salitre river 5,2 mm/year; Jordan river, to 4.5 mm/year; Embalse La Copa 3.2 mm/year; Chiticuy river 3.0 mm/year; Sotaquirá river 1.9 mm/year; Tota river 0.6 mm/year; Pesca river -0.2 mm/year; Surba river -1,0 mm/year; De las Piedras river 1.2 mm/year and Chiquito river -2.0 mm/year; as is shown in figure 12.
Such variations do not only have impact on ecosystems. Pn the contrary, if the trends presented within the period of 1980 to 2012 are maintained, it is expected to generate a decrease in water surface available in the area of Pesca Surba, Piedras and Chiquito rivers, creating scarcity of drinking water and agricultural use, the latter being a main source of income of the basin. The above forces the human being to intervene in the mitigation of climate change effects and its consequences in the economic development of the population, when considering the water resource as one of the main ecosystem services that guarantee dignified life to the population
5. Conclusions
There is evidence that the magnitude of rainfall extreme events in the upper basin of the Chicamocha river significantly differ in the altitude range between 2,000 to 3,000 m.a.s.l, which may affect more severely the economy and development of the regions located in these sectors; therefore, the environmental authorities must ensure the use of the ground according to their power and so prevent the development of agricultural and industrial activities that generates faster degradation of the strategic ecosystems of high mountain (Paramo and Andean Forests) which serve as environmental regulators.
The results of this research related to the ENSP phenomenon, allow to deduce that it is associated to extreme variations, which generate a decrease or increase in the magnitude of rainfall present in the upper basin of the Chicamocha river. Likewise, the temporal lag between the anomaly of the Pacific Pcean and the maximum rainfall is one month. However, it is inferred that the anomalies in the ocean are not constant in time, which does not have a significant effect on the behavior of the rain in the upper basin of the Chicamocha river.
The trends of rainfall series showed significant changes during the period of 2000-2012, due to the strong climatic anomalies in the Pacific Pcean presented during this decade. In geographical terms, the increase of rainfall in this semiarid region can be reached to promote the hydrological regime.
The largest increase impacts estimated in the annual rainfall are presented in the central region of the upper basin of the Chicamocha river and the impacts of the decline are located in the south-east area and north end region, creating strong socioeconomic implications, favorable for agricultural production and unfavorable in threats of flooding and slippage, a situation that demonstrates the need to raise environmental policies, in relation to the prevention and mitigation of the climate change, as is the protection of strategic ecosystems present in the upper basin of the Chicamocha river.
If climatic trends presented in the period from 1980 to 2012 are maintained, significant changes will be noted in a period of less than 30 years, in the biodiversity of the territory, creating local extinction of the species more susceptible to limited climatic ranges, which will result in a loss of productivity in ecosystems. Similarly, the climate change generated events of greater magnitude and frequency making necessary the study of rainfall as a non-stationary variable.

