


 English (pdf)
 Article in xml format
 Article references
 Send this article by e-mail
 Cited by SciELO
  Cited by Google
  Similars in
SciELO
Similars in
SciELO  Similars in Google
 Permalink
1. Introduction
Reflection is the most important variable in remote sensing because solar radiation interacts with the earth's surface, which reflects that energy according to the type of coverage present on it; the flow of the reflected energy is detected by the sensor, which then transmits it to the digital data storage stations. The atmosphere interposes between the earth's surface and the sensor, which scatters and absorbs part of the original signal 1.
The electromagnetic radiation captured by the sensors of the satellites passes through the atmosphere and is modified by effects of scattering due to the interaction with molecules and particles of the atmosphere 2. The Rayleigh scattering is produced by the molecules of the atmospheric gases and is one of the main causes of haze, which creates a decrease of the contrast of the image 3. However, the scattering and absorption caused by aerosols are difficult to correct due to their variation in time and space, what constitutes the more severe limitations in the radiometric correction of the satellite data 4.
In addition, the uncertainty of the equipment and mathematical models used in the estimation of the values of surface reflectance, can influence the quality of the data. Nevertheless, authors such as 5) (6) (7) (8) (9 and 10; have made considerable progress in the development of methods or algorithms for the atmospheric correction of images, which aim to minimize the levels of uncertainty induced by the mathematical modeling in the estimation of the absolute reflectance values for the coverage of the earth's surface.
When the use of satellite images is required for the characterization or monitoring of natural environments, it is necessary to eliminate the atmospheric effects contained in the images through the application of radiometric and atmospheric correction techniques, which are of great importance in the processing of this type of data.
For this, there is a series of algorithms developed and available automatically in the software tools for the digital processing of the images. However, it is possible to perform the radiometric calibration of satellite images by using field radiometric data acquired under equivalent conditions on the surface observed or contained in the scene to be corrected 11) (12.
Therefore, the main objective of this research was to statistically compare the reflectance values at the ground level obtained by using the correction models ATCOR, and empirical linear models (ELM) applied to WorldView-2 images in a marine environment area.
2. Materials and methods
2.1 Study area
For this research the reef formation of the island-cay Roncador was taken as study area, it is located in the southwestern part of the Caribbean Sea, in Colombia, in the insular area of the San Andrés and Providencia archipelago, between the coordinates 601159.799E and 1495917.939 N (Figure 1).
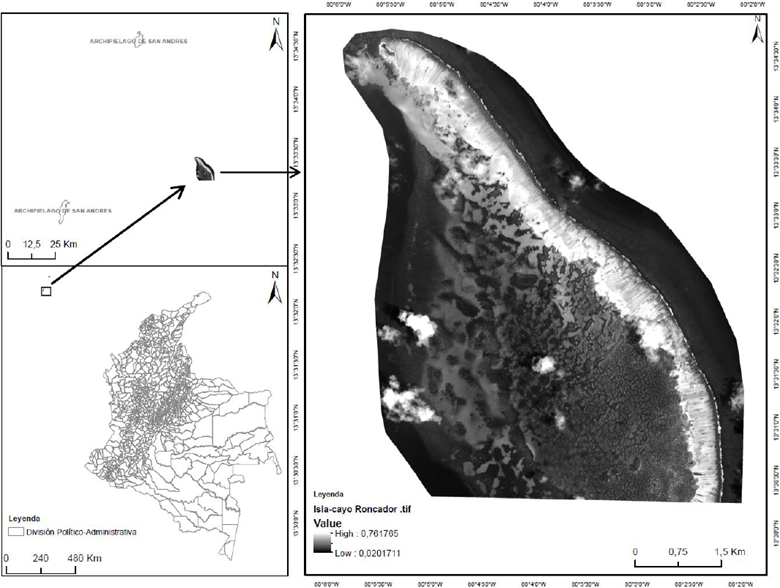
In general, the island Roncador is in the intertropical zone of the Caribbean, influenced by its physiographic characteristics and the currents of the trade winds in northeast direction.
It has a warm-humid climate with an annual average temperature between 17°C and 35°C and a relative humidity of 81%; the annual potential evapotranspiration is 1740 mm; the average monthly values vary between 116 mm for the months of October-November, and 177 mm for March-April.
As for the levels of precipitation, average values are recorded of 1850 mm per year, with a monthly distribution of monomodal type; it is characterized by a low rainy period between January and April where 8% of the total annual is registered, and a period of high rainfalls, between June and November with the 75% of the total annual 13.
For this research, the image corresponding to the sensor WorldView-2 was selected with a shooting date of March 19, 2015 at 16:00:21 and spatial resolution of 2.0 m for the multispectral bands and 0.5 meters for the panchromatic band.
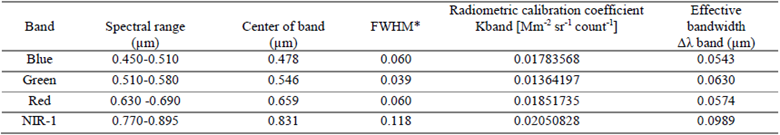
The spectral bands used were Blue, Green, Red and NIR-1 (Table 1). The percentage of clouds for the image employed is 0.039%.
2.2 Selected image
For the development of this research, the image corresponding to the sensor WorldView-2 was selected with a shooting date of March 19, 2015 at 16:00:21 and spatial resolution of 2.0 m for the multispectral bands and 0.5 meters for the panchromatic band; the spectral bands used were Blue, Green, Red and NIR-1 (table 1). The percentage of clouds for the image employed is 0.039%.
2.3 Field data
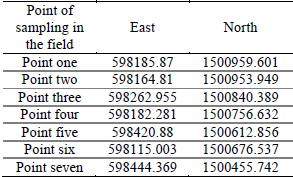
The capture of spectral information from the different coverages in the field was performed by the use of the r FieldSpec 4 spectroradiometer, and four types of clearly dominant and identifiable coverages were characterized within the seven sampling points distributed in the study area (Table 2). The range of the wavelengths of the equipment varies from 350 to 2500 nm, with a sampling interval of 1.4 nm for the region of 3500-1000 nm, and 2.0 nm for the region of 1000-2500 nm. The capture of spectral signatures was carried out between 10.30 a.m. to 2.00 p.m., at a height between 1.5 and 0.30 meters from the apex of the sampled coverage; Twenty (20) replicas were taken for each coverage, with a time interval of two (2) seconds. The effective capture area in function of the height and of the field of vision- FOV (25°) of the optical fiber of the spectroradiometer was 146 and 23 cm diameter respectively.
The information collected was organized in the metadata files for each spectral signature, where information was recorded regarding to the coordinates of the capture points, characterized coverage, weather conditions, the time of capture, the angle of solar incidence and the photographic record, among others.
2.4 Selected correction models
The usual techniques for the atmospheric correction can be grouped into physical models of radiative transfer based on information obtained from the image itself and methods of empirical adjustment. In the case of the physical models of radiative transfer are based on the simulation of the atmospheric conditions according to the physicochemical characteristics of these at the day and time of image acquisition 1.
In the processing of the image WorldView-2 the empirical linear atmospheric correction model (ELM), which is based on simple linear regression analysis, and the automated model ATCOR, based on the MODerate resolution atmospheric TRANsmission algorithm (MODTRAN) 14.
The atmospheric correction performed using the empirical linear model is an alternative to the radiation transfer modeling strategies. The implementation of the ELM is relatively simple, requires a set of calibration points in the field, invariant in time, to calibrate the reflectance in the earth's surface. This model has been successfully applied in satellite images of the Landsat ETM+, LDCM and Sentinel 2A sensors.
The ELM assumes a linear relationship between the digital levels (DL) in the image, and the reflectance (p) in a spectral band (λ).

Where the gain factor, slope (m) and the intercept factor, offset (b) parameterize the correction model. The estimation of these factors is performed by solving a linear system of equations with two unknowns and as many equations as there are calibration points in the field. The system is solved with the least squares method, which minimize the sum of squared errors of each equation of the system.
The ATCOR correction model allows to calculate the reflectance values at the level of the ground surface, eliminating the atmospheric effects in satellite images and the preparation of these for analysis in different atmospheric conditions 15. This model is based on the radiation transfer algorithm MODTRAN4, developed by Spectral Sciences Inc. 16.
This model is initially supported in the standard spectral radiation equation for each sensor pixel (L), applied to the range of solar wavelength and Lambertian surfaces, flat or equivalent 17.
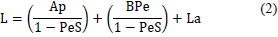
Here:
p is the reflectance on the surface of the pixel ;
Pe is the average of the reflective surface for the pixel and a surrounding region
S is the spherical albedo of the atmosphere
La is the return radiation scattered by the atmosphere
A and B are the coefficients that depend on the geometric and atmospheric conditions, but not on the surface.
2.5 Data processing
For the atmospheric correction of the image using ELM, the "Empirical lineal" tool was used of the ENVI 5.2 software.
For this, the previous edition of the band centers was needed depending on the spectral range for the Blue, Green, Red and NIR-1 bands according to the information contained in the image metadata. The previous step is strictly necessary, given that initially the central values of each bandwidth come by default in digital levels (DL) and are required by the tool in units of nanometers (nm); as a product of the previous step, a new image file was obtained in HDR format which contains the DL calibrated values and the effective center band in nanometers.
Given that the basis of the ELM method is radiometrically correcting the image based on the spectral information collected in the field, the extraction of the spectral profiles for the pixels belonging to the field-characterized coverages was performed (Figure 2b), keeping the spatial relationship with the geopositioning of the sampling points.
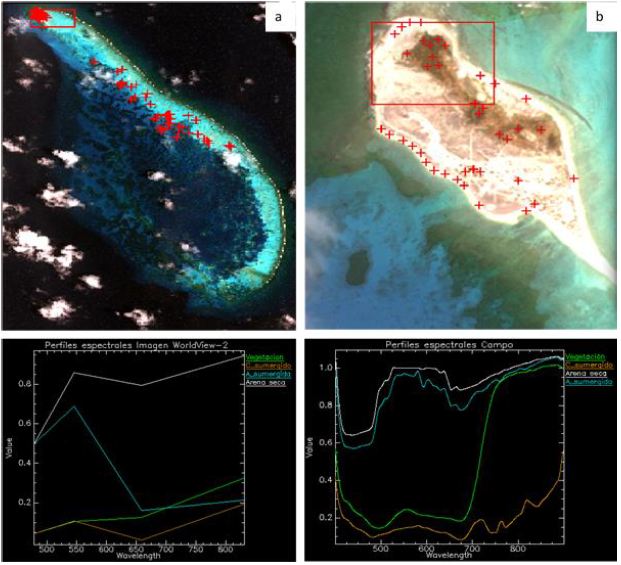
Figure 2 Spectral profiles of the coverages evaluated: a-sampling points for spectral comparison; b-coverages characterized in field; c-spectral profiles image Worldview-2; d- spectral profiles of field.
The coverages used for the application of the correction model were: vegetation, dry sand (beach), submerged sand (sandy bottom) and coral reef. The spectral profiles obtained for each sampling point and their replicas were compared with the respective coverage profiles captured in the field (figure 2d), with the purpose of obtaining an empirical linear equation that would allow to predict the real reflectance values for each band of the image as from the field information
2.6 Sampling points for spectral comparison
For the spectral comparison of the reflectance values obtained for each correction model, eighty (80) sampling points on the image were stratified randomly (Figure 2a).
2.7 Points of spectral validation
Sampling points categorized as spectral field reference were used for the validation of the spectral behavior of images resulting from the atmospheric correction models used. These points were selected based on the quality of the collected data and the type of coverage to assess. The sampling points used for the spectral comparison differ from those used in the implementation processes of the ELM model and comparison between models.
2.8 Statistical treatment
A basic descriptive statistical analysis was applied to the reflectance data obtained for both correction models to analyze the central tendency measures. Afterwards tests of homoscedasticity (Kolmogorov-Smirnov) were applied, with the purpose of establishing the type of distribution of the data and thus selecting the adequate statistical test for analysis of variance and correlation, as recommended by 18; finally, in order to analyze the spatial behavior of these variables, it was applied the non-parametric test of Kruskall Wallis and the tests of cross-validation by using the index of Spearman, which were selected on the basis of the non-parametrically distribution of data.
3. Results and discussion
In a general, figure 3 shows the difference in contrast and sharpness of the corrected images by using the ATCOR and ELM models with a real color composition. A better contrast can be seen in the corrected image with the ELM model, which is due to a greater compensation of the reflectance values of each pixel depending on the spatial variation for the solar irradiation and the effects generated by the hydrosols and aerosols that are suspended on the marine surface layer.
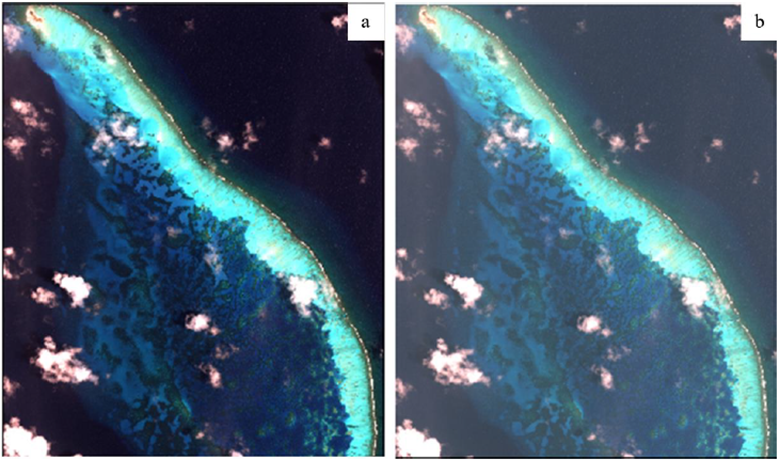
Figure 3 Atmospheric corrected images: ATCOR (a) and ELM (b); both present the combination RGB 3, 2, 1.
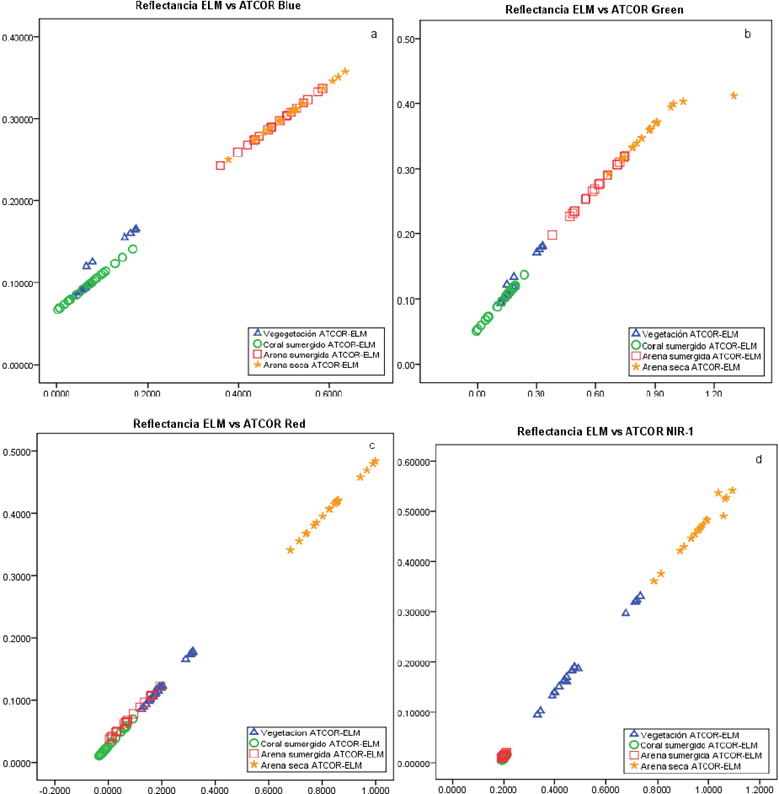
Figure 4 Linear regression analysis of the reflectance values for the coverages used per band, obtained by the ELM and ATCOR models: a - Blue band; b - Green band; c - Red band and d - NIR1 band.
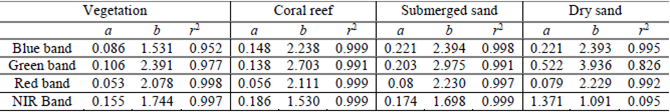
The statistical results record similar coefficients of regression and correlation, for the data of both images. However, it is observed a variation in the behavior of the intercept (a), where the near infrared band (NIR) registers the highest values in terms of the cut-off point; with a slope of the line (b) between 1.09 and 3.93, especially for the dry sand (beach) coverage and correlation coefficients above 0.9, with the exception of the green band (Table 3).
Table 3 Regression and Correlation coefficients between the reflectance values for the ATCOR and ELM models: a- intercept, b-slope of the line; r 2-coefficient of determination.
Regarding the variation of the data for each model according to the coverages analyzed, it is found that the highest standard deviation occurred in the vegetation class, mainly for the NIR-1 band (Table 4). These variations are mainly due to changes in the coverage caused by the type of use, phenological state of the vegetation, the soil conditions and the atmosphere. The dispersion analysis for the reflectance values obtained by the ATCOR and ELM models at each wavelength showed differences not statistically significant at a significance level of p<0.05, so it was obtained a single behavior, which groups the 100% of the data for each spectral range.
Table 4 Standard deviations and root mean square error (RMS) for the spectral behavior of each of the classes used for the calibration of the image.
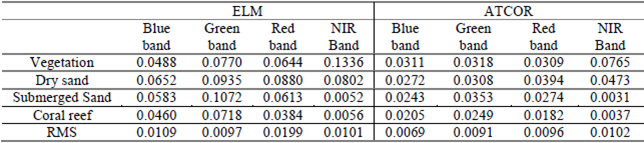
According to the Spearman's correlation index, the data have a similarity higher than 90%, which varies according to the bands: Blue (r2 = 0.99), Green (r2 = 0.96), Red (r2 = 0.94), and NIR-1 (r2= 0.98).
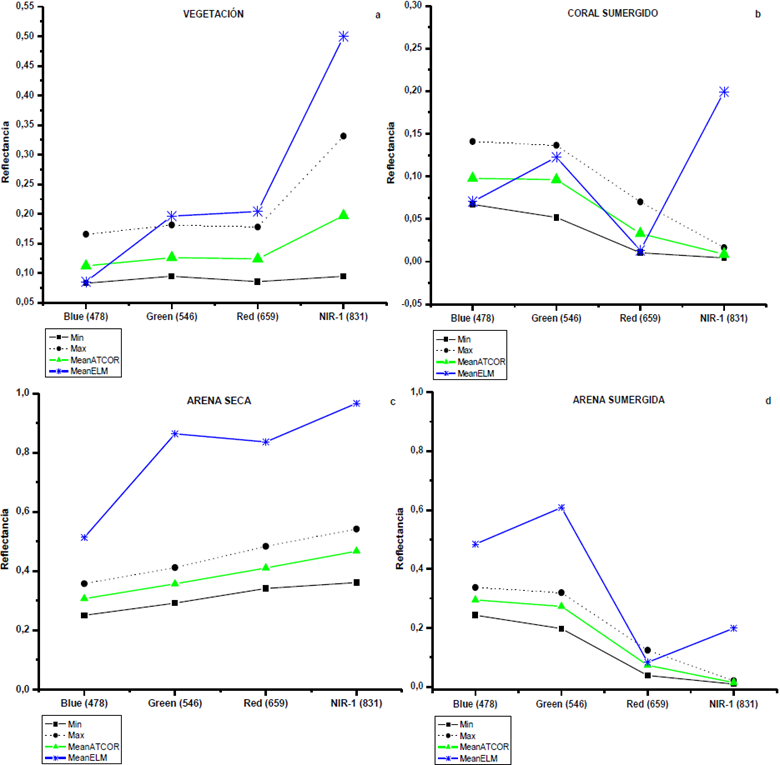
The individual analysis of reflectance values for each coverage, according to the tested models, indicates that the smallest differences were in the visible region, which is due to the relatively low variation of the optical properties of the vegetation, dry sand and coral reef classes.
It could be established that, for the dry sand and reef coverages, the differences in the reflectance are very small, specifically for Blue, Green and Red bands, with a RMSE of 6.5%, 7.2% and 6.4% respectively. Nevertheless, significant differences (r = 0.02 p-value 0.05) are recorded for these coverages in the NIR region (figure 5), with variations of magnitudes of 23.6%, which is caused by the high reflectivity that presents the vegetation covers in that region.
4. Conclusions
Based on the results obtained, it is considered that the ATCOR and ELM correction models estimate reflectance values with variations not statistically significant; which fluctuate according to the type of coverage to be assessed.
However, the ATCOR model, presented the trend to produce considerably low reflectance values for all the coverages evaluated and in each spectral region; results that resemble to those obtained by 18, which argues that the tendency of the ATCOR model to present low values can be associated to the spatial distribution of hydrosols and saline ions contained in the water vapor layer (albedo effect) suspended on the marine surface.
On the other hand, it is confirmed that with the implementation of linear models based on field, spectral information are obtained superficial reflectance values of greater similarity to the reality on the ground, as well as greater spectral separability of the coverages contained in the satellite images to be corrected atmospherically.
Nevertheless, it is recommended to be cautious with the implementation of this type of models since these are adapted with greater precision and detail to images of high spatial resolution and are conditioned to the quality of the spectral information captured in the field.

