


 Inglés (pdf)
 Articulo en XML
 Referencias del artículo
 Enviar articulo por email
 Citado por SciELO
  Citado por Google
  Similares en
SciELO
Similares en
SciELO  Similares en Google
 Permalink
1 | INTRODUCTION
Air quality in the world is a concern both in developed and developing countries, because of the impact it has on human health and in the environment [1]. The World Health Organization (WHO) estimated that the atmospheric pollution on cities and rural zones across the world triggers 4.2 million of premature deaths each year [2]. Besides, it has a negative impact in social and economic development, given that the impact on health increases absenteeism and labor inabilities, medicine expenses and family medical appointments [3],[4], as is revealed by epidemiology studies founded on long term measurements obtained in a large number of monitoring places [5]]. These studies have provided evidence that exposure to environmental levels of air pollution has several impacts on health, from morbility by specific causes to mortality.
In 2018, Gouveia et al. [6] obtained for PM 10 an increase of 0.47% (0.09-0.85ppm) in the risk of death by respiratory diseases in babies, 0.58% (0.08-1.08ppm) in children from 1 to 5 years old, and 1.38% (0.91-1.85ppm) in children from 1-14 years old in four large urban centers: Mexico City, Santiago de Chile, Sao Paulo and Rio de Janeiro in Brazil. Ramirez-Aguilar et al, (2015) [[7]], observed that an increase of 10 μg/m3 in the daily average of a personal exposure in two days at PM 2 . 5 is associated to a significant percent increase of the respiratory symptoms in adults with chronic obstructive pulmonary disease (33% cough and 23% phlegm). Likewise, there is evidence that the pulmonary function improves when exposure is reduced, even in long-term exposures; with a net decrease of 10 μg/rm of PM 10 for a period of 10 years [8]. International studies of temporal tendencies conducted in places such as Istanbul [9], South Korea [10] and China [11] enabled the development of strategies for management of air quality in each city or district, which is why the comprehension of status and evolution of air quality levels is crucial to back-up the development and implementation of international, national and regional policies [12].
In Mexico there is enough scientific evidence to point out that exposure to air pollutants affects human health, sustainable productivity of ecosystems and the economy of the country [4]. According to official data, in 2015 the atmospheric pollution represented environmental costs equivalent to 3.2% of the Gross Domestic Product (GDP). Also, diverse research has been conducted in order to contribute to the norms and regulations on air quality, enabling the evaluation of air pollution in urban zones in southern Latin America. According to the study conducted by Clean Air Institute [4] for air quality in Latin America in 2011, in Mexico data were validated from monitoring stations for five pollutants (PM 10, PM 2.5, O 3, NO 2 and SO 2) for Mexico City, Puebla, Juarez, Guadalajara and Monterrey; resulting in annual average concentrations for PM 10 [5]7.0 to 85.9 μg/m 3], PM 2S of 26.0 μg/m 3 , O 3 [46.3 to 55.2 μg/m 3], NO 2 [29.0 to 54.2 μg/m 3] and SO 2 [8.6 to 15.3 μg/m 3].
Concentrations for PM 10, PM 2.5 and O 3 surpassed the OMS air quality guides, which is why a planning from the Air Quality Management was required, as well as an effective monitoring [4]. These studies have evaluated the temporal variability, as well as the annual, seasonal, weekly and daily concentrations, in an attempt to comprehend the tendencies of the concentrations and, finally, come up with an efficient reduction strategy [10].
One of the important aspects to improve the air quality in a given region is to identify the pollutants emission source. The city of Villahermosa, Tabasco, due to the accelerated demographic growth, presents serious issues in urban development, mainly because of the vehicle fleet increase. In 2015 was reported a vehicle fleet of 546.970 [13] of which 49% is focused on the State Capital.
Among the main activities are: Secondary activities, conformed by the manufacturing industries, construction and gas provision through ducts to the final consumer (67%), followed by the tertiary activities (32%) which encompasses the services that satisfy human basic needs, and the primary activities (1%), integrated by agriculture, animal breeding and exploitation, forest and fishing [14] which have caused greater pollutant emissions onto the atmosphere, hence affecting the population. The inhabitants in the state of Tabasco have presented morbility causes associated to increase in risk con contracting chronic respiratory infections as well as an increase in mortality by heart associated diseases. According to state authorities, in 2015 in Villahermosa and Nacajuca, 49 mortality cases by cardiovascular diseases, 39 by cardiopulmonary diseases and 1 for lung cancer could have been avoided, if the standard regulation on suspended particles was met [14]. In this regard, is important to develop trend studies for air quality in the city of Villahermosa to strengthen the integral management program for air quality in Tabasco, and that the population contributes, along with the government, to mitigate emissions onto the atmosphere. For this is necessary that the people are informed and aware of the situation.
Considering that the general population and the academic community are two main axes to contribute with the government, with effective actions for the improvement of air quality in a region, the objective of the research was to analyze the historic information on criteria air pollutants in Villahermosa, Tabasco, Mexico, as well as the forecasting and indicator tools, ideals as an effective communication strategy of air quality in the State's atmospheric monitoring network through a website.
The website pretends to provide to all involved actors a dynamic tool, easy to comprehend and with unique elements in Mexico, which would allow to any State or metropolitan area that adopts this program, to place itself in a privileged place in regard to the air quality management.
2 | METHODOLOGY
2.1 | Study Area
Villahermosa, Tabasco is located 904km southeast of Mexico City (Latitude 17.9188, longitude -92.3875) Fig. 1. Its population is 705.804 inhabitants [14]. It has a warm humid weather and an annual average temperature of 27°C. The warmest month is may (36°C) and the coldest in average is January (18°C). Annual average precipitation is 2.550 mm, with rains during the entire year, while is most abundant from June to October [13].
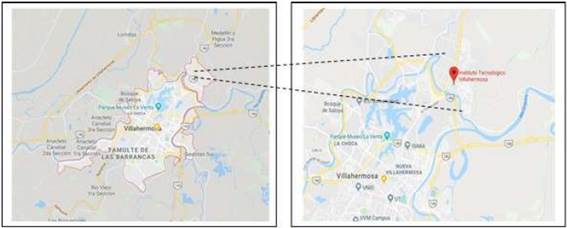
City of Villahermosa has three automated monitoring stations located in the Bullring, the Secretary of Education (SE) and the Technological Institute of Villahermosa (ITVH). Currently, only the ITVH station Fig. 1 is in operation. This station is located in Av. Mártires de Cananea, Colonia Indeco, Cd. Industrial. Its geographic coordinates are 18.02 N and 92.9 W.
2.2 | Data Collection
Data for this study were provided by the Secretary of Natural Resources and Environmental Protection (SER-NAPAM), and were collected in the ITVH station, corresponding to hourly values for PM 10, O 3, CO, SO 2 and NO 2 for the period between January 2011 and December 2017. Information was submitted to a validation in order to meet the data complexion requisite for the "Air quality data management protocol" [15] and official Mexican regulation.
2.3 | Indicator Analysis and Temporal Trend
From this validation we obtained the period from January 2014 to December 2017 for the pollutants PM 10 and O 3, and the period between January 2014 and December 2015 for CO. SO 2 and NO2 were excluded from this study since there was not enough information for a statistical analysis.
We determined the proportion of days per year with good, regular and bad air quality, from daily data for each pollutant. The computation was generated based on the indicator "air quality index" from the NADF-009-AIRE-2017 NORM.
We studied the temporal variation in two biannual periods (2014-2015 and 2016-2017) in order to analyze the behavior for concentrations before and after 2015, since this year presented an atypical event (construction of a bridge near the monitoring zone) which increased the concentrations. This analysis allowed the generation of pollutant evolution patterns with respect to hours, days and months with the higher concentration values. For the determination of the linear center trend (period from 2014 to 2017) we obtained the mean of the monthly slopes (also obtained through monthly means) for representation of the global trend slope. Information obtained results in determining if the critical months for each year identified in the temporal variation analysis lead to the same trend obtained through the Wilcoxon non-parametrical hypothesis test. The information was processed using the OpenAir package in the RStudio software version 3.4.3.
2.4 | Forecasting tool analysis
For the development predictive models several multiple linear regression models were tested. However, predictions were not always acceptable. At the same time, we trained artificial neural networks (ANN) that generated better results. For the ANNs we employed a multilayer perceptron with forward connections and a backpropagation training algorithm. The employed model was constituted by an input layer, a hidden layer and an output layer. Training was performed with hourly concentration patterns in 24 consecutive hours, for the three selected pollutants (PM 10, O 3 and CO) to predict the concentrations for 7 and 19 hours later. Training patterns were selected from available 2016 data for the pollutants PM 10 and O 3 and the available 2014 data for CO. For validation stage we used the corresponding successive year for each pollutant.
2.4.1 | Proposal for Web Portal
For the web portal proposal, we incorporated the full information (2011-2017) and programmed the tools for air quality and trend that were most relevant in the previous analysis.
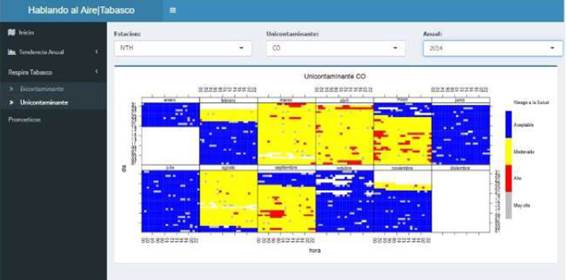
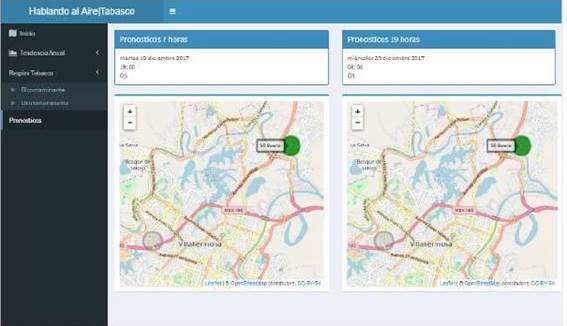
The portal is proposed under two main approaches: First, with the communication purposes; aimed to inform the society on the air quality that allows to take preventive measures on their exposure wen pollution levels are high. In this section we present the assessment through the stablished qualitative and quantitative indicators: Metropolitan index of air quality (IMECA) and Air quality and Health hazard index (RESPIRA) each hour, from the station location in an interactive map that presents the state's monitoring stations, color chart, number and qualitative category according to date and time of last update, as well as the pollutant conditioning said air quality. Additionally, we present short-term forecasts (7 and 17 hours) for air quality levels.
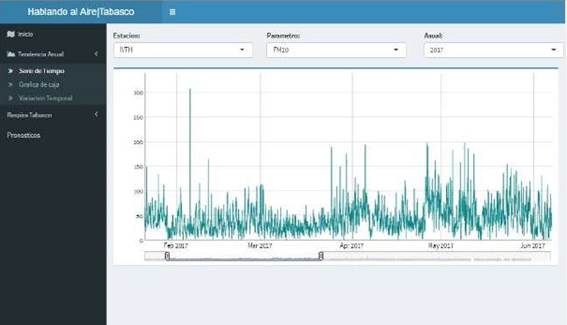
The second approach is aimed to the academic community and government authorities, this provides analytical elements for structuring environmental policies. In this section the platform has graphic information on criteria air pollutant trends: a) interactive time-series plots (annual or multiannual) that allow to perform approaches for shorter time spans of the selected pollutant; b) box plots to visualize symmetry, dispersion, data bias and to perform a preliminary diagnose identifying the months with extreme conditions; and c) time-variation plots that enable the analysis of the pollutant's temporal evolution and year of interest, and identifying the months, weekdays and hours of day in which the pollutant's higher concentrations are produced.
Additionally, we conducted an exhaustive review of the most relevant national and international websites on air quality and verify the diffusion tools that allowed to identify the communication elements and ergon-omy necessary for such approaches. For the development we employed open source R programming code. Additionally, we used the OpenAir package for the data analysis of air quality with functions that allow the interpretation of hourly, daily, monthly and annual time-series, and the Shiny package for creation of interactive web applications, as well as the leaflet and dygraphs functions for interactive plots.
3 | RESULTS AND DISCUSSION
3.0.1 | Distribution of days with good, regular and bad air quality.
We obtained the distribution of days per year of air quality based on PM 10, O 3 and CO. For PM 10 and O 3Fig. 2)-a we observe that the days with regular and bad air quality predominated in 2015 and 2016, particularly 2015, which registered 203 days with bad air quality, which can be attributed to the construction of the "La Pigua" bridge between 2014 and 2015, which is near the ITVH monitoring station.
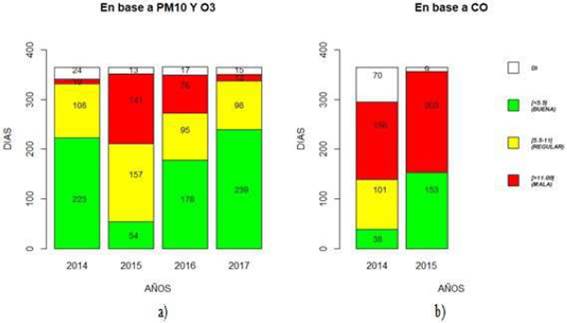
Based on CO Fig. 2-b 2014 presents 156 days with bad air quality. In order to identify the pollutant's permanence in the atmosphere we conducted the quantification analysis for days per year that surpass the Maximum Permissible Levels (MPL) stated in the Official Mexican Regulation (NOM) at least for one hour during the day and during 5 consecutive hours. The largest number of days with high hourly concentrations of CO was in 2015, where the high levels remained during several hours a day for 203 days of the year. Since the main CO emission of the vehicle fleet, is most likely that these results are due to vehicle traffic in the conurbed area of the ITVH station, which in said year presented 2800 vehicles per hour [16]. Based on this, and not considering the data for the following years, is indispensable the monitoring of tis area to determine if the levels have increased or decreased after the construction of the "La pigua" bridge that would allow a better traffic low.
3.1 | Time trend
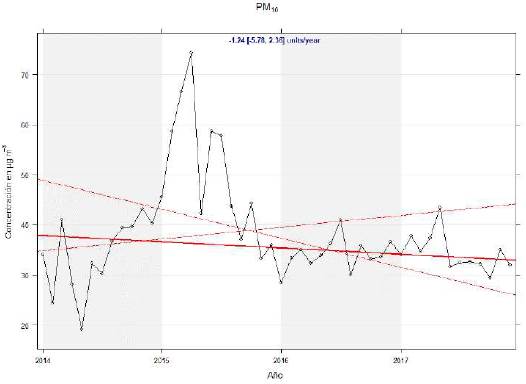
Fig. 3 shows a significant increment PM 10 levels in 2015, reaching the maximum levels for said period. The global trend is decreasing (-1.24 μg/ m 3 per year), falling approximately 5 μg/ m 3 during the 4 studied years. In spite of its decreasing trend, means are increasing for the critical months in the city Fig. 4. We conducted Wilcoxon hypothesis tests, where the results indicate evidence at 0.05 level that the months differ according to the years (p-value = 2.2e-16 < 0.05).
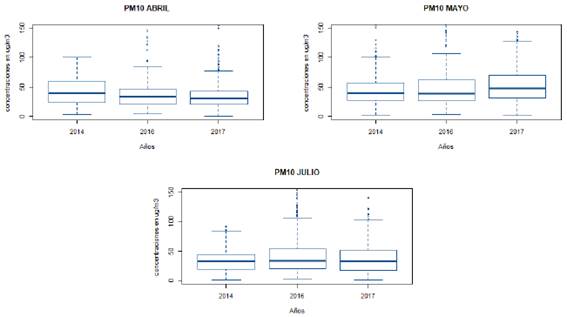
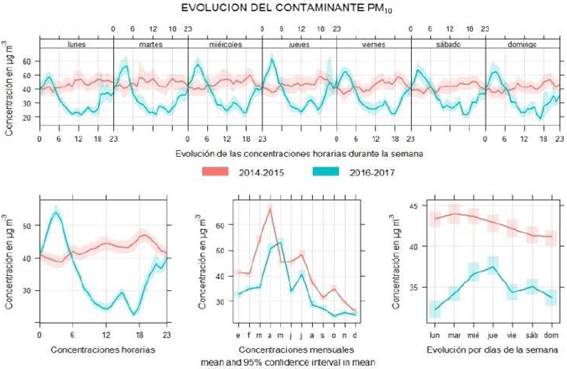
From the temporal variation analysis for PM 10Fig. 5 both biannual periods are different in their hourly and weekly behavior; however, monthly evolution is similar and is observed that March, April and May (critical months) present the highest concentrations for both periods, attributed to issues such as environmental conditions (drought season), as well as the uses and customs in the agricultural sector (slash and burn of crops and grasslands) that represent 11.5% of PM 10 emission generated in the center municipality [17]. In the second period, higher concentrations are present in the early hours of the day, which can be attributed to area's external sources. These results differ with the Mexican National Report for Air Quality in 2015, that registered for Villahermosa five days with bad air quality in 2015 for PM 10 [18].
For O 3, Fig. 6 shows that 2015 is the year with higher concentrations, decreasing from 2016 onward. It presented a increasing global trend (4.72 ppb equivalent to 0.00472 ppm per year) from 0.002 to 0.004 ppm during the entire period. The hypothesis test indicates that there are significant differences for the months according to the studied years at a significance level of 0.05 (p-value = 2e-16 <0.05).
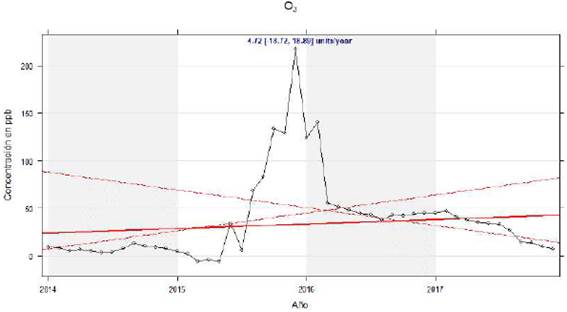
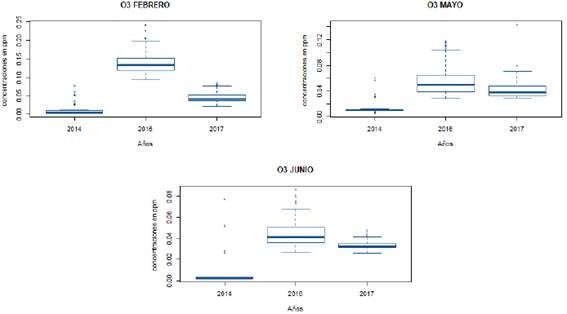
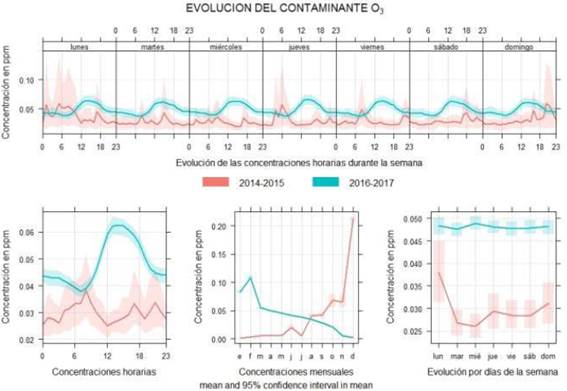
Fig. 8 shows the time behavior for O 3 in 2 biannual periods in which is evident that both are different in their hourly, daily and monthly patterns. The 2016-2017 period presents the higher concentrations for both periods. On the other hand, the hours presenting higher concentrations are between 12 to 18 hours, where higher solar radiation is present, favoring the increase on O 3 concentrations [10],[6]. High O 3 concentrations can cause health damage to local population.
3.2 | Website proposal for the Atmospheric monitoring network
The "Hablando al aire/Tabasco" proposal was incorporated to the "hablando al aire" (see the the following portal http://www.riaat.ujat.mx/hablandoalaire), which is an academic website oriented to the diffusion of the air quality problematics. Fig. 9 shows the home interface that automatically presents the IMECA indicator. On the left side of the website (dark frame) are links for consulting the RESPIRA indicator Fig. 10, graphic information Fig. 11 and forecasts Fig. 12.
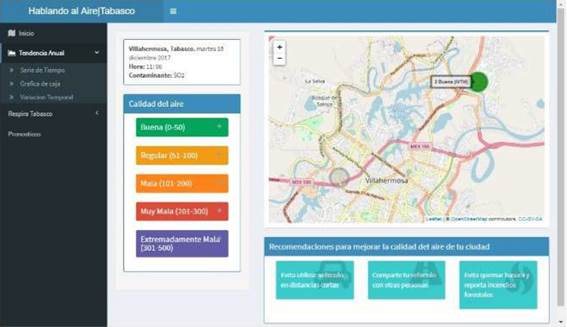
The lower part shows plots with general suggestions and recommendations to improve the air quality.
4 | CONCLUSIONS
According to the trends e can see that the construction of the "La Pigua" bridge increased the pollutant's concentration levels in the environment, putting the population in risk due to high pollution levels. However, it wasn't the only extraordinary event that deteriorated the air quality, as previously shown; in the last few years, in spite of the decreasing trend for the PM 10, the concentrations were greater than the one in previous years, as well as the trend for O 3.
These pollutants behavior shows that we are exposed every day to each of them, which is why is necessary to strengthen the continuous monitoring in our city, in order to develop policies and strategies that allow to mitigate the high levels of atmospheric pollution.

