


 English (pdf)
 Article in xml format
 Article references
 Send this article by e-mail
 Cited by SciELO
  Cited by Google
  Similars in
SciELO
Similars in
SciELO  Similars in Google
 Permalink
1 | INTRODUCTION
Sound has evolved in so many ways during the last few decades. It is immersed in the devices for interpersonal communication, such as mobiles, PCs, internet-streaming, and lately with the advent of AR and VR, it has overflown oursenses. Nevertheless, its principles rely on the science known as Acoustics, which deals with the propagation phenomenon and all the particular fields which are entangled to room acoustics, psychoacoustics and noise control. In this matter, governments and institutions all around the world stake for solutions and arrangements between the Academy, firms and the authorities in order to promote better quality standards from the point of acoustic comfort.
In this sense, not only Normative and Legislation is analyzed, but reconfigured and reconstructed according to the needs of the particular city. This is based on the premise that each urban area is a living individual (Pulido Barrera, Rosales Carreón, & de Boer, 2018). On the other hand, acousticians deal with the laboratory experientation of ne aterials for acoustic insulation and/or conditioning. These activities push further the advances in the field towards interdisciplinary communication with architects, ecological entrepreneurs, environmentalists, but as well social and political sides which are in charge of legal changes.
Digital communication, artificial intelligence and data Science has potentiated the research in Acoustics, enabling its massive communication and therefore its democratic interpretation by the institutions which are in charge. This is the reason why Noise and Acoustics belong inherently now to the concept of a Smart-city. The use of Human Machine Interfaces (HMI) with robust audio-processing features enables better interconnection between people. Likewise, new technologies enable better project administration and management skills, as well as the possibility of public participation in urban development. Thanks to technology, new ways of participating methods are becoming available. The presentation of these solutions may be presented to the general community via augmented/virtual reality.
With all these realities that the world after 2000 has brought, new paradigms for the Acoustic field have emerged. On one hand, it is of extreme importance to remember the settlements given by the United Nations in 1992, where poverty, hunger and education were announced as priorities, among 17 priorities. Sustainable Development is one key-issue of all this trend, relating to recycling, reuse and reducing pollution, understanding pollution as acoustic pollution as well. In one definition, everything which relates to the proper and adequate use of resources is involved in this matter.
Georeferentiation of noise municipalities is one strategy adopted for enabling the government and the public in general to evaluate the degree of pollution inherited by this issue. As it is mentioned in (Hermida Cadena, Herrera Fernández, Remolina, & Ospina, 2020), Sustainable Acoustics is a concept where the generation, propagation and sound transmission is done in a sustainable manner, which implies a friendly and efficient relationship with the sound emission, but as well, materials and elements used in different fields of Acoustics, but as well a concept that implies a change in acoustic management towards the human being, searching for the improvement of the acoustic environments for the improvement of the quality of life (not only human life but all species). In this sense, the evaluation of sound quality of some urban acoustic environments under the constraints of adjusting design processes and environmental management considering the human being as the center in that process is of key value nowadays. On the other hand, the use of recycled fibers (such as sugarcane fibres (Páez Soto, Herrera Fernández, & Herrera Martínez, 2020), coffee (Cubillos Villamil, 2019), newspaper disposal (Herrera Martínez & Reyes, 2015), guadua (Páez Soto, Herrera Fernández, Acosta Agudelo, García Bustos, & Herrera Martínez, 2018)) as input for the development of sustainable acoustic materials. Future work shall be done in order to apply elements from AI and DataScience to Acoustic Sustainability.
1.1 | Smart cities and Noise mapping
(Asensio, 2017) documents the possibilities of applying Smart cities methodology into the Noise topic. (Asdrubali & D'Alessandro, 2018) expose 3 different examples for noise management in Smart cities, such as noise dynamic mapping, the use of mobile devices (Smartphones) for gathering sound pressure levels or capture, edition of soundscapes inside the urban territory. Aumond et al. in 2017 also evaluates the effectiveness of mobile technology for the measurement of noise and the generation of noise maps. Likewise, an advanced low-cost sensor network with the aim of performing acoustic measurements in strategic points in New York City were developed in 2017 (Mydlarz, Salamon, & Bello, 2017). Wessel & Basten in 2016 also treat this problem of wireless acoustic sensors for noise monitoring, classifying 4 categories for the acoustic wireless sensors for noise monitoring; this classification according to HW, cost, scalability, flexibility, precision and accuracy (Wessels & Basten, 2016). S. Marouf, et al in 2018 reported the development of low energetic consumption and wireless operation for noise data gathering and collection (Marouf, Bell, Goodman, Namdeo, & Neasham, 2018). Agha, Ranjan and Gan in 2017 expose the use of a system to detect vehicles which overpass noise levels in the zone where they transit (Agha, Ranjan, & Gan, 2017). Finally, Information and Communication Technologies are becoming a robust tool for the improvement of life-quality of the population in the cities either in transportation, education, sustainability, participation, planning and as well noise management.
Another quality of noise mapping is that they indicate the variation of the spatial distribution of the sound pressure level over time. Additionally, noise maps allow the presentation of acoustic data in a given specific area, depending on a noise indicator, where a limit value is exceeded, the number of people affected in that area, the number of dwellings exposed to different noise indicator values for the area (Berglund et al., 1999).
1.2 | Noise maps
Noise maps represent an acoustic situation for a given area using different colors or grayscales to represent the variation of sound pressure levels in a grid from 3dB to 5dB, depending on usage. These noise maps are used to know the noise profile of a given geographic point where sound pressure levels are indicated by contours, as indicated by the topographical contours in traditional maps. The objective of using noise maps s mainly for urban planning issues, as they allow to define areas suitable for different uses and constructions, depending on the ambient noise levels measured. Among some typical noise maps objectives are: to estimate the noise exposure of the inhabitants of a specific area, to compare the levels measured in the area with the levels specified by the regulations for that type of study area and to determine the need to apply or extend noise control measures (Javier-Correa et al., 2011). In Fig. 1 can be seen an example of a noise map for an urban area, in this case the city of Medellin.
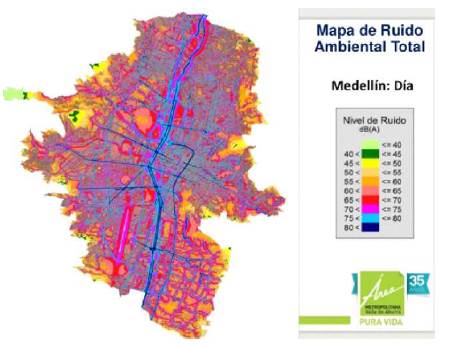
FIG. 1 Noise map of Medellin City, Colombia where noise levels are seen distributed by colored areas (Área Metropolitana del Valle de Aburrá, 2018).
1.3 | GIS - Geographic Information Systems
GIS are defined as systems that might store data of special character for ulterior consultation, manipulation and/or representation. It conveys information in digital format and informatic tools which information is geo-referenced, it means, that it includes a position in on earth. It has high relevance because it integrates conveniently this information so that governments and authorities may take decisions of relevant character (Olaya, 2014).
Generally, a GIS is constituted by:
Database (for real-time coding through specific data).
Thematic Databases which assign to each point a specific thematic value.
Specialized software in the management of these databases.
Set of computational hardware and input/output peripheral systems on the physical layer for the server.
User community for the stored information.
System administrator which enables us to solve problems or requirements of the users.
In terms of information a Geographic Information Systems is a set of geographic layers nowadays in digital format which represent diverse variables or data, that works in an entangled manner. One geographical zone has many layers, so spatial and thematic information may be combined in one system (Instituto nacional de estadística y geografía, 2014). Empowering the citizens with the tools from Information and Communication Technology enables their active participation, encouraging different given alternatives, so to facilitate: governance, urban planning, public administration, environment, international projection, technology, mobility and transportation, human capital and economy and social cohesion.
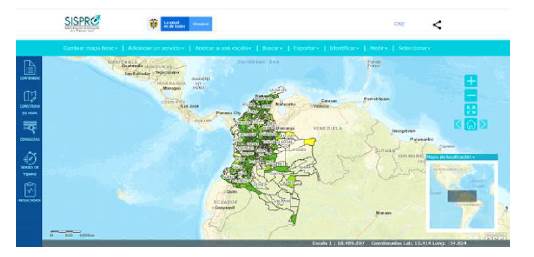
The central tool of a GIS or applications created through the use of GIS are geographic viewers, which allow you to visualize the information stored in spatial databases to understand the main environmental aspects of a region. There are many tools needed for navigating, reading, and manipulating information within a geographic viewer, such as zooming or zooming, panning, and navigation arrows, which allow you to scroll within the viewer for more detailed information. There is also the search tool, which allows you to find the required information more easily. Also, there are the compass and coordinate tools, which as indicated by their name help the orientation of the user within the geographic viewer. Many geographic viewers today, as can be seen un Fig. 2, use a vector base map as a reference background, because the different layers of information are projected on this map depending on usage (Franco, 2016).
2 | METHODOLOGY
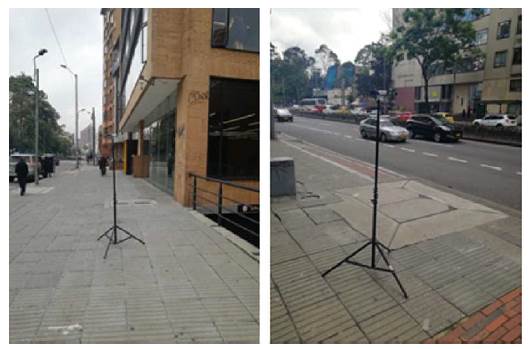
Environmental noise measurements were made in the vicinity of the University Francisco Jose de Caldas (UD-FJC) Noise descriptors such as the equivalent continuous sound level (LeqA) were obtained. In addition, land use was consulted according to characteristics of the analysis area. The environmental noise measurements were obtained thanks to the students who took the subject Environmental Acoustics in the 2019-I semester, which had as their final project the measurement of environmental noise within this university spaces and their surroundings. Measurement campaigns used as a reference resolution 0627 of 2006 (Ministerio de Ambiente, Vivienda y Desarrollo Territorial, 2006) during daytime, prior to this, a study was made in the area, which allowed to know the current situation of the measurement points in all aspects: mobility, security and buildings. Following this, the measuring instrument was a sonometer type 1 with frequency and temporal weighting parameters set. Once the measuring instrument was configured, the calibration of the measuring instrument was carried out using a pistonphone that emitted a signal of 1KHz at a level of 94dBSPL. Finally, before starting the measurement process, it was verified that the climatic conditions were favorable, i.e. that there was no rain, drizzle, thunder or hail fall, nor that the asphalt was in wet conditions. For data collection, seven measurement were taken each one in lapses of 15 minutes for each point. The passage of traffic was video recorded, so that, after its review in detail an estimate of the total vehicles discriminating between light and heavy vehicles was made as indicated in ISO 1996-2.
2.1 | Location of measurement points
Measurements points were determined based on the interest zones. Criteria for this selection was: 250 meters distance among points following Environmental Noise Colombian Normative. Intersection on main roads with high vehicular density, guaranteeing a 2 meters distance from walls (reflecting areas). The measurement mesh at the UDFJC comprehends from calle 40b until calle 44 in between 7th and 13th carrera, distributing this zone among 7 measurement points. Also, a consultation to IDECA (Infraestructura de Datos Espaciales para el Distrito Capital) was performed, in order to gather the information of the sound pressure level allowed in the zone according to the use of the ground as can be seen in Fig. 3.
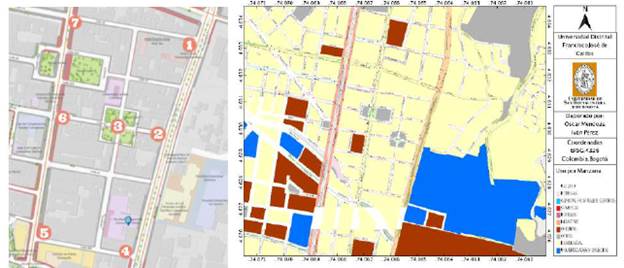
Observing the information given by the IDECA for this zone, it may be observed that the use of the ground is mainly of residential use, therefore the equivalent continuous sound pressure level is 65 dBA. On the other hand, there are blocks whose land use is classified as others, thus in these spaces the maximum permissible level is 80 dB(A) in the day and 70 dB(A) at night. Finally, it is shown that some blocks are listed with use by universities, so in these places the maximum levels allowed are 65 dB(A) in the day and 50 dB(A) at night.
3 | RESULTS
The first measurement point is located in between calle 44th with carrera 7th, is in between two streets very concurred by particular vehicles and heavy traffic, besides there is a concurred gym and residential buildings.
Point two is located at the calle 42 with 7th avenue, where there is a high vehicular flux of light and heavy weight due to the high bus flux. Also, there is a high number of stores and stationeries because it is a student zone that is composed of two universities which also generate a high traffic of people. Point 3 is located on street 42 with carrera 8, where there is a park where people exercise and leisure activities. This zone is very concurred due to a huge variety of restaurants and bars for university students. In Fig. 4, some measurement points may be observed.
The fourth point is in carrera 7th with calle 40b close to the Pontificia Universidad Javeriana, here a high vehicular road traffic at the 7th avenue was achieved. The fifth point is located at the 40b with carrera 13th where the Teusaquillo police station may be found, a variety of banks, travel agencies indicating that it is a commercial zone. Point sixth is at the calle 42 with carrera 13th, here there are various drugstores, various offices and some restaurants. Likewise, there is high vehicular flux mainly buses, particular vehicles and taxis. The seventh point is located in the street 44 and carrera 13, this is a commercial zone but mainly residential buildings.
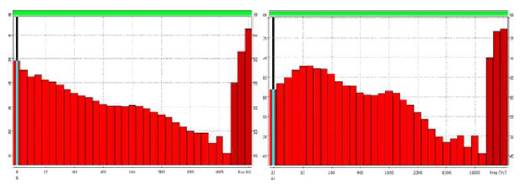
This study uses engineering tools for the environmental noise measurement at UDFJC, with the aim to input these data into a digital platform for the visualization of noise values in a particular zone in Bogotá. This process enables the evaluation of actual noise levels with LeqA. Noise simulation with CadnaA software was also performed in order to compare obtained simulated data with the real measured values. In the Fig. 5, average noise spectra for each octave frequency band for some measurement points can be seen.
3.1 | Simulation of environmental noise
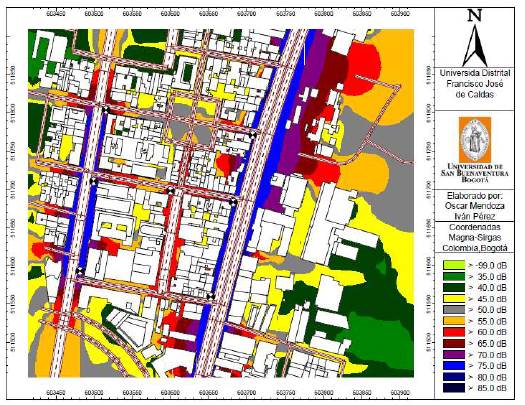
For the generation of the Noise Map, the software CadnaA was used. Geographic information was gathered in the measurement zone by means of reference maps taken from IDECA. It was necessary to have the construction layers of pathways and relevant information, number of floors of each building, the height of the floor (for the calculation of the length of each building), the size and the asphalt type of the paths, vehicular flux, speed limit and vegetation zones. The statistical French noise traffic model used for computation was NMPB Routes 96. With all these data, the noise map in Fig. 6 was obtained.
A comparison between measurements and simulation are presented in Table 1.
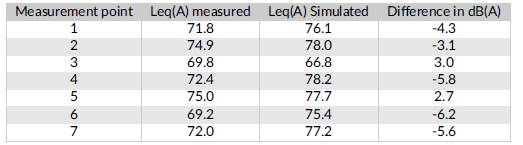
The measured zone comprehends from calle 40b until carrera 44, between 7th and 13th avenues. Taking into account the information given by the IDECA, it can be observed that this zone is residential. Therefore, the maximum allowable sound pressure level is 65 dB(A), according to Colombian environmental noise normative. For the measurement point No. 1 (at the corner between 44th and the 7th avenue), a high vehicular density is held, even with heavy traffic. Here, the measurement in this point is 71.8 dB (A), in comparison to the simulated sound pressure level which is 76.1 dB (A), giving a difference of 4,3 dB (A). The locality is a mixture of residential zone, and a physical training place (gym), situated in front of the Universidad Javeriana.
The second point of measurement is located southern on the 7th avenue. It is a more commercial zone, with high passerby flux and vehicular jams, due to the population of the University. The sound pressure level measured at this zone is 74.9 dB(A), the simulated value is 78.0 dB(A), giving a difference of 4.9 dB(A). The third measurement point located at street 42 below the 7th avenue indicated a measured sound pressure level of 69.8 dB (A) with a simulated sound pressure level of 66.8 dB(A) giving a difference of 3 dB(A). In this zone there is a park dedicated to relaxation. Here there are fewer commercial localities oriented to food services, and the vehicular flux is also diminished compared to other locations. The fourth measurement point is located at the calle 40b on the 7th avenue, giving a measured sound pressure level of 72.4 dB(A) and a simulated sound pressure level of 78.2 dB(A), indicating a difference of 5.8 dB(A). Calle 40b is narrow with only one-direction with no continuous traffic flow, which may explain its low sound pressure level measurement.
The fifth point is located in the corner of street 40b with carrera13, giving a measured sound pressure level of 75 dB(A), with a simulated sound pressure level of 77.7 dB(A), giving a 2.7 dB (A) diference. This point registers the highest value of sound pressure level due to the fact that it is located at Carrera 13, which is a high concentration car avenue. Also, this is a high commercial zone made up of banks, trade shops and police stations. Sixth point is located at Carrera 13 with street 42, the sound pressure level measured is 69.2 dB(A) and the simulated is 75.4 dB (A). This sound pressure level decrease is due to the commercial zone with drugstores and related shops. Finally, for the last measurement point located at Carrera 13 with street 44, the measured sound pressure is 72 dB(A) with a simulated 77.2 dB(A) sound pressure level giving a difference of 5.2 dB(A). This is a commercial zone with laundries and shops. However, street 44 is more residential and quieter.
3.2 Design of the digital platform based on free software
An implementation of a geographic information system gathers all the tools, integrating and relating all of its components, such as users, hardware, software and processes for integration, storage, edition, analysis, sharing and information visualization of the referenced data. This process consists on several phases:
3.2.1 Determination of coordinate system and GIS format conversion
MAGNA-SIRGAS Marco Geocéntrico Nacional de referencia-Sistema de Referencia Geocéntrico para las Américas) is the standard given by the Agustin Codazzi Institute (IGAC), a governmental entity in charge for the Colombian geodesic national systems. This standard guarantees the compatibility of Colombian coordinates with the spatial positioning techniques, as the GNSS (Global Navigation Satellite Systems), and with international sets of georeferenced data. On the other hand, the WGS84 standard, used in geodesy, cartography and navigation is worked at a global level and enables to localize any point on earth without making use of any other reference point, estimating a calculus error less than 2cm, therefore it is used in GPS. In this project, it became necessary to re-project to the UTM Universal Transverse Mercator coordinate system of the north hemisphere, applicable to Colombia, specifically to Bogotá. After this last re-projection, a change in the file format is made, so that the visualization software may be compatible with these files. Ergo, conversion to KML format is performed.
3.2.2 | Implementation of the web server
After having the correct file format, we proceed to the following stage which consists of the design and implementation of the web visor. For this, the XAMPP application is used, a free software packet which handles MySQL databases, Apache server and PHP script interpreters and Perl. The Apache server is a HTTP (HyperText Transfer Protocol) server of free access code, multi-platform, which can be used with any operating system. Once activated the Apache web server from the XAMPP app, the software gives the option of managing it or configuring it.
3.2.3 | Design and implementation of the Web visor
CesiumJS software was used for the design of the web platform, it is a free access from JavaScript for designing and creating globes and maps in 3D searching for the best performance, precision and visual quality. CesiumJS counts with an integrated option called Sandcastle that has multiple examples for visualization and edition. After configuring the basic performance of the different work modules that integrate all this geographic information system, then the digital platform is developed. Once having the noise maps in the proper file format (.KML/.KMZ), relocation of these files was done, which consists of locating properly these files into a folder address which correspond to it.
3.3 | Noise conflict zone
For the UDFJC it was found that 6 of the 7 measuring points are in Residential-type areas and that only the third point is listed as Others (see Fig. 3). Using Google Street View tool, it can be shown that point 3 that is initially located in a listed area (according to IDECA) of land use as Other, refers to a public park, so it fits into the land-use category of Parks in urban areas, so the maximum permissible level at this point is 65 dB(A). With this clarification, it is noted that all measurement points are exceeded the levels allowed by the national resolution, resulting in this being one of the most conflicting study areas for noise.
In Table 2 can be seen the relationship between the maximum level allowed with the level obtained at each of the critical points according to the land use within this study area.
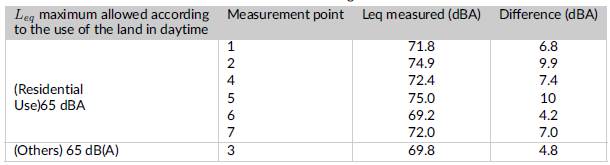
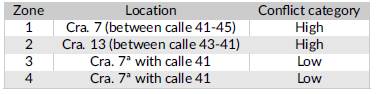
After finding these conflict zones through measurement procedure, the conflict map is depicted based on noise simulations. Fig. 7 shows that throughout the seventh race there is a high conflict, reaching even the limit of 20 dB(A) above the allowed level at various points along this route, this conflict is because the land use according to the area is residential which gives it a maximum permissible level of 65 dB(A), but due to the flow of vehicles of all kinds through this road, which is of a main character for the mobility of the city, this level is overstepped.
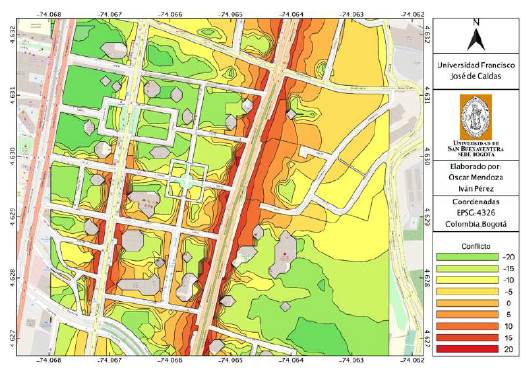
In another instance there is a similar situation in race thirteen from 43rd Calle to 41st Calle since this road also presents an excessive and constant flow of vehicles at any time of the day. This particular situation in this study area can be understandable because this part of the city tends to be very congested at any time of the day, in addition to the planning of tracks can be considered inadequate, since all kinds of vehicles often run through these races without restriction, in addition to the lanes not very extensive, generating bottlenecks that can produce the excessive levels evidenced. Table 3 shows the conflict zones found for this location.
3.4 | Evaluation of the noise impact on the population
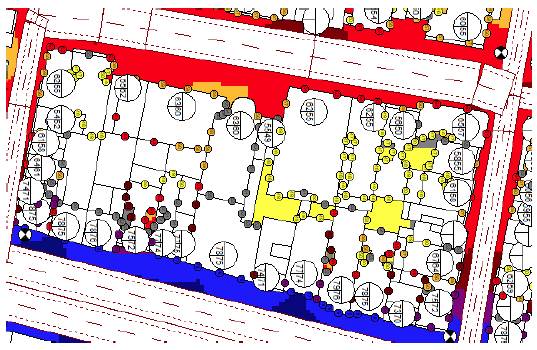
In this section, an assessment was carried out on the number of people affected by noise, as this allows to demonstrate, in general the state of sound levels, compared to the percentage or number of people exposed to the maximum permissible levels of sound quality according to national regulations. For this the necessary information was sought, but the only thing that was possible to find was the number of inhabitants by UPZ, which is too large an area for the study sectors. Obtaining data from a population in a given area is not an easy task as it is not easy to obtain the necessary official data. This is how there are various methods to estimate them among them those that make use of symptomatic variables. However, sometimes the use of symptomatic variables is not possible since they are not taken out to estimate populations, they are obtained with the intention of collecting information, this causes there are problems when obtaining them. Since it was not publicly available any of these variables for minor areas, nor the layer of official information by any government entity that throws the population data per block was not possible to perform the calculation by this method, taking into account the above it was necessary to perform the calculation of residents by building with the help of the CadnaA simulation software which performs a calculation of residents by building based on the areas of each of the buildings. A limitation of this approach is than only residential population is considered. For this purpose, each building is evaluated as it is shown in Fig. 8.
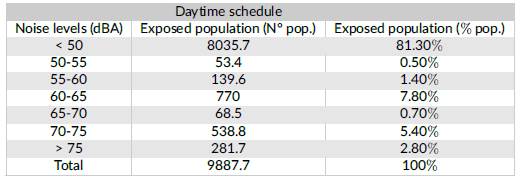
With XL-Scan tool in CadnaA, the object is selected (Building) and the results are shown in Table 4. For the UDFJC there is an approximate population of 10,000 people, which 800 are exposed to values between 60 dBAand 65 dBAthe maximum allowed threshold for this zone. A smaller percentage is exposed to levels above 65 dBA, indicating that almost 10% of the population is exposed to noise levels that may affect the quality of life and their performance in daily routines. On the other, more than 80% of the population is exposed to levels which are less than the maximum allowed, that is among 50 dBA and 60 dBA, indicating that a large part of the population is not affected by excessive noise levels at this location.
4 | GEOGRAPHIC VIEWER FOR NOISE MAPPING
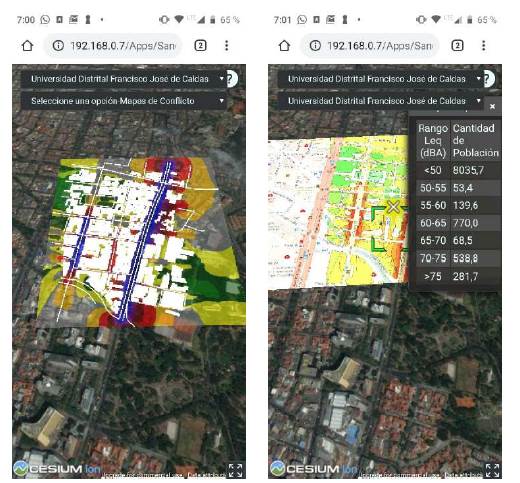
With the data obtained in measurements and simulations, in addition to the information obtained in the previous subsections, the design of a web platform that allows to observe the noise maps was made in CesiumJS. This, in order to make noise data easily accessible to the community and obtain an approximation to the SmartCity concepts. In Fig. 9 is shown noise maps and con_ict maps accessed from a mobile device in a local network.
5 | CONCLUSION
After comparing the simulations with the results obtained in the measurements, it was determined that the vast majority of nearby data is obtained. Differences can be associated with the following aspects. First, the presence of sources other than road traffic such as horn, passer-by noise and aircraft passing which cannot be modeled by the French method NMPBRoutes-96. Secondly, because road traffic was considered as the main source of noise in the modeling, it should be noted that statistical calculation models often differ from measurements when there is no continuous flow of vehicle situation that arises, for instance, in some streets closer to UDFJC as calle 40b and 41.
During the development of the study, noise impact assessment on the population was carried out. This procedure was developed through the calculation of people who are exposed to certain kinds of noise in the facade of buildings, as is done in the strategic maps of other cities consulted in the literature, where this procedure was followed. Then, by 5dB classes using CadnaA software, the table of people exposed to each noise class was obtained. Because it was not possible to have official information of the district of Bogotá with the number of people per building, an approximation was made where the population of each property was established based on the physical dimensions of the building, where the variables of density of population area and height of floors were considered. Nevertheless, for future work, it is recommended to count with official data of the population in order to have more confidence about the affected population and the conflict zones.
In this work, a platform was created for the visualization of information layers related to ambient noise, noise conflict maps and impact on the population. As its main advantage it can be noted that by using free software tools the information was viewed in such a way that a user can interact in a similar way to other geographic viewers. However, limited storage capacity was encountered as the main difficulty, as sometimes when raster information layers exceeded 10 MB the platform response was slow. Finally, when developing the web platform, a new tool is created, with the aim of knowing the noise levels that are presented at the Distrital University Francisco José de Caldas. Also, the need of a public IP is suggested, in order to load the platform to the Internet. Noise measurements may be accompanied by audio recordings in order to analyze the presence of sound events that may be different to road traffic noise.
Last but not least, a noise prediction model adjusted to the national context is suitable, where the local aspects may be considered, such as national traffic condition, type of asphalt, traffic jams, in order to have a close proximity to local policies.

