


 English (pdf)
 Article in xml format
 Article references
 Send this article by e-mail
 Cited by SciELO
  Cited by Google
  Similars in
SciELO
Similars in
SciELO  Similars in Google
 Permalink
I. INTRODUCTION
Usually the development of monitoring tasks of vegetation and crops are done manually, using low qualification human resources. One or some workers with specialized equipment go over the region of interest, collecting information plant by plant like biomass, water stress level, height, number of leaves, among others. This manual monitoring system is inefficient due to a large amount of time, equipment, and human resources needed [1].
Remote sensing systems allow capturing these features of interest without direct contact with the plants, providing a fast, efficient, and nondestructive way to develop this task [2]. It is possible because a hyperspectral sensor can capture the level of reflectance emitted by an object in different spectral wavelengths. The level of reflectance depends on the molecular composition and texture of the object [2].
Recent advances in remote sensing through hyperspectral images or spectroscopy have shown their importance to several applications related to vegetation and crop monitoring [3]. Right now, it possibly makes diagnostics and discriminates between different kinds of crops through remote sensing systems. In fact, the use of hyperspectral imagery allows making a deeper analysis with better results than an analysis made with multispectral data [4].
The relationship between biochemical and biophysical features of vegetation or crops with the level of reflectance for different wavelengths registered by a hyperspectral sensor is named “vegetation spectral indices.” The vegetation spectral indices were proposed to quantify biochemical and biophysical features of crops, through the relationship between the spectral information and the feature of interest [1].Some researchers have shown applications related to remote sensing of vegetation and crops using hyperspectral images.
This includes: water stress level detection [5-7], measurement of chlorophyll content [8], variance detection of green percentage of the crops [2,9], extraction of biochemical variables like nitrogen and lignin [10,11], crop types discrimination [9], detection of moisture levels [6], variation on pigmentations leaves [2-12], improvement in vegetation changes detection [2], among others.
In this paper, it is presented the design and development of a software tool that allows generating some vegetation spectral indices from hyperspectral images taken by the Airborne Visible-Infrared Imaging Spectrometer sensor (AVIRIS) designed by NASA. The software application developed is oriented to spectral indices implementation and generation. This kind of information can be further analyzed to provide insights into water level, water stress affectation area, biomass level and crop classification.
II. VEGETATION SPECTRAL INDICES
The vegetation spectral indices are features that represent directly or indirectly the biochemical and biophysics vegetation or crops characteristics. Some researches around the world have demonstrated the efficiency and potential of generating vegetation indices for the estimation of useful variables for agricultural activities. These indices are obtained through information provided by spectral sensors. Some spectral bands are merge thought algebraic manipulations, which relates the reflectance of the scene with a phenomenon of interest [3].
The accuracy of the estimation depends on the bandwidth of the sensor used. When the sensor has not enough spectral accuracy, the resulting values could be inexact and affect the stability of the prediction process [3].
Narrowband hyperspectral sensors allow overcoming these limitations due to its high spectral resolution. A narrow band hyperspectral sensor has a bandwidth less of 10 nm and could take information over hundreds of wavelengths, usually in a range of 400 nm to 2500 [3].
One of the most important challenges in the generation of vegetation spectral indices is how to select and merge a group of spectral bands, which can be related to a phenomenon of interest. Not all spectral bands have relevant information for spectral index generation. Then, four types of structures are used to create spectral indices. The performance of each spectral index structure is evaluated through the R2 correlation between the spectral index and the phenomenon of interest. These four indices structures are discussed in the following paragraphs [1].
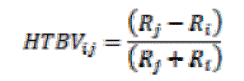
A. Hyperspectral Two Bands Vegetation Index
A hyperspectral two bands vegetation index (HTBVI) is generated from bands i and j as shown in Ec. 1[1].
 .Ec. 1
Where i,j=( 1 … N ), R is the reflectance of the bands and N is the total number of bands. A hyperspectral sensor with the ability to capture information in 220 spectral bands (N) provides sufficient information to generate (NxN-N)/2=24.090 spectral two bands vegetation indices (HTBVI). However, just a few indices will contain relevant information. The rest may contain redundant or irrelevant information [10].
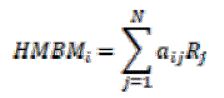
B. Hyperspectral Multi-Band Models
The hyperspectral multi-band models (HMBMs) are calculated as described in Ec. 2[1].
 .Ec. 2
Where HMBM is the vegetation index i, R is the band reflectance j=( 1 … N ), and aij is a weight coefficient for band reflectance j.
This process involves the implementation of a statistical regression model with any biophysical or biochemical variable as the dependent variable and some other hyperspectral bands as independent variables.
The process begins finding a spectral band Rj which generates the best coefficient R2. Later it adds to the model a new spectral band that increases the value of R2. The comparison is repeated until the addition of new bands does not modify in a negative way the value of R2.
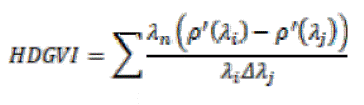
C. Hyperspectral Derivative Greenness Vegetation Indices
When a vegetation index is generated using two spectral bands very close to each other in the green region (514-556 nm), a slope is generated on the reflectance levels, indicating a gradient of the green levels. This behavior could represent a variation of chlorophyll levels, kind of crops, growing level, or healthy. Hyperspectral Derivative Greenness Vegetation Indices HDGVI is given in Ec. 3[1].
 .Ec. 3
Where i and j are the numbers of the spectral band, λ is the center of wavelength and ρ' is the derivative reflectance, obtained from the division between the difference of the reflectance levels of the bands, and the distance between both.
D. Hyperspectral Hybrid Vegetation Index
These models use combinations from previous described models for the generation of hyperspectral vegetation index. Some examples of these indices are presented in [1].
III. VEGETATION AND CROPS REMOTE SENSING BY HYPERSPECTRAL IMAGES AND SPECTRAL INDICES
Agricultural crops are significantly better characterized, modeled, and classified when the hyperspectral images are used [1,4,14,15]. Many researches have shown the veracity of this affirmation for a wide number of biophysical and biochemical variables [6,13].
The hyperspectral remote sensing has been widely studied in the early detection of nitrogen levels as an important characteristic of productivity and the future quality of crops [11]. The early knowledge of nitrogen level in growth crop season is essential for effective harvest. The nitrogen in leaves is an essential element to estimate the growth status of the crop, fertilization levels, and it can be used as a productivity index. The low nitrogen content can be evaluated using the ratio of the spectral band reflectance R743 and R1316 [11].
In [1] is presented a research on crops like cotton (Gossypium), potatoes (Solanum erianthum), soy (Glycine max), corn (Zea mays), sunflowers (Helianthus spp.), barley (Hordeum vulgare L.), wheat (Triticum aestivum L. or Triticum durum Desf.), lentil (Lens esculenta (Moench)), cumin (Cuminum cyminum L.), chickpea (Cicer arietinum L.), and pea (Vicia narbonensis L.). This investigation studied and found parameters like LAI (leaf area index m2/m2), WBM (wet biomass kg/m2), PLNTHT (plant height mts), CP (crude protein percentage), N (nitrogen percentage) y CC (ground area covered by the canopy), they are used to estimate the status, quality and crop profitability. From spectral measurements, the authors were able to identify twelve spectral bands ideal to crops remote sensing in the range of 400 to1050 nm.
In [14,16] is modeled variables like weight, basal area and biomass for forest regions. The normalized vegetation difference index (NVDI) is used like a feature that takes values depending on the plant structure, composition (nitrogen, lignin, chlorophyll) and quantitative characteristics like biomass per area unit, plant height, among others. In [12] is presented an analysis based on the optical properties of big size plants, where is presented a relation between the spectral features and water stress levels and chlorophyll concentration. This paper allows watching that the level of light reflected by the plant leaves, which is showed in its color, is a good indicator of water stress. Similarly, in [6] and [13] is shown using spectral indices and thermal information that is possible to determinate physiological conditions linked to water levels at olive trees.
In [2] is presented some spectral indices which are used as an effective tool for nondestructive phenotyping of morphologies in wheat crops at arid lands. In [8] is made the estimation of chlorophyll level using thermal and hyperspectral images taken by an unmanned autonomous vehicle. The authors make use of thermal and spectral information, which in addition to machine learning algorithms, provide a powerful tool to develop a strong estimation of the chlorophyll concentration level.
Proposals, like previously mentioned, demonstrates the potential of the remote sensing methods from hyperspectral images in applications of monitoring of vegetation and crops. However, it is important that each development will be formulated thinking in the particular features of the zone and the crop of interest. The relation between vegetation features and spectral index can change considerably through different kinds of vegetation, species, weather and topographical conditions [12].
In Table 1 is shown a summary of the spectral bands used by some studies for the generation of several spectral indexes.

There are a lot of challenges in the development of a remote sensing system based on hyperspectral images [1]. Any system based on spectral indices involves to determinate according to the application, the number of bands, the kind of index or the algebraic manipulation used to adjust the spectral data with the feature of interest. However, as the previous work, it is necessary to develop suitable calibration proceedings that allow getting reflectance values in accordance with atmospheric and topographic features of the scene [1].
The set of values stored in a hyperspectral image is known as digital numbers (DN). These digital numbers do not directly represent any biophysical or biochemical variable, even though it is not appropriate to obtain any spectral index using those digital values. The spectral indices are developed to work with spectral reflectance values of the surface of the earth [2]. So, it is necessary to turn the DN values into reflectance values. This process is done in two stages as follows [17]:
DN to radiance conversion. Captured data are digitized and adjusted to a binary value scale (1bit, 2bits, 4bits, 8bits, 16bits o 32bits) selected by the sensor manufacturer. The process of digitizing the radiance readings and adjust them to a binary scale is known as Digital Numbers. The inverse of this process is called radiometric calibration.
Radiance to apparent reflectance conversion that is the reflectance calculus at the sensor.
If the atmospheric effects are removed, it is possible to convert the reflectance in the sensor into reflectance on the surface. In this case, it will have been done a full atmospheric correction process.
IV. SOFTWARE TOOL FOR VEGETATION INDICES GENERATION THROUGH HYPERSPECTRAL IMAGES
In the development of the software tool for vegetation indices generation, the RUP software development methodology was followed [18]. Using this methodology, the functional and non-functional requirements, the conceptual diagram, the real use cases, the sequence diagrams, the flowcharts and integration tests were documented. The next sections describe part of this documentation due to space reasons.
A. Software Functional Requirements
The software tool presented in this paper was developed considering the following functional requirements:
Selecting and loading hyperspectral data.
Allowing users to select specific hyperspectral data set.
Determining the format and loading the selected data in memory.
Plotting representative RBG image of the selected hyperspectral data.
Sending messages from events generated by the process.
Performing calculation of known spectral indexes
Allowing users to select the spectral index to be calculated.
Extracting the spectral bands required for the calculation of the selected spectral index.
Calculating and plotting the result obtained from the selected spectral index.
Allowing users to save the results obtained from the calculation of the spectral index.
Sending messages of events generated by the process.
Programming spectral index defined by the users
Verifying the existence in memory of a data set previously selected.
Allowing users to enter an expression to program a new spectral index.
Providing a user interface to write the equations and calculate the new spectral index.
Plotting the new spectral index result.
Allowing users to select the limits of the graphic.
Allowing users to save and clear the new index equation for future use.
Allowing users to select, calculate and put into a graphic any index which has been stored in the list.
Sending messages from events generated by the process.
Feedback console regarding the process status.
Logging all events generated by users when they use the software tool.
B. Non-Functional Requirements
The application uses hyperspectral images in ENVI format.
The application is compatible with Matlab® 8.6 or the latest.
It is necessary at least 300 Mbytes of RAM to execute the application.
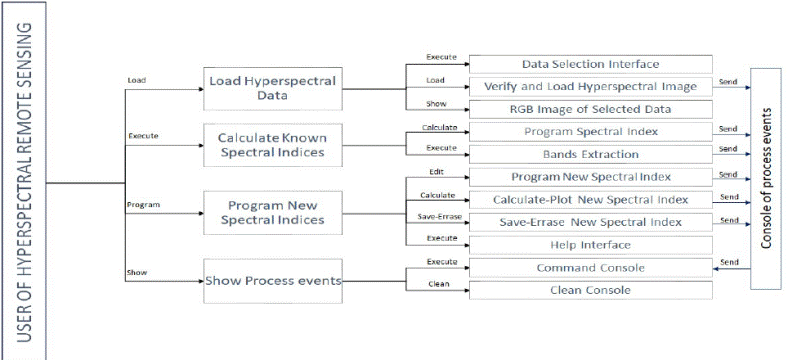
Fig. 1 shows the conceptual diagram that relates to the software functionalities and actors.
C. Implementation
To implement the software of vegetation indices generation, the database of hyperspectral images provided by Airborne Visible-Infrared Imaging Spectrometer sensor (AVIRIS) was used.
AVIRIS is an optical sensor that can capture images calibrated radiometrically. It uses reflectance values in 224 bands or spectral channels in a range of 400 to 2500 nanometers. The database of AVIRIS project provides a huge compendium of hyperspectral images taken at several regions of US territory and provides both radiance and reflectance information. These data have been obtained after an atmospheric calibration process [19].
According to the functional requirements described above, the software implements twelve vegetation spectral indices, widely documented in literature such as Normalized Water Index 1 to 4 (NWI 1-4) and Water Band Index (WBI), used in the estimation of relative water content in plants subjected to water stress [2]. Normalized Difference Vegetation Index (NDVI) and Simple Ratio (SR) are indices used in finding vegetation parameters such as biomass, green quantity, status and type of vegetation, [6-9]. The Green Normalized Difference Vegetation Index (GNDVI), Red Normalized Difference Vegetation Index (RNDVI) and Photosynthetic Reflectance Index (PRI) are used to determinate the quantity of photosynthetic area and radiation efficiency [2,9].
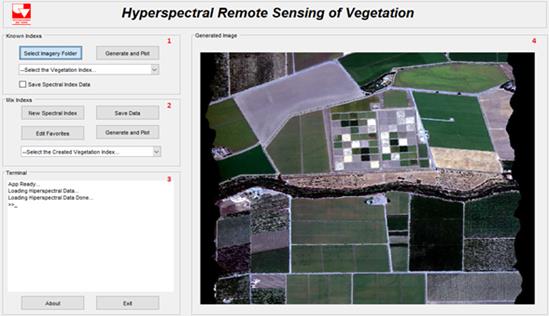
The software application also implements the combination of several spectral index like WBI and NDVI, the reflectance ratio between bands of 1000 and 1100 nanometers, 940 and 960 nanometers, 940/960 nanometers and NDVI which are used as estimators of water levels in leaves [2]. Fig. 2 shows the graphical user interface (GUI) he elements and functions described in the functional requirements section are highlighted. In this GUI, the panel with tag number 1 shows the tools corresponding to loading data, selecting spectral index, calculating and plotting the selected index and saving the results. The Panel with tag number 2 includes tools that correspond to the creation of new spectral indexes, saving data, editing the list of created indexes, selecting created indexes, calculating and plot the selected index. The panel with tag numbers 3 and 4 is showed the console of commands and the space for graphical presentation of results respectively.
V. TESTS AND RESULTS
To validate the compliance of the software tool requirements, two kinds of results are reported: first, from the RUP methodology point of view, the software integration tests; and second, a quantitative comparison between the results generated through ERDAS Imagine tool [20] and the software tool proposed in this paper. ERDAS Imagine software tool is one of the most common application used for tele-detection tasks and hyperspectral images processing.
A. Test - Calculate Known Spectral Index
The goal of these tests is to prove the GUI operation through the execution of functions as calculating and plotting the NDVI and other indexes of the selected image. It will allow users to visualize several vegetation types in the image.
To do this test, it was used a hyperspectral image with ENVI format that was obtained from AVIRIS data set, flight f130803t01p00r11.
Then, users can select the index to compute, for instance, the NDVI. The expected result is to obtain a console message about the successful load of the image, another message relating to the successful NDVI calculation and image visualization.
Fig. 3 shows the result of applying NVDI to the image displayed in Fig. 2. In Fig. 3 is possible to see that the applied spectral index allows users to distinguish the several levels of green. These green levels made possible to segment the types of crops, their growth status or healthy.
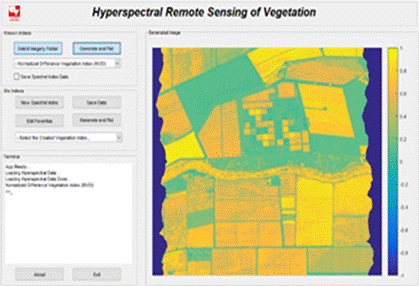
In the same way, the developed software tool allows users to calculate the next known vegetation indices: RNDVI, WBI, NWI1, NWI2, NWI3, NWI4, R1000/R1100, R940/R960, WBI/NDVI, PRI and SR.
B. Test - Programming New Spectral Indices
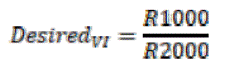
The goal of this test is to prove the functionality of calculating indexes proposed by the user and plotting the resulting image. The GUI allows writing an algebraic expression that represents the new desired vegetation index, such as the ratio between bands R1000 and R2000 given in Ec. 4.
 .Ec. 4
Where R is the band reflectance and 1000 or 2000 is the wavelength in nanometers of that band. In this test, it was used a hyperspectral image in ENVI format that was obtained from AVIRIS data set, flight f130803t01p00r11.
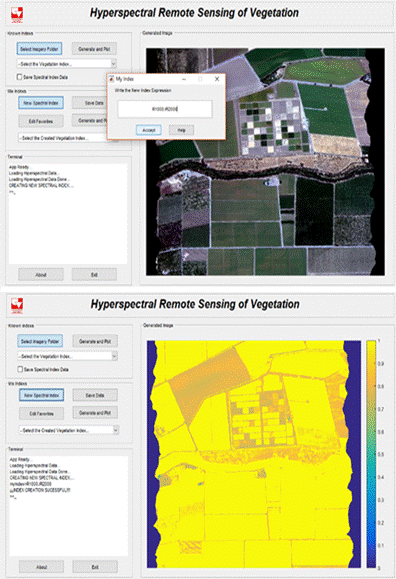
The procedure to follow is as follows: first, to select a hyperspectral image, and second, into the edition window users must program the desired expression for the new spectral index. The expected result is to obtain a message in the console about the success of the index programming by the user, the saving data process of the new spectral index, and the visualization of the resulting image.
This test shows the correct operation to introduce and visualize the results of new spectral indexes created by uses.
Fig. 4 shows the result of applying a spectral index defined by the expression R1000/R2000. The programming interface allows users to perform any math operation such as multiplication, addition, scalar products, among others.
C. Test - Quantitative comparison between ERDAS Imagine and the proposed software tool
The aim of this test is to establish the accuracy level of the indexes computed by the software tool proposed in this paper. To do so, a comparison between the results of the proposed software tool and the results obtained through ERDAS Imagine were considered.
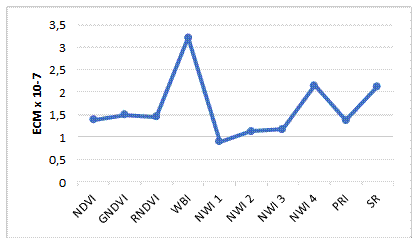
Fig. 5 shows the mean quadratic error obtained from the two image results, one belonging to the ERDAS Imagine tool, and the another to the proposed software tool. The vegetation indices used in this test were: NDVI, GNDVI, RNDVI, WBI, NWI1, NWI2, NWI3, NWI4, PRI and SR.
Considering the results showed in Fig. 5, it can be observed that the average mean quadratic error between the indices generated by both tools was 1.63e-7. This means that the software tool proposed in this paper is an efficient alternative to the commonly used application in the analysis of hyperspectral data.
VI. CONCLUSIONS
The vegetation spectral indices are developed to create a relationship between the features of vegetation or crops with the levels of reflectance captured in several wavelengths over the electromagnetic spectrum. This allows developing remote sensing systems which might be used to estimate useful variables for an agricultural production process.
The developed software tool implements several vegetation spectral indexes such as the Normalized Water Index 1 to 4 (NWI 1-4) and Water Band Index (WBI), which are used in estimation of relative water content and water stress, the Normalized Difference Vegetation Index (NDVI) and Simple Ratio (SR) which are indices used in finding vegetation parameters such as biomass, green quantity, status and type of vegetation. The Green Normalized Difference Vegetation Index (GNDVI), Red Normalized Difference Vegetation Index (RNDVI) and Photosynthetic Reflectance Index (PRI) are used to determinate the quantity of photosynthetic area and radiation efficiency. The software also implements the combination of several spectral indexes like WBI and NDVI, the reflectance ratio between bands of 1000 and 1100 nanometers, 940 and 960 nanometers, 940/960 nanometers and NDVI, which are used as estimators of water levels in leaves. Additionally, the software tool allows users to introduce custom spectral indexes. This functionality provides greater versatility in the analysis and ha ndling of the hyperspectral information.
The tests performed in this paper show that the software tool proposed in this paper is an efficient alternative to the commonly used application in the analysis of hyperspectral data.

