


 Inglês (pdf)
 Artigo em XML
 Referências do artigo
 Enviar este artigo por email
 Citado por SciELO
  Citado por Google
  Similares em
SciELO
Similares em
SciELO  Similares em Google
 Permalink
I. INTRODUCTION
HE production of non-centrifugal cane sugar (NCS) known as panela in Ecuador, presents deficiencies in the technological factors of production that compromise the efficiency and profitability of the process; the NCS faces demanding situations associated with the standardization of the manufacturing process and the characteristics of the final product [1], [2]. The lack of color standardization affects the competitiveness, quality, and sustainability of NCS. Currently, NCS production systems cannot provide the demand and quality requirements of countrywide and worldwide markets [3].
Due to recent scientific progress, NCS production has improved conditions for extraction, cleaning and clarification operations, leading to better color and appearance of the final product. However, the sensory quality is consumer acceptance characteristics, which have not been sufficiently studied [4].
This same study noted that operating conditions, such as pH, temperature, and pressure, exert a more profound effect on final product quality compared with intrinsic raw material characteristics [3], [4]. However, a comprehensive analysis of the process variables and their effects on the quality of the final products and food safety has not been carried out.
Consumer acceptance of NCS depends largely on quality attributes (°Brix, pH, moisture, direct and total reducing sugars, hardness, and color) and safety parameters (total coliforms, molds, and yeasts and the determination of the presence of Salmonella spp. and Escherichia coli). However, the aspects most valued by the intermediaries are color and texture [5].
Fructose caramelization at 118°C contributes mainly to color development in NCS compared to glucose and sucrose [6]. Therefore, the thermal stage is the most relevant in the production process, as it determines the quality of the final product.
Although color is one of the most important parameters for consumer acceptance, there are no color standards or references to identify and establish the best color for NCS. Only orange-brown tones are recommended, avoiding too light or strong orange tones, as they are associated with the addition of color modifying additives [4]. The color preferred by consumers is light golden yellow [7]. The above demonstrates the variability in the quality attribute panela color.
The statistical model proposed by [8] correlates the operational parameters and the color of the NCS; this would allow simulating the product quality specifications, which according to [9], has an impact on the reduction of economic losses due to defective products.
In the sugar industry, optimization of centrifuges, reduction of refining costs, solution of crystallization problems using real-time color measurements, and correlating them with process variables have been carried out [10], [11].
Therefore, designing a process considering quality from the design phase constitutes a challenge for the agro-industrial sector. In this regard, [12] he proposed a procedure for process design, which considers technical, environmental and economic criteria. However, to ensure a better product design that is flexible to market changes, an understanding of the process is necessary to improve the economics of production [13].
In this context, computer simulation provides the quantitative tools necessary for process intensification to achieve greater energy efficiency, lower raw material usage, improved product quality, reduced capital and operating costs [14], [15].
Food characteristics such as color, texture, flavor are related to the operating conditions; these are optimized using a genetic algorithm by varying the design variables to obtain the highest sensory ratings [16]. In this sense, decreasing the uncertainty in product quality from the design phase avoids that the workload of the designed equipment should not be modified [17]. In addition, in the food industry it is important to address from the design phase a procedure that considers quality, because it increases sales revenue [18].
The objective of this work is to propose a heuristic procedure for process design that considers the quality and validates it in the prediction of color as a quality attribute based on the behavior of the design and operating parameters of the granulated NCS production process.
II. MATERIALS AND METHODS
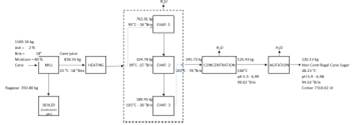
The following activities are proposed for the determination of the operating parameters and design parameters of the process in Fig. 1.
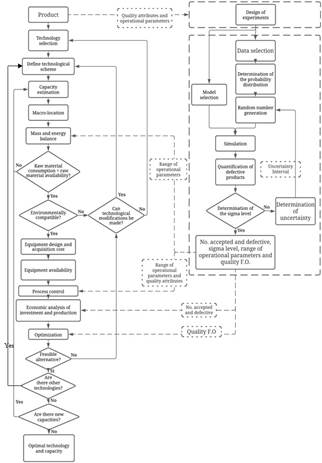
The description of the actions taken is shown below:
A. Design of experiments. The objective is to determine the relationships between process operational parameters that affect one or more product quality attributes.
B. Model selection. Mathematical models that provide an understanding of the product and the manufacturing process are selected.
C. Determination of the probability distribution. The objective is to establish the full range of probable outcomes of occurrence of the operating conditions and quality attributes.
D. Random number generation of the operating conditions within the experimental range.
E. Simulation of the quality attributes as a function of operating conditions to anticipate, validate and optimize the actual process.
F. Quantification of defective products. From the product quality attribute specifications obtained from the simulation, the defects per unit (DPU) and the percentage of defective products are determined [9]. According to [19], NCS can exist in a wide variety of colors, depending on a variety of factors. Consequently, it does not define a specific color range or color classification table. Thus, [20], [21] mention that NCS made from Thai sugarcane cultivars has a lighter color value in ICUMSA Units at 420 nm (I.U. 420) of (IU 2292-5285) than Japanese NCS products (IU 12,410-29,529). In Ecuador, according to (Quezada et al., 2016), organoleptically panela should be light brown to dark brown, so in this work, it is proposed to evaluate three IU intervals, thus: (7000 - 9000), (9000 - 11000), (11000 - 13000), products that are outside the range are considered defective, in this way will allow us to standardize the product according to market demand.
G. Determination of the sigma level of the process. It is an indicator of variation; it corresponds to how many standard deviations fit between the specification limits of the process. In this study it was analyzed if at least the Three-Sigma quality of the process is reached.
H. Technology selection. The objective is to select the technology with optimized operational parameters that guarantee the quality specifications of the demanded product.
I. Define the technological scheme. The objective is to define the technological scheme through the flow chart specifying the operating conditions.
J. Capacity estimation. The purpose is to estimate plant capacity based on market demand or availability of raw materials.
K. Macro-location. It consists of deciding the favorable region where the plant will be located, considering a) market demand and its future projection, b) the availability of raw materials, c) the availability of technologies for different processes, and d) the transportation costs of raw materials or finished products.
L. Mass and energy balance. The objective is to determine the flow and composition of all the streams involved in the process (raw material, intermediate, final, or residual product), in order to take advantage of the energy and materials involved.
M. Raw material consumption < raw material availability? The environmental indicators are compared with the current standards and are used to decide regarding the environmental compatibility of the technological alternative being evaluated. If consumption is higher than availability, return to the capacity estimation step and set a lower capacity.
N. Environmentally compatible? The objective is to compare the amounts of residuals; in this step, it is possible to determine if the technological alternative meets the environmental requirements.
O. Can technological modifications be made? The objective is to choose between the possibility of making technological modifications or selecting new technology.
P. Equipment design and acquisition cost in this step, the design parameters, equipment capacity, and the minimum dimension of each one of them must be determined from the results obtained from the mass and energy balances.
Q. The calculation of the acquisition cost of each of them will be determined from the design parameters that characterize it and its capacity through a scale adjustment and updating of its cost as proposed by [22].
R. Equipment availability. The objective is to calculate the optimum number of redundant equipment to be purchased and installed to maximize equipment availability and increase the real uptime of the plant.
S. Process control. It is a control strategy to ensure that quality attributes and process parameters are within expected limits [23], [24].
T. Economic analysis of investment and production. The objective is to estimate investment costs using the methodology proposed by [22]. In addition, plant income must be estimated in order to calculate the dynamic indicators of net present value (NPV), internal rate of return (IRR), discounted payback period (DRP).
U. Optimization. The objective is to determine the optimal plant parameters, defining as the objective function to minimize the variance of the quality attribute. The constraints under which the search is carried out are the additional relationships in the form of material and energy balances and design equations.
V. Feasible alternative? It is a decision making, it is evaluated if the alternative technology is feasible or not from the economic point of view. The decision making could be based only on considering if the NPV is positive, then the technology is selected.
W. Are there other technologies? In this decision-making process, the set of technological alternatives are compared through quantitative indicators that belong to the technical-economic and environmental dimensions. The decision making will depend on the objectives previously outlined for the selection of the best technological alternative. Once all the technologies have been exhausted, the best one is selected. The one that presents the best technical, economic, environmental and social indicators within its classification.
X. Are there new capacities? The objective is to analyze the existence of new capacities for the selected technological alternative, as long as the selected capacity complies with the availability of raw materials. In this step, the level of demand satisfaction (social indicator) can be improved, thus affecting the social dimension.
Y. Optimal technology and capacity. The objective is to select the optimal technological alternative from the environmental, technical-economic, social and quality standards point of view.
III. RESULTS AND DISCUSSION
A. Design of experiments. Table I shows the data measured in the concentration stage. The color range according to [25] is 7000-13000 U.I. it is observed that samples D, E, F, G, are out of the ranges.
TABLE I SAMPLES AND VARIABLES OF THE CONCENTRATION PROCESS
| Sample | Initial temperature (ºC) | Final temperature (ºC) | Concentration time (min) | pH | Colour (UI) |
|---|---|---|---|---|---|
| A | 85 | 122.4 | 125 | 5.90 | 8761.9 |
| B | 93 | 122 | 52 | 5.95 | 7650.79 |
| C | 87 | 119 | 77 | 5.84 | 8717.95 |
| D | 83 | 115 | 55 | 5.54 | 6539.12 |
| E | 75 | 120 | 64 | 5.36 | 5831.25 |
| F | 82 | 123 | 76 | 5.32 | 6488.10 |
| G | 87 | 113 | 45 | 5.25 | 6045.92 |
| H | 82 | 117 | 75 | 6.09 | 7753.82 |
| I | 69.7 | 118 | 118 | 6.15 | 7992.53 |
| J | 77.3 | 118 | 70 | 6.29 | 8375.85 |
Table II shows the data measured in the crystallization stage. It can be observed that samples D, E, F, G, are outside the range established in [25].
TABLE II SAMPLES AND VARIABLES AT THE CRYSTALLIZATION STAGE
| Sample | Initial temperature (ºC) | Final temperature (ºC) | Agitation time (min) | pH | Final colour (UI) |
|---|---|---|---|---|---|
| A | 122.4 | 65 | 2.30 | 5.90 | 7980.60 |
| B | 122 | 67 | 2.15 | 5.95 | 7115.38 |
| C | 119 | 72 | 1.45 | 5.84 | 8366.01 |
| D | 115 | 76 | 1.50 | 5.54 | 6080.59 |
| E | 120 | 74 | 1.45 | 5.36 | 5943.22 |
| F | 123 | 69 | 1.50 | 5.32 | 5822.10 |
| G | 113 | 70 | 2.07 | 5.25 | 6059.76 |
| H | 117 | 70 | 2.10 | 6.09 | 7340.52 |
| I | 118 | 69 | 2.05 | 6.15 | 7488.33 |
| J | 118 | 70 | 2.35 | 6.29 | 8025.69 |
B. Model selection. The Statgraphic XVI program was used to analyze the experimental data by the multivariate method. Using the ordinary least squares multiple regression method, equations 1 for the concentration stage and equation 2 for the crystallization stage were obtained, in which the dependent variable is color, and the operational parameters are the independent variables.
where:
C c = Colour in the concentration stage
pH c = potential hydrogen in the concentration stage
pH y = potential hydrogen in the crystallization stage
t c = concentration stage time
Tf c = final temperature in the concentration stage
To c = initial temperature in the concentration stage
C y = Final colour (crystallization stage)
T a = agitation stage time
Tf y = final temperature in the crystallization stage
C. Using Wolfram Mathematica 12, it was determined that the experimental data of initial temperature, final temperature, agitation time, and pH respond to a continuous uniform probability distribution; this distribution better defines the path of the operating conditions.
D. Random numbers are generated for the operating conditions within the experimental range, representing the production of 10 daily batches, 120 monthly batches, and 1560 batches per year since the artisanal working conditions in the Amazon allow processing activities to be carried out three days a week.
E. Quality attribute simulation. The application limits proposed for the simulation of the process of obtaining NCS allowed obtaining the results shown in Table III for the concentration and crystallization stage.
TABLE III OPERATIONAL PARAMETERS
| Colour (IU) | pH Evaporator 4 | °Brix Evaporator 4 | pH Crystalizer | °Brix Crystalizer | Sigma level | Batches |
|---|---|---|---|---|---|---|
| 7000 - 9000 | 5.91 | 90.52 | 6.11 | 91.69 | 2.78 | 10 |
| 7000 - 9000 | 5.87 | 90.23 | 5.92 | 91.27 | 2.28 | 120 |
| 7000 - 9000 | 5.94 | 90.14 | 5.94 | 91.19 | 1.89 | 1560 |
| 9000 - 11000 | 6.17 | 90.84 | 6.12 | 92.03 | 6 | 10 |
| 9000 - 11000 | 6.08 | 90.72 | 5.97 | 91.28 | 6 | 120 |
| 9000 - 11000 | 6.04 | 90.38 | 6.02 | 91.40 | 3.81 | 1560 |
| 11000 - 13000 | 6.21 | 90.51 | 6.00 | 91.19 | 0 | 10 |
| 11000 - 13000 | 6.07 | 90.51 | 6.15 | 92.05 | 0 | 120 |
| 11000 - 13000 | 6.03 | 90.44 | 6.14 | 91.59 | 0 | 1560 |
It is observed that at pH 6.0845 and 90.72 °Brix in evaporation and pH 5.9789 and 91.2857 °Brix in crystallizer, a sigma level of 6 is obtained, which means that in these operating conditions, the 120 production batches will be between 9000 to 11000 (UI).
Fig. 2 shows the behavior of the sigma level for the color ranges. The range of 9000-11000 (UI) presents a sigma level greater than 3; this indicates that all the batches fulfill the quality expectation; therefore, the batches are accepted.
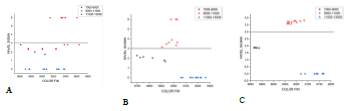
Fig. 3 shows the heat transfer area in the concentration stage. It shows its variations depending on the operating conditions; for the color range ICUMSA 11000 - 13000 (G, H, I) it is optimized in one iteration. There is more variability for the color range ICUMSA 7000 - 9000 (A, B, C).
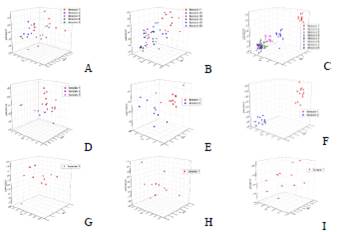
Fig 3 Behavior of heat transfer areas in the concentration stage for different batches: color ICUMSA 7000-9000 (A) 10, (B) 120, (C) 1560; color ICUMSA 9000-11000. (D) 10, (E) 120, (F) 1560; color ICUMSA 11000-13000. (G) 10, (H) 120, (I) 1560.
Fig. 4 shows the heat transfer area at the crystallization stage. In the color range ICUMSA 7000 - 9000 (A, B, C) it is observed that the variation of the quality attribute affects the heat transfer area to a greater extent than in the color range ICUMSA DE 11000 - 13000 (G, H, I) where an iteration was necessary to optimize the process.
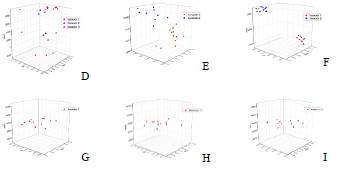
Fig 4 Behavior of heat transfer areas in the crystallization stage for different batches: color ICUMSA 7000-9000 (A) 1, (B) 120, (C) 1560; color ICUMSA 9000-11000 (D) 10, (E) 120, (F) 1560; color ICUMSA 11000-13000 (G) 10, (H): 120, (I) 1560.
Fig. 5 shows NPV obtained during the different iterations. The ranges of 7000-9000 and 11000-13000 were negative due to the high number of defective products, while in the range of 9000-11000 the NPV was positive, showing significant increases because the defective products decreased.
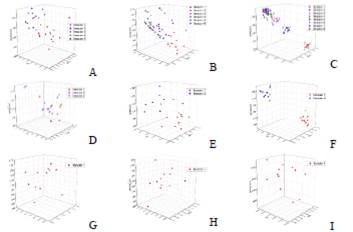
Fig 5 NPV behavior for different batches between the ICUMSA color range of 7000-9000 (A) 10, (B) 120, (C) 1560. 9000-11000 (D) 10, (E) 120, (F) 1560 and 11000-13000 (G) 10, (H) 120, (I) 1560.
F. Quantification of defective products. The defective per million opportunities (DPMO) was quantified between the range of 7000-9000 Figure 6 (A, B, C); with the simulation data, more iterations were necessary to reduce it and achieve the maximum number of accepted products.
Fig. 6 (D, E, F) shows that the defectives per million opportunities in the range of 7000-9000 are high. Therefore, the production is not acceptable.
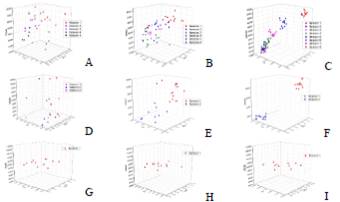
Fig 6 Defective values per million opportunities (DPMO) for different batches. ICUMSA 7000-9000 color range (A) 10, (B) 120, (C) 1560. ICUMSA color range 9000-11000 (D) 10, (E) 120, (F) 1560. ICUMSA color range 11000-13000. (G) 10, (H) 120, (I) 1560.
It is observed that the defectives per million opportunities in the range of 9000-11000 were reduced to the maximum. Therefore, the production is acceptable.
Defects per million opportunities (DPMO) were quantified between the range of 9000-11000; with the simulation data, more iterations were needed to reduce it to achieve the maximum number of accepted products.
Fig. 6 (G, H, I) shows that defectives per million opportunities in the range of 11000-13000 were high. Therefore, the production is not acceptable.
G. Determination of the sigma level of the process. Fig. 7 (A, B, C) shows that after having developed the different iterations, the sigma level is less than three. Therefore, the production is not accepted.
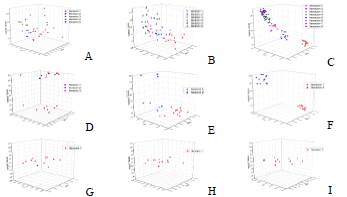
Fig 7 Sigma level values for different batches. ICUMSA 7000-9000 color range. (A) 10, (B) 120, (C) 1560. ICUMSA color range 9000-11000 (D) 10, (E) 120, (F): 1560. ICUMSA color range 11000-13000 (G) 10, (H) 120, (I) 1560.
As the iterations between the range of 7000-9000 are developed, the uncertainty is reduced until reaching a Sigma level greater than three. This means that the number of defective lots decreased with each iteration.
Fig. 7 (D, E, F) shows that after the different iterations have been developed, the sigma level is greater than three; therefore, the production is accepted. As the iterations are developed between 9000-11000, the uncertainty is reduced until reaching a Sigma level greater than three. This means that the number of defective lots decreased with each iteration.
As the simulations are run between the range of 11000-13000, the uncertainty is reduced until a Sigma level greater than three Figure 7 (G, H, I) is reached. This means that the number of defective batches decreases with each iteration.
H. Technology selection. The technological variant selected for the design of an artisanal NCS production plant in Amazonian conditions is semi-continuous one where the type of process is a batch operation. It is based on the use of heat exchangers for the evaporation and concentration of the sugarcane juice until the formation of crystals by agitation and drying.
I. Define technological scheme. The technology can be carried out following a process of stages, which have been represented in a block diagram (Figure 8).
J. The capacity estimate was made based on the availability of raw material, since the demand for the product is much higher than the production capacity[12]. It was decided to set a production capacity of 1169.36 kg/batch of sugarcane.
K. Macro-location. We considered the availability of raw materials and the availability of technologies for artisan type companies located in the province of Pastaza in the Tarqui parish.
L. Mass and energy balances were carried out for each of the pieces of equipment that make up the technology. From this analysis, the environmental indicators that characterize the production of 120kg/batch of NCS were identified in Table IV.
TABLE IV ENVIRONMENTAL INDICATORS
| Indicators | Value | Units |
|---|---|---|
| Raw material consumption | 9.73 | kg cane / kg NCS |
| Energy consumption | 2650.52 | J / kg of NCS |
| Total steam produced | 617.07 | kg |
| Solid discharge | 3.38 | kg bagasse. bagasse / kg NCS |
| Gas discharge | 5.30 | kg steam / kg NCS |
M. Table IV shows that raw material consumption is lower than raw material availability.
N. NCS artisanal production is environmentally compatible since it is considered favorable that CO2 emissions originate from the use of bagasse as an energy source and not from the use of fossil fuels.
O. The present study allows technological modifications to be made to the traditional process with regard to the selection of operational parameters that produce a product with color 7310.62 IU, table V.
TABLE V OPTIMAL RANGE OF OPERATIONAL PARAMETERS
| Operational parameters | Minimum | Maximum |
|---|---|---|
| pH evaporator 4 | 5.50 | 7.00 |
| °Brix evaporator 4 | 89.00 | 92.97 |
| time DC evaporator 4 (minutes) | 20.00 | 29.97 |
| pH dryer | 5.90 | 6.99 |
| Agitation time in dryer (minutes) | 10.00 | 19.95 |
| Dryer final temperature (°C) | 40.05 | 59.97 |
| cane pH | 3.50 | 4.98 |
| Cane °Brix | 13.00 | 17.97 |
The pH and °Brix ranges proposed in Table 5 were established considering that the ranges obtained in the first case study are within these intervals.
P. Equipment design was determined from the flows obtained in mass and energy balance and technological scheme. Table VI shows the design variable.
TABLE VI DESIGN PARAMETERS
| Equipment | Design variable (Area - m2) |
|---|---|
| Filter | 0.6164 |
| Heater | 0.7405 |
| Evaporator 1 | 2.7810 |
| Evaporator 2 | 1.2649 |
| Evaporator 3 | 0.4484 |
| Concentrator | 1.1683 |
| Dryer | 1.3913 |
Q. In this work, the acquisition cost of the equipment is 20582.47 USD. Equivalent to 90 $/kg product obtained, as proposed by [26]. The cost update index for the year 1992 is 358.2, and for the year 2019 is 562.1 according to [27]. This reference was used because the capacity of the plant is adapted to the conditions of the Ecuadorian Amazon.
R. Equipment availability. The actual plant operation time in Amazonian conditions is three days/week; therefore, it is not considered necessary to have redundant equipment.
S. For process control, operational parameters should fluctuate as shown in Table V, thus achieving the NCS color fluctuation between (11532.75 - 7387.26 IU); these are within the maximum ICUMSA color range stated in [25].
T. Economic analysis of investment and production. Values suggested by [22] for a solid and fluid processing technology were taken. Table VII summarizes the investment costs, plant income. The dynamic indicators of net present value (NPV), internal rate of return (IRR), and the discounted payback period (DRP) calculated are positive; therefore according to [12] these indicators are considered for investment decision making.
TABLE VII VALUES FOR ECONOMIC ANALYSIS
| Components | Estimated cost ($) |
|---|---|
| Equipment acquisition cost ($) | 20582.47 |
| Working capital ($) | 15231.03 |
| Total capital invested ($) | 100236.67 |
| Invested Fixed Capital ($) | 85005.63 |
| NCS Price ($/kg) | 1.06 |
| Payback period (years) | 1.67 |
| Net present value ($) | 128707.57 |
| Internal rate of return (% / year) | 0.28 |
| Profit margin (%) | 0.52 |
| Total expenses ($) | 41867.69 |
| Total income ($) | 88767.45 |
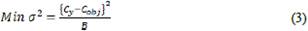
U. Optimization. Models that correlate the color and the operational parameters in the concentration and agitation drying operations, the objective function that minimizes the variance ((2) of the final color was proposed. Equation 3. For the construction of the model, it was taken as a reference what was raised by [28].
In this work, the only color was considered as a quality attribute because of its importance in the sugar industry [11]. The operational parameters are considered as decision variables of the optimization problem.
where:
Min (2 = Objective function _ minimize the variance of the quality attribute (color)
Cobj = 10000 U.I., this corresponds to the average of the ICUMSA color range (7000 - 13000 U.I) for NCS [22].
B = number of batches
V. The technological alternative is feasible considering that the color obtained 7310.62 U.I is within the target range and that the dynamic indicators are positive.
W. Other technologies are not evaluated because the technical, economic, environmental, and quality indicators are favorable.
X. The capacity for the selected technological alternative is feasible, according to [29]. Sugar cane for sugar is one of the most productive crops in Ecuador. Therefore, the availability of raw materials is feasible.
IV. CONCLUSIONS
Color modeling and simulation as a function of operational parameters have shown great benefit for both color prediction and color feedback control in the design phase, in addition to selecting technical indicators for operation, and equipment design, evaluating environmental indicators and optimizing economic indicators due to increased process performance by reducing products that do not fulfill quality specifications. Also, in the start-up phase, they can be used to define the upper and lower limits of the color signal to warn the operator in real-time if an inspection of the operational parameters is required and to maintain production stability. Color prediction as a quality attribute of the NCS based on operational parameters allows production batches to be planned according to market requirements as well as to reduce the products that do not meet the quality standard. Therefore, the economic-financial indicators become more attractive due to the utilization of raw materials and the yield of the finished product. Operational parameters for the concentration and crystallization stages are pH and °Brix of 5.9-6.12 and 91.4-92.03, respectively for a color of 9000-11000 IU. Simulations with the operational parameters studied restrict obtaining values lower than 8000 IU and higher than 10000 IU since the optimal sigma level is not reached.

