Inglés (pdf)
 Articulo en XML
 Referencias del artículo
 Enviar articulo por email
 Citado por SciELO
  Citado por Google
  Similares en
SciELO
Similares en
SciELO  Similares en Google
 Permalink
University presses are not too big to fail. However, they are too important to fail, because they have played a pivotal role in the transmission of ideas and culture.
Introduction
University presses are defined as the publishing houses associated with higher education institutions (Giraldo-González; Giménez-Toledo; Córdoba-Restrepo, 2022); this means that they are almost always a sub-organization of universities (Anderson, 2018). Their main objective is to promote publishing scholarly books and scientific journals, and thereby contribute to achieve one of the substantive missions of universities: generate new knowledge (Britton, 2022; Vázquez-Miraz; Posada-Llorente, 2020). By doing that, they support the advancement of knowledge and science, economic development, intercultural dialogue (Greco; Aiss, 2015), and social welfare beyond their local area of influence, while seeking greater impacts that enable problem-solving nationally and internationally.
Publishing scientific articles in journals has been the main research unit in the information sciences, especially in the library and information studies. It has led to the comprehension of publishing patterns in different study fields (Chi, 2019), the internationalization of collaboration (Kwiek, 2021), to measure impact (Lancho-Barrantes; Guerrero-Bote; De Moya-Anegón, 2013), the capabilities in the management of knowledge (Ceballos; Fangmeyer; Galeano; Juarez; Cantu-Ortiz, 2017), and to rank researchers outputs at individual (Hirsch, 2010), university (Aguillo; Bar-Ilan; Levene; Ortega, 2010), internal academic units (Zornic et al., 2015), and country levels (Jacsó, 2009).
In the same framework -but counting out other book-centered approaches like those from the literature, documentation and library disciplines, or research areas such as writing, editing, and publishing studies- scholarly books have started gaining interest in the last two decades as a unit of analysis. For example, as a way to approach the quality and prestige of scholarly publications (Giménez-Toledo, 2020; Giménez-Toledo; Córdoba-Restrepo; Giraldo-González; Mañana-Rodríguez, 2021), to analyze collaboration patterns (Ossenblok; Engels, 2015), and to review their value for modern research evaluation systems (Engels; Istenic-Starcic; Kulczycki; Pölönen; Sivertsen, 2018; Zuccala; Robinson-García, 2019).
From the publisher's perspective, books also allow addressing assessment initiatives nationally and internationally (Giménez-Toledo; Mañana-Rodríguez; Tejada-Artigas, 2015), understanding online marketing strategies to reach new audiences through social media (Mas-Bleda; Makita; Mrva-Montoya; Thelwall, 2022), and targeting the academic impact of books by tracking their citations performance on Google Scholar (Mingers; Kaymaz, 2019) or Book Citation Index (Torres-Salinas; Robinson-García; Campanario; López-Cózar, 2014; Torres-Salinas; Robinson-García; Jiménez-Contreras; López-Cózar, 2012).
In fields such as Social Sciences and Humanities (SSH), books remain an essential publication type (Verleysen; Ossenblok, 2017) and an integral part of scientific communications. They play a key role to understand the configuration of collaborations and internationalization of scholarly research (Ossenblok; Engels, 2015). Books are different from journals, especially in SSH, because they cover research topics such as state-of-the-art analysis and broader contexts, allow depth explanations, detailed perspectives, and develop theories that do not fit well in a scholarly communications like scientific articles (Giménez-Toledo, 2020). Moreover, books play a crucial role in the preservation and transference of knowledge to society.
To study the performance of research output, citations only reveal a limited portion of information of interest to the entire book publishing industry (Zuccala; Robinson-García, 2019). It would be possible to have a wider view through bibliometric analysis, which offers a broad set of tools that might help to understand the book publishing ecosystem better, at least in the scholarly book sector.
This exploratory pilot case study embraces Social Networks Analysis (SNA) as the quantitative technique used to understand how collaborations flow within a given scholarly network. It aims at identifying important or influential individuals, describe network structure, and how individual positions and interactions fit within a network (Golbeck, 2013). In this way, it contributes to the field of editorial studies in Colombia, which is still a young research area (Giraldo-González et al., 2022) barely addressed among librarians and documentalists, as well as among publishers and book researchers in Colombia.
This study focuses on the publishing of monographs and edited books as long as they represent essential communications media in SSH (Giménez-Toledo, 2020). While monographs are specialized scholarly works focused on a single subject or an aspect of a subject, usually written by a single author (Emery; Lucraft; Morka; Pyne, 2017), the edited book1 can be understood as a "collection of chapters written by different authors, gathered and harmonized by one or more editors" (Ossenblok; Engels, 2015: 220). It is a collective effort that can be tracked by exploring its role in "community building" (Edwards, 2012: 62).
Here, the bibliometrics co-authorship data are built from authors as well as book editors; they "contribute to the volume as authors of the introduction, the conclusion and/or one or more of the chapters" (Ossenblok; Engels, 2015: 220). This information can be transformed into a network of co-authors to illustrate the health of collaborative research in a scientific community (Woolhouse; Albin-Clark; Shirley; Webster, 2020), to make subgroup comparisons, or to identify main researchers, as well as to promote analytical applications for ranking relations and experts (Hansen; Shneiderman; Smith; Himelboim, 2020).
Book editors play a fundamental role in the construction of collective works. They coordinate the process of calling for chapters and ask some high-level experts for text contributions. They lead the communication flows between the authors and serve as an intermediary for the Press as a corresponding author. Last but not least, they are the visible faces to the editorial institutional authorities involved in the selection of book proposals (Anderson, 2018). That is why this study seeks to position them as an actor focused on the co-authorship network.
The contribution of this study can be summarized by approaching the next research questions:
RQ1: Which authors play an important social role within the co-authorship network?
RQ2: How many modules exist within the network?
RQ3: Who serves as a bridge to connect otherwise unconnected subgroups?
To address these questions, the article is structured into 6 sections as follows: in addition to this introduction, section 2 provides insight into academic books and the relevance to study them through co-authorship network analysis; section 3 presents a framework for understanding social network analysis in this research, and integrity and centrality measures; section 4 presents the data input and methodological approach; section 5 analyzes the results of this case study; section 6 concludes the paper.
Co-authorship patterns in scholarly books
When the authorship of a research product is shared with one, two, or more people, it means that all persons involved in a product are co-authors. In co-authorship networks, any person is related to two or more authors who co-authored a research product (Kumar, 2015).
As long as everyone mostly chooses with whom they would like to do research, co-authorship also seems to reflect collaboration, which can cross institutional, regional, and national boundaries, as well as those related to research fields or methodological approaches. In a precise manner, co-authorship provides insight into the structural patterns of collaboration (Glänzel; Schubert, 2005) that may be determined by factors such as long history of socialization between co-authors, communication frequency, support beyond collaborative matters, and educational shared history (Ponomariov; Boardman, 2016).
Certainly, scholars build communities based on their research interests, and this could be at times deciphered by the network patterns. These research communities can be detected through cluster analysis (Kumar, 2015). It is likely to find cases of assortative mixing, when nodes tend to connect with similar ones; this may be influenced by factors such as academic popularity, researcher position, nationality, gender, etc. The opposite would be disassortative mixing, which is often observed in cases where less connected nodes prefer to connect with popular ones (Kumar, 2015).
The centrality of nodes is related to factors such as leadership (Luo, 2005). They tend to be the actors with the most team coordination capabilities, control of major key information, and influence on the direction of most research group activities (Rodríguez-Gutiérrez; Gómez-Velasco, 2017).
Co-authorship networks also might reveal citational behaviors. Thus, more central authors correlate with a higher number of citations (Kumar, 2015). Centrality measures, such as betweenness, influence citation counts at most (Uddin; Hossain; Rasmussen, 2013; Yan; Ding, 2009).
Figure 1 provides three examples of a 5-node network to illustrate the selection of a complete graph (Scott, 2017) that represents a book co-authorship network. Case 1 might be perceived as the first option, and although it seems an easy way to illustrate the connections between authors of the same book in terms of graph theory, the extreme nodes (A and E) are not directly connected to each other.
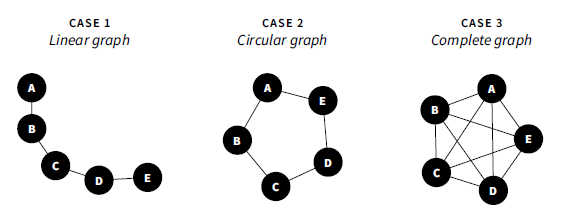
Case 2 corrects this but instead shows that the network still has nodes that are not directly connected (e.g., A-C, A-D). Unlike linear or circular graphs, Case 3 is complete, a fully dense network, a clique (Golbeck, 2013), which means that all nodes are directly connected to each other.
Each social network represents a group of nodes linked to each other (Ariel-Xu; Chang, 2020), and other groups of nodes can be linked through individual relationships. This means that an author may not only be linked with a co-authorship network but can also serve as a bridge to another group of authors of different books.
From the point of view of the Copyright, co-authorship can also be classified in two types: first, it can be a collective work in which every book chapter is written by a different set of authors; second, it can be a collaborative work in which all authors represent the whole book (Patiño-Díaz, 2013).
This paper contributes to the field of Information Sciences, specifically to bibliometric studies of scholarly books, by approaching them as a unit of analysis made up of all the authors included in it (unit of observation). This means that a book is the expression of a collective work that reflects a collaborative effort. Just as all authors in a book travel together within it, so do they in the ISBN registration, by being book-reviewed in journals or simply highlighted under the same book title. For this reason, each book will generate a complete, fully dense, and direct connected graph as in Case 3.
Social Network Analysis (SNA)
SNA is a mathematical technique that allows a simultaneous evaluation of the relations within a group (network), the qualities of each group member (nodes2), and their linkages (edges3). It is also a data visualization strategy that uses graphs to display information related to relationship patterns (Kumar, 2015). Mapping information from a matrix database in this visual form should help in the analysis and interpretation of a collective linked structure (Baji; Mostafavi; Parsaei-Mohammadi; Sabaghinejad, 2021).
This visualization technique involves a set of social network measures associated with different SNA approaches, initially focused on simple counts of connections that became more sophisticated over time (Hansen et al., 2020). On the one hand, integrity measures tend to demonstrate the strength and coherence of the linkages between nodes. On the other hand, centrality measures indicate the position of each node within the network and rank them in order of closeness, betweenness, and degree. In other words, this indicator settles the "power, status, and influences distribution of actors" (Baji et al., 2021: 8207) by identifying the most important or central actor or actors in a social network.
The application of this graph theory in the SNA also leads to identify which nodes remain in a peripheral zone, and which ones are highly connected to many other actors and are located in a more central zone of the network (Hansen et al., 2020).
Density, Diameter, Average Distance, Modularity, and Clustering Coefficient as integrity measures4
Integrity measures (IM) aim to demonstrate the strength of relationships in a sociogram and how they are all coherently linked within a network (Baji et al., 2021). In other words, it analyzes the vulnerability of network components and their sensitivity to structural changes, also reflecting the capacity of the system to sign behavioral patterns (Andras; Idowu; Periorellis, 2006).
Density is the sum of all possible pairwise connections in a network (Baji et al., 2021). This measure ranges from 0, which represents a highly fragmented and unconnected network, to 1 (100 %), which means the total opposite and occurs when all nodes are linked to each other; thus, it stands for an entirely cohesive network. This measure represents some important sociological ideas such as cohesion, solidarity, and membership (Hansen et al., 2020).
Diameter represents the highest level of eccentricity (Hage; Harary, 1995). It means the greatest distance from any node to the farthest node. In other words, the maximum distance between any pair of vertices within a graph (Alonso-Cifuentes; Carabali, 2019).
Average Distance represents the number of vertices relations needed for any author to get linked to each other. A low average distance indicates that authors are close to one another, which might be the result of a highly dense network or a well-connected set of authors (León; Bahos-Olivera, 2021). In contrast, high average distance values indicate peripheral locations of nodes, which means that a larger set of connections are needed to reach others in the network (Hansen et al., 2020).
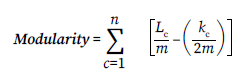
Modularity measures the network structure based on the division of a graph into subgroups, communities, or modules (Kalhor; Asadi-Sarijalou; Sharifi-Sadr; Bahrak, 2022). It can be used to measure the quality of a subgrouping strategy based on how densely connected are the nodes of the same subgroup to each other, while being sparsely connected to another subgroup (Hansen et al., 2020). Graphs with a high modularity score will have dense connections between nodes within modules but only a few pointing outwards to other communities (Neo4j, 2022). The number of communities is not predetermined, but they can be manually assigned by categorizing groups on the dataset or automatically identified using community detection algorithms (Hansen et al., 2020). This study is based on automatic module detection.
Clustering Coefficient indicates the average degree of a network to which nodes intend to cluster (Kalhor et al., 2022), identifying a subset of actors within the same network (Ávila-Toscano; Marenco-Escuderos; Romero-Pérez, 2019). This value varies between 0 and 1 since it is the percent of possible edges (Hansen et al., 2020).
Degree, Closeness, Betweenness, and Eigenvector as centrality measures5
Centrality measures (CM) identify nodes with higher levels of interaction within a network (Rodríguez-Gutiérrez; Gómez-Velasco, 2017). For the analysis, it is important to note that this type of popularity measure does not necessarily differentiate between quantity and quality of interactions (Hansen et al., 2020). Therefore, more than one centrality measure should be included in any SNA to gain a better perspective on the network (Golbeck, 2013). In this study, each node has a centrality measurement value, and the centralization of the network will be evaluated according to its distribution.
Degree Centrality is a count of the number of unique linked edges in a network. The highest value of this measure indicates the most central actor, considering its level of connections to various subgroups within the network (Alonso-Cifuentes; Carabali, 2019). Here, the central nodes tend to be the focal points of interactions (Freeman, 1978); hence, popular within a graph (Neo4j, 2022), that is, being in the main flow of information.
Closeness Centrality relates to nodes with a higher number of linkages within a network (Rodríguez-Gutiérrez; Gómez-Velasco, 2017). Nodes with a high closeness score have the shortest distances to all other nodes. Thus, the more central a node is in the network, the smaller its total distance to all other nodes (Neo4j, 2022). This gives the central nodes the ability to spread information efficiently from their position to all other nodes sequentially (Newman, 2005).
Betweenness Centrality shows intermediate levels of direct connections between nodes. Thus, it measures the extent to which a node controls the interaction possibilities between other actors (Baji et al., 2021). That is, the frequency with which a node is on short paths between different pairs of nodes (Kalhor et al., 2022). It could be an indicator of the influence of a node on the flow of information in a network graph (Freeman, 1978).
Eigenvector Centrality is based on the idea that a node's centrality is related to the centrality of adjacent nodes (Ariel-Xu; Chang, 2020). This means that the importance of a node depends on how well-connected its neighbors are. In other words, the centrality of a node depends on the centralities of its neighbors (Kalhor et al., 2022). Thus, the more a node is connected to many other nodes with a high eigenvector score, the more central it becomes in the network (Neo4j, 2022). Simply expressed, a node is important if it is linked to other important nodes.
Methodology
This section introduces the dataset built for this case study as well as the metrics and techniques used to analyze co-authorship networks. Case studies may give rise to new research questions, develop theories on under-researched areas, and provide valuable means for a comprehensive in-depth account that communicates the specific findings of the case (Ylikoski; Zahle, 2019). Editorial Universidad Icesi (EUI) was chosen as the case study because, on the one hand, there are detailed data of each book published since the middle of the first decade of the xxi century; on the other hand, to set a valid example of a young, regional, and relatively small6 university press in an upper middle-income economy and developing country such as Colombia.
Dataset
All authors in the database have at least one publication from 2007 to 2021, whether monographs or edited books7. Book chapter authors are added to each edited book's co-authors network. The academic editors, coordinators, or compilers of books were added as authors if they also contributed one chapter to the book. Editorial presentations, forewords, or epilogues were counted as book chapters, as well as introductions and conclusions.
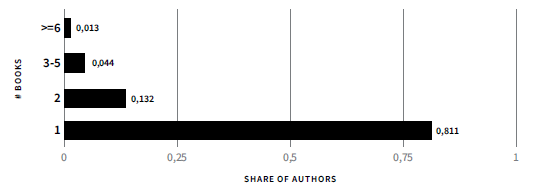
The co-authorship database consists of 188 books, published by 986 authors, and 9656 co-authorship relations. Each author represents a node, and the co-authorship relationships are represented by their connections. The size of each node represents the number of books in which they participate as authors. Figure 2 shows the distribution of authors and the number of books in which they participate.
As seen in Figure 2, 81.1 % of the authors participated in only one book. If the group of two-book authors is added, it increases to 94.3 %. This indicates a significantly low frequency of author productivity regarding the publication of books in EUI, which is also reflected in an overall average of 1.3 books per author. Less than 6 % of authors can be classified as medium (4.4 %) or high (1.3 %) for publishing three or more books over the entire 16-year period. The highest value corresponds to one author who has taken part in 11 books (0.1 %).
The number of authors per book varies greatly each year in the studied period. Figure 3 shows the evolution patterns of single-authored and multi-authored books for the fifteen-year period. Being the sole author of a book seems to be a frequent practice in book publishing in the EUI. It is associated with the publication of a series of monograph books of distinguished masters or doctoral theses by institutional professors. These single-authored books represent 34.6 % of the overall share, equivalent to 65 published books (see Figure 4), obtaining their highest value in 2015 with 8 books (90 %), its lowest in 2013 with no publications, and an average of 4.3 books per year.
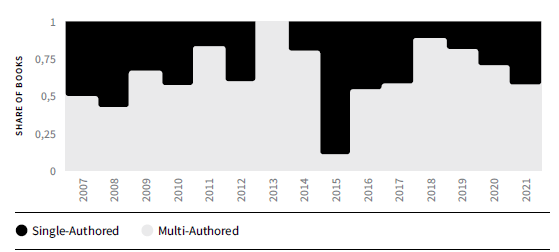
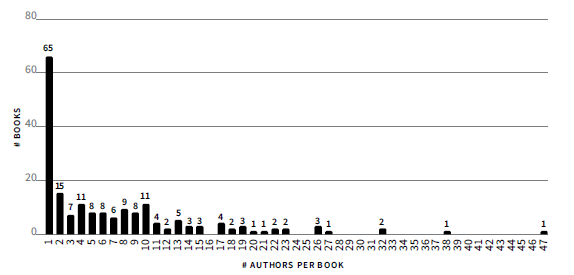
Multi-authored books represent the most common way publishing in the EUI, almost doubling the overall share (64.2 %) and raising the average number of books per year to 8.2. With the exception of 2008 and 2015, all share values remain above 50 % (see Figure 3). The overall distribution of authors by book shows at least two additional sets of author configurations in addition to the single-authored books mentioned above (see Figure 4).
The first set of authors is related to books written by between two and ten authors each. This subgroup has published an average of 9.2 books, with a range of six to fifteen books. The most frequent and prolific book authors from the EUI take part in this group. A second subgroup is characterized by a less wild variation of productivity around one and four books, with an average of 2.4 but a relatively high number of author participation per book, between 11 and 47 authors. Here, four books can be counted as outliers: one of them with 47 authors, another with 38, and two others with 32 authors each.
As collaborations leave digital footprints in the form of bibliographics (Kumar, 2015), co-authorship patterns can be effectively tracked and evaluated by book metadata. Recognizing this, the focus was directed to reconstructing the history of book productivity published by Universidad Icesi, which represents the main input for this study. This was achieved by following these five steps:
First, a database was built with complete information for a social network analysis of co-authorship relationships in scholarly books published by EUI8 from 2007 to 2021 (Table 1). This time window begins with the registration of the first collaborative book in 2007 and goes to the last year registered in its entirety, i.e., one year before the database was ready to carry out this study -between July and August 2022-. Each book entered in the database contains as many rows as the number of authors participating in it.
Table • 1 Dataset features and explanations
| Feature | Explanations |
|---|---|
| Title | Book title |
| Year | Book publishing year |
| Author | Author's full name |
| AD | Author's Academic Department (only for Univ. Icesi) |
| School | Author's School (only for Univ. Icesi) |
| Institution | Author's institutional affiliation |
| Gender | Author's gender (M/F) and N/A |
Source: created by the author.
Second, in this SNA, each node represents an author, and the edges are the co-authorship relation between them, which is extracted from the author list of edited books and monographs. In this sense, all authors present in a book configured so many edges as the volume of total combinations without repetition whenever a pair of them can be related.
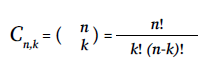
where n = total number of unique authors in a book, k = number of authors being chosen at a time. For this case, k is set on two because of the representation of each pairwise co-authors edge9. When a book is written just by one author, there is no co-authorship possible and therefore the number of edge combinations is 0. The first co-authorship edge occurs in books with two authors. Books written by three authors draw a three-edge network, a book with four authors gets six edges, with five authors the network would have 10 edges (Scott, 2017), and so on. In this study, the book with the greatest number of edges has one thousand and eighty-one edges appearing in a book with 47 authors.
Third, as this study focuses on co-author relationships, nodes with less than one co-author relationship (edge > 1) were removed. However, single-authored books are considered by the productivity indicator that impacts the size of each node representing an author in the network.
Fourth, the Academic Department (DA), and the School affiliation of authors were detailed only for members of Universidad Icesi. The institutional affiliations of all authors were entered, mostly assigned as shown in the author biographies in the books. In some cases, it was necessary to confirm, so having an institutional email was of great help in this matter, as well as having its own professional institutional website. If doubts still persisted, academic profiles were searched on social networks such as ResearchGate, Google Scholar, or ORCID to corroborate the institutional affiliation at the time the book was published.
Fifth, the gender of the authors was introduced manually. The identifications were oriented by the authors first name and were classified into female or male. For some cases, institutional and personal web pages were searched for gender confirmation10. Non-human authorships occur when research groups or centers contribute to the book as authors, in these cases, the classification by gender was established as not applicable (N/A). Unfortunately, non-binary or transgender classifications could not be entered into the database due to a lack of specific information that could help in this identification process.
Methods
This study applies the most common integrity and centrality measures that are meaningful for this social network analysis according to the collected dataset and the research objectives. They are used for quantitative analysis of complex networks and are calculated as follows:
Density is mathematically defined as:
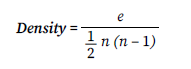
where 1/2 n (n - 1) equals the total of possible node pairs connected; n is the total nodes, and e the number of pair nodes connected (edges) in the graph. Diameter relates to the maximum eccentricity in a network:
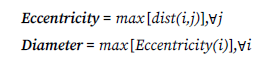
Eccentricity measures the distance of any node (i) with respect to the farthest one (j) linked to it directly or through others. The greatest distance between two nodes is the maximum eccentricity that is equal to the diameter of the entire network. The opposite extreme would be the radius of the graph, which is the minimum eccentricity (Hage; Harary, 1995).
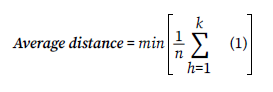
Average distance is given by:
Modularity (or module classes) applies the Louvain method for community detection based on a heuristic algorithm for a fast discovery of communities in large networks (Blondel; Guillaume; Lambiotte; Lefebvre, 2008).
Clustering coefficient measures is given by:
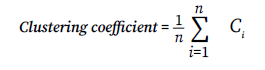
The clustering coefficient for the whole graph is the average of the local values Ci. It recalls the overall network density formula, but is only calculated on a subset of vertices, those whose neighbors are connected to one another (Hansen et al., 2020).
Degree Centrality is calculated as:
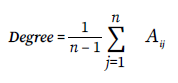
where A ij is the ij-th element of the adjacency matrix A of the graph, and n is the number of vertices in the graph.
Closeness Centrality mathematical algorithm is:
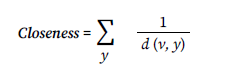
Where d (v, y) is the average distance of the shortest path length from the node to every other node in the network (Golbeck, 2013). If the sum of the distances is large, then the closeness is small and vice versa. Therefore, the inverse is used so that a higher closeness centrality indicates a more desirable centrality score (Hansen et al., 2020).
Betweenness Centrality is defined as:
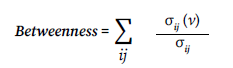
where σ ij . (v) is the number of shortest paths between nodes i and j passing through edge v, and σ ij , equals the total number of shortest paths between vertices i and j. Summarizing all pairs of vertices to get the interposition of each node, which becomes as high as central it becomes within a network (Hansen et al., 2020).
Eigenvector Centrality, mathematically written, gives the equation:
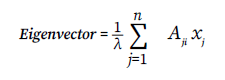
Where A ij , is the adjacency matrix, x i is the centrality score of the vertex i, and λ is the positive constant and largest eigenvalue associated with x (Rakaraddi; Pratama, 2021).
In this study, the Gephi Toolkit open-source software (Bastian; Heymann; Jacomy, 2009) is used to visualize the data as a network and to calculate the measures mentioned above. To get the co-authorship network graphs, ForceAtlas2 (Jacomy; Venturini; Heymann; Bastian, 2014) was used; it is a scale-free spati-alized network layout algorithm.
The co-authorship data input was structured in two Excel sheets, one with the node attributes and the other with all combinations of author pairs by the co-authored book. All interactions are set as undirected edges, which means that there are no hierarchical linkages nor a start and arrival point between a pair of nodes (Alonso-Cifuentes; Carabali, 2019). The network visualization responds to a not-weighted graph.
Analysis of results
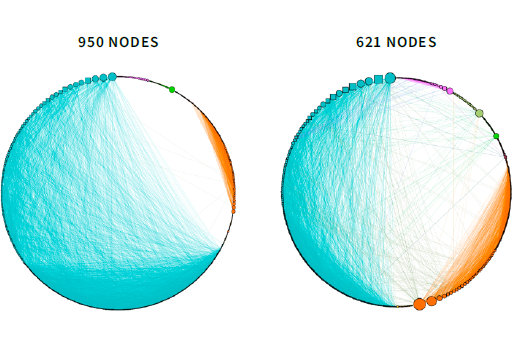
Reducing the nodes with less than 1 link, which represents 3.65 % of the overall network, the number of authors is reduced to 950 nodes, and the total number of linkages remains as 9656 co-authorship relations.
In this study, all authors included in a book build a completely connected network, which means that each author is linked to everyone else (Scott, 2017). Thus, each book represents a subgroup in the co-authorship network. If one author does not participate in a book, this will appear in the graph as an isolated subgroup, thus establishing a community by itself.
However, if an author is included in more than one book, and each one represents a different set of authors, this community will involve all the authors interconnected by book. The difference between communities depends on the density of each subgroup (Scott, 2017), and the linkages between authors with similar neighbors or closeness to the same central authors in that network.
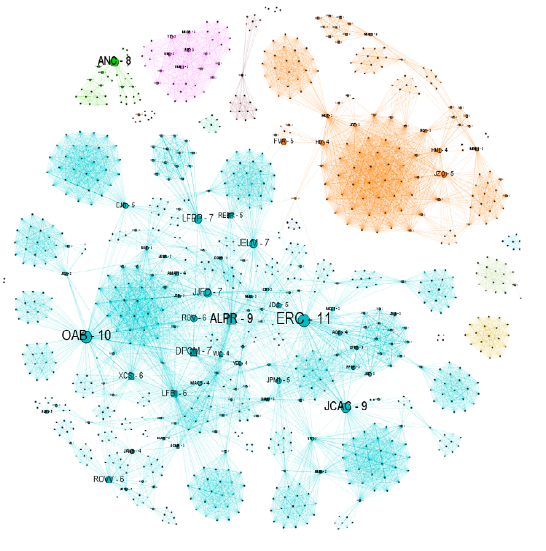
Figure 5 shows at least three types of communities. First, there are some isolated subgroups of authors participating in just one book published in the EUI. Second, there are also isolated communities involving more than one book11. Third, there are highly interconnected authors, some of whom take part in a large number of books.
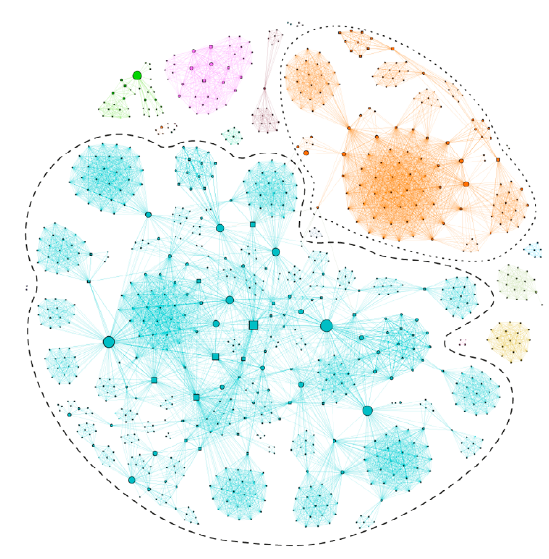
Node shapes: female (square), male (circle), and N/A (triangle). Node size: number of books published in the EUI.
Source: created by the author.
Figure • 5 Co-authorship Network A from published scholarly books (Overall: 950 nodes. Graph without labels12)
A quick scan of the graph indicates a very dense community that colors light blue almost two-thirds of the network (area surrounded by dashes), representing 65 % of all connections, and a second one with 16 % in orange (area surrounded by dots). This means that the other 19 %, approximately, constitute isolated communities in the co-authorship global network. The modularity algorithm detected 18 communities (see Table 4), two of them hold 81 % of the edges, and all the others are the isolated communities mentioned above.
Table • 2 Ranking of the first 15 co-authors by Centrality Measures (Network A)
Bold: author present in all 3 measures. Italic: author present in 1 measure. See the author's information in the appendix (Table 6).
Source: created by the author.
The first two communities correspond to authors of books on Social Science and Humanities (surrounded area). The first is represented by books whose authors produce new knowledge linked to research fields such as socioeconomics, urban and regional issues, political and government related themes, racial discrimination, and gender studies; while the second community is made up of books whose authors express themselves through essays, narratives, self-reflections, short stories, and other literary genres. This is not surprising, as mentioned in the introduction, since authors on SSH tend to prefer this type of academic product over publishing articles in scientific journals.
The closeness centrality measure is insensitive to the existence of isolated nodes within the network. This results in an overestimation of individuals with a high closeness value because they are isolated but in an interconnected subgroup. To avoid the noise it may generate, the closeness centrality measure is not included in Table 2, but it appears below (Network B), in which all nodes are connected to each other (see Figure 5).
Table 2 shows three estimations of the importance and influence of authors within Network A. Four different results can be highlighted here in terms of centrality. First, OAB is the only author in the top 5 of the three centrality measures. This author has the most interactions in the network, is an important bridge to connect different subsets of authors and is also surrounded by other important authors.
Second, four authors (ERC, LFBI, HK1 & JZO) are also among the first fifteen authors according to the rank in three centrality measures. On the one hand, ERC is the second most popular author in the network according to his number of interactions and the first author with the highest eigenvector centrality, which means that his influence is due to him participating in books with other important co-authors in the network. ERC and OAB are the most frequent authors in the EUI for the selected period of time, with 11 and 10 books, respectively.
On the other hand, LFBI ranks third in the degree centrality range but remains after the tenth in the other centrality measures. This could be because the popularity gained is not related to being surrounded by other key authors nor by serving as bridge between subsets of authors within the network. In other words, the relatively high number of interactions could be due to interactions with first-time authors on the EUI or by being co-author on a very low set of books.
Unlike the first three authors, who belong to the Social Sciences, HK1 & JZO are related to books on Humanities published by the EUI. These two authors take part in books related not so directly to academic disciplines rather to compilations of texts in different literary genres, from fiction to nonfiction works. But while both seem to be surrounded by other key authors on the second community, HK1 plays a role as intercommunicating different subsets of book authors within his community (see Figure 5).
Third, an author like JJFD, who is in the top 5 of degree and eigenvector centrality, is certainly a key author in the network due to the number of interactions and the good quality of his neighbors, even if he does not play a role in connecting a different subset of author groups.
Fourth, authors such as XCS, OEOG, LFBP, and MCC1 appear once on the centrality measures within the top 5. XCS in the degree of centrality, which relates to an author who is connected to a varied and significantly high number of authors. The other three authors stand out for their betweenness centrality, in which OEOG and LFBP occupy the first two places. This refers to authors being on the border between two or more network communities and their corresponding subgroup of book authors.
It is important to note that their position on the centrality measures does not correspond to the number of books in which those authors participate, but to the number of interactions of the books they are part of. For example, authors such as HK1 and JZO are relevant in the network, but they are not ranked in the first fifteen.
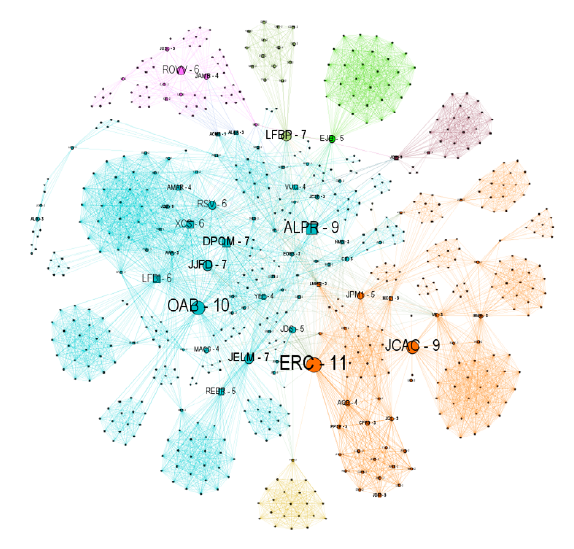
Regarding the first modularity class, which summarizes 62.8 % of the overall network (dashed area in Figure 5), the number of authors is reduced to 621 nodes, and the total number of linkages to 6488 co-authorship relations. Different from the above, Figure 6 is a fully connected network, which means that each node is reachable from any other node (Freeman, 1978). As mentioned, the authors and the content of the 76 books in Network B show a tendency towards topics from a wide range of Social Sciences fields.
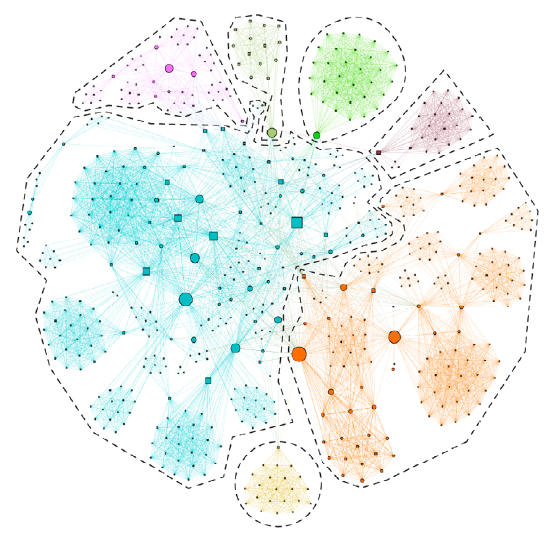
Node shapes: female (square), male (circle), and N/A (triangle). Node size: number of books published in the EUI.
Source: created by the author.
Figure • 6 Co-authorship Network B from published scholarly books (Overall: 621 nodes. Graph without labels13)
Table 3 incorporates the closeness centrality measure because all nodes are fully connected in Network B. Those authors are linked to each other through short path distances, thus high (low) values in this centrality measure point out to nodes with fewer (larger) messages; thus, intermediaries are needed to reach others. Therefore, the more central the node, the more independence and efficiency it gains, positioning it in a more strategic place in relation to other authors in this network (Freeman, 1978).
Table • 3 Ranking of the first 15 co-authors by Centrality Measures (Network B)
Bold: Author present in the 4 measures. Italic: Author present in just 1 measure. See author's information in the appendix (Table 6).
Source: created by the author.
As shown in Table 3, two authors remain in the top 5 and stay consistent through the four centrality measures. While OAB obtains the first place as the most central node in three of the measures (Degree, Closeness & Betweenness), ERC is right behind in the same three measures. The difference gets at the Eigenvector Centrality, where these two authors changed their position to first and third place, but remain close to each other.
In comparison to Network A, these two authors gain centrality, which means that they certainly play a key role in the production of scholarly books on Social Science fields at this University Press. This is confirmed because their participation is not limited to being authors in the books they have published at the EUI, but they also play a leading role as academic editors or compilers in many of them.
Two other authors, LFBI and XCS, are also present in the four columns but their positions vary depending on the measures. The first appears twice in the top 5, as also do JJFD, JELM, and ALPR. All of them represent an important set of authors, LFBI and JJFP because they are surrounded by many authors (Degree Centrality) -some of them are important for the entire network (Eigenvector Centrality)- and JELM and ALPR because they are frequently connected as co-authors (Closeness Centrality) and play key roles interconnecting different subgroups of authors.
A detailed approach to this description can be made by analyzing and comparing the integrity measures between networks A and B. First, it can be focused on the density that determines levels of connectivity in a network. Thus, the higher (lower) the density, the higher (lower) the integrity of the network (Baji et al., 2021).
The co-authorship Network A has a density value of 0.021 (see Table 4), which means that only 2 % of all possible connections appear on it. This is significantly far from what a fully connected network would be. The density value for Network B shows that it is more compacted, yet a value of 0.034 is still extremely close to null, which stands for a highly fragmented network.
Table • 4 Integrity Measures (IM) of co-authorship network
| Measure | Network A | Network B | |||
|---|---|---|---|---|---|
| Nodes | 950 | 621 | |||
| Edges | 9.656 | 6.488 | |||
| #Books | 121 | 76 | |||
| Density | 0,021 | 0,034 | |||
| Diameter | 11 | 7 | |||
| Radius | 1* | 4 | |||
| Averages Distance | 4,233 | 3,474 | |||
| Modularity | 0,498 | 0,651 | |||
| # Communities | 18 | 7 | |||
| Cluster Coefficient | 0,787 | 0,742 |
* This value responds to one isolated tree in the network formed by one book with two authors (see Figure 5). In this instance, radius is not an accurate network integrity measure.
Source: created by the author.
This can be easily observed in Figure 5 because Network A displays different sub-groups of nodes or components, many of them forming "isolated trees" (Scott, 2017). This occurs in cases where the authors are linked to each other in a non-cyclic way, i.e., to the presence of components in this network without any connection to others. Regarding Network B, Figure 6 shows nodes grouped by a peripheral and isolated position within the network14.
Moreover, the number of components on both networks tells a similar story. Network A clusters 18 communities, many of these components are represented as a kind of island within the network formed by an isolated sub-group of interconnected nodes. This may reflect the collaboration practice in some disciplines because some tend to be more insular and less interdisciplinary than others (Cruz-e-Silva; Ribas-Cavalieri, 2022). In Network B, clustered author communities are reduced to seven, which means that published book on Social Sciences fields relate to a more integrated group of authors.
The average distance is the average shortest distance between nodes. Thus, the larger (smaller) this value, the farther (closer) the nodes. Thus, there are opportunities of information exchange and interpersonal communication (Baji et al., 2021). In this study, the average distance in Network A is 4.233, indicating that the nodes are far enough apart to show a highly integrated network. In addition, the diameter of this network is 11, which is a high value, meaning that the communication flows among authors within the network tend to be relatively slow. In contrast, Network B corresponds to the more compact and integrated network trends. It has a value of 3.474 for average distances and a reduction in the network diameter. Thus, the maximum distance between two nodes is reached at seven edges, and the minimum stays at four (radius).
Conclusion
This pilot case study provided a Social Network Analysis (SNA) of the relations within scholarly books co-authorships at Editorial Universidad Icesi. The database summarizes key metadata of the collaborations network given by publishing monographs and edited books in this University Press from 2007 to 2021. After this calculation and analysis of Integrity and Centrality Measures, it was possible to describe the network structure, the interactions, and individual performance within.
The findings correspond to the research questions. The authors play an important social role within the co-authorship (RQ1), i.e., OAB and ERC in both Networks. These two authors were positioned among the five most central individuals, and they had better positions in Network B. As mentioned in the introduction, book editors were expected to play a key role not only for coordination of a single collaborative book, but for the entire social co-authorship network. This is the case of these two authors. The author LFBI, who also appears in both networks in all centrality measures, deserves a special mention.
The co-authorship network of the books published by the EUI is fragmented. The number of modules/communities between networks A and B (RQ2) varies due to different reasons. The first network yielded a graph with 18 communities, most of which were limited to output covered by a collaborative book or authors who publish frequently with the same set of co-authors. The second network focused on the densest community, which accounted for 65 % of the interactions, yielded a graph with seven communities. In this case, each community represents groups of authors who are connected to others, usually they are disciplinarily related or share common interests, so that their research agendas intersect on some topics that allow them to participate as authors in a book project. This reduction could also be understood in the collaboration patterns of disciplines related to the books, because while the first network involved different collegiate disciplines (medicine, engineering, and humanities), the second was mostly represented by Social Sciences.
Addressing individuals in the network -who not only bring together different authors but also connect different subgroups, thus breaking the boundaries of community (RQ3)- a few nodes can be highlighted.
In the case of Network A, the greater betweenness centrality refers to OEOG and LFBP as authors playing an important role as bridges. For example, the former is one of the nodes that makes the first two dense communities interact. In Network B, author OAB obtains the first position, going up from the third position in Network A. Most important, he is the only individual who remains in the top positions in both networks. In Network B, ERC gains importance as the author who brings together at least three communities but is still behind OAB.
A last conclusion from a gender perspective, among the top 15 authors for at least one of the centrality measures, five authors (LFBI, XCS, DPQM, ALPR and MCC1) are positioned in the A and B networks. While LFBI is present in all centrality measures for both networks, XCS does it only in the second network. Network B has a total of 12 women authors in this frame of measures, 4 more authors than Network A, and seven of them were not present before. At this point, the presence of women at these high levels continues to be low, despite their participation has been consolidating in a range between the 40 and 48 % of the total number of authors published annually in the last 5 years (EUI, 2019).
Two recommendations can be drawn up: One addressed to the University Presses and the other directly the woman authors: first, always seek to increase the participation of women authors, especially in books by several authors, but also as book editors and peer reviewers; second, try to build a set of few but consistent co-authors, beyond their capacity to establish new collaborations.
Limitations and future research
The findings presented in this article are based on an exploratory pilot case study, which is unlikely to be free of limitations. Even though publishing books is a frequent way to share knowledge, it is not the only measure of research productivity because of differences in discipline productivity patterns. Moreover, taking the co-authorship network of one University Press implies comparison limitations with other scholarly book publishers. Nevertheless, this exploratory study shows interesting results that can be taken as a starting point for subsequent research.
Still, results are compelling in at least three senses. First, the co-authorship network in scholarly production shows different patterns of collaboration regarding books in contrast to the traditional article analysis. Second, books are not just to be read for their content, they contain information like metadata, which also needs to be read because they allow bibliometric analysis. Being aware of it improves editorial decisions making processes, the value perceptions of the editorial house, and the professionalization of the editor labor. Finally, yet importantly, performing a step-by-step methodological demonstration with these results might become a model that could be replicated by other publishers.
Future research is needed to confirm its wider applicability, as well as to dig into some areas to understand its complexity. To achieve that, this methodology procedure should be replicated for a wider and broader sample, considering not only university press cases but also other scholarly book publishers. Additionally, it might focus on getting a precise point regarding the collaboration and co-authorship network within a regional or nationwide research area, thus increasing the possibilities for international comparison.
Future studies should go beyond by focusing on what has been produced and study the effects of the publication of scholarly books. This could include an analysis of downloads, readings, and citations, as well as other types of impacts such as web positioning, or more socially relevant ones such as alternative metrics through mentions in social networks, academic blogs, book reviews, or press.