


 text in
  English (pdf)
 Article in xml format
 Article references
 Send this article by e-mail
 Cited by SciELO
  Cited by Google
  Similars in
SciELO
Similars in
SciELO  Similars in Google
 Permalink
Introduction
The concept of triage was initially created as a method of classifying patients requiring immediate management in critical moments (e.g., war camps), when its usefulness was to prioritize their care (1). Since the beginning of the 20th century, the rapid growth of emergency systems has led to the development of different triage models in the United States, United Kingdom and Europe (2,3).
The literature on the subject documents the first medical triage in an emergency room at New Haven Hospital (Yale University) in 1963, whose objective was the prioritization of patients to access health services (4). At present, triage systems stand out in three phases: an initial prehospital phase (management of prehospital resources and ambulances), a second phase at the scene (first contact doctors), and a third phase upon admission to the emergency room (3).
There are tools to prioritize the care of patients when they are admitted to the emergency room that have shown an association with readmission, mortality and admission to the intensive care unit (2,3,5). Among the best known are the Australian Triage Scale [ATS]), the Canadian Emergency Department Triage and Acuity Scale [CTAS]), the Manchester Triage System [MTS]), the Emergency Severity Index [ESI] and the Simplified Acute Physiology Score (SAPS II) (6).
Triage scales have methodological limitations and each has been developed in a local population where heterogeneity among multiple systems means that there is no universal consensus or formalized parameters (7). In addition, the diversity and complexity of each institution makes it difficult to always have a correct classification and, therefore, there is no gold standard to measure its accuracy (3,8).
For eight years, the Hospital Universitario San Ignacio (HUSI) has been using a triage system of five levels, based on the recommendation of experts. It is carried out by a trained nurse, who takes into account vital signs, reason for consultation, background, age and gender. Once one of the five levels has been granted, the patient is referred for medical evaluation and care times are established according to their category.
Although this triage identifies patients according to five levels, there may be complementary mechanisms that help to improve the selection of patients with higher risk that are in the same classification level, a situation that may occur more frequently in tertiary care hospitals with a high consultation volume. No predictive models were found in the literature to identify these patients, nor were there proposals for new models that would allow this to be done. Here, we propose such a predictive model with variables found in the triage system used in a tertiary care hospital in Bogota, Colombia.
Methods
A prospective cohort study was carried out of adult patients admitted to the emergency room of HUSI in Bogota between March 2018 and February 2019. Patients referred or discharged without completing medical care within 24 hours of admission were excluded, for a total of 6438 patients. The Institutional Research Committee approved the study.
The head nurse triaged the study population according to the institutional protocol. The variables collected were taken from both the triage and the institutional electronic medical record, with the help of REDCap software, version 9.1.18 (9). R software, version 3.5.1 was used for the analysis. (10).
The median was used for demographic variables; the interquartile range (IQR) for continuous variables, and relative and absolute frequencies for categorical variables and missing data count. Data from the total patient population were randomly divided into training (70%) and test (30%). Statistical models were fitted to the training data and the performance of these models was evaluated on the test data. Missing data were omitted without imputation.
Initially, triage was analyzed as an ordinal variable, and the combination of the variables triage 4 and triage 5 was proposed as the base category in the model, due to the few deaths that occurred in these two categories.
The data were also analyzed as a single and multivariate variable, using a bivariate logistic regression between triage and mortality. Subsequently, multivariate logistic regression was run with predictors —gender, age, sex, systolic blood pressure (SBP) and diastolic blood pressure (DBP) measured in millimeters of mercury (mmHg), heart rate (in beats per minute), respiratory rate (in breaths per minute), arterial oxygen saturation (SaO₂), Norton scale, hospital stay, and adverse events—. The likelihood ratio test was then performed to reduce the model. Significant interactions were added to the reduced model to improve its performance (age, SBP, reasons for consultation). Finally, two models were made, consisting of a reduced model, composed of the significant variables, and another model, removing the reasons for consultation.
In the test data, areas under the curve (ROC) were calculated to choose the best model from the three previous ones and select the best cutoff point. Its performance was evaluated by sensitivity, specificity, positive predictive value (PPV) and negative predictive value (NPV).
Subsequently, a decision tree based on the significant data was proposed in order to obtain cut-off points for clinical decision making complementary to triage. In addition, three possible decision tree models CART, CHAID and Conditional Tree were proposed. (11).
Results
Table 1 shows the demographic characteristics of the study data. There was no significant difference between the death and survival groups in terms of the proportion of men and women who consulted the HUSI during the established time.
Table 1 Variables used in HUSI triage for patient classification and demographic characteristics obtained through the medical record.
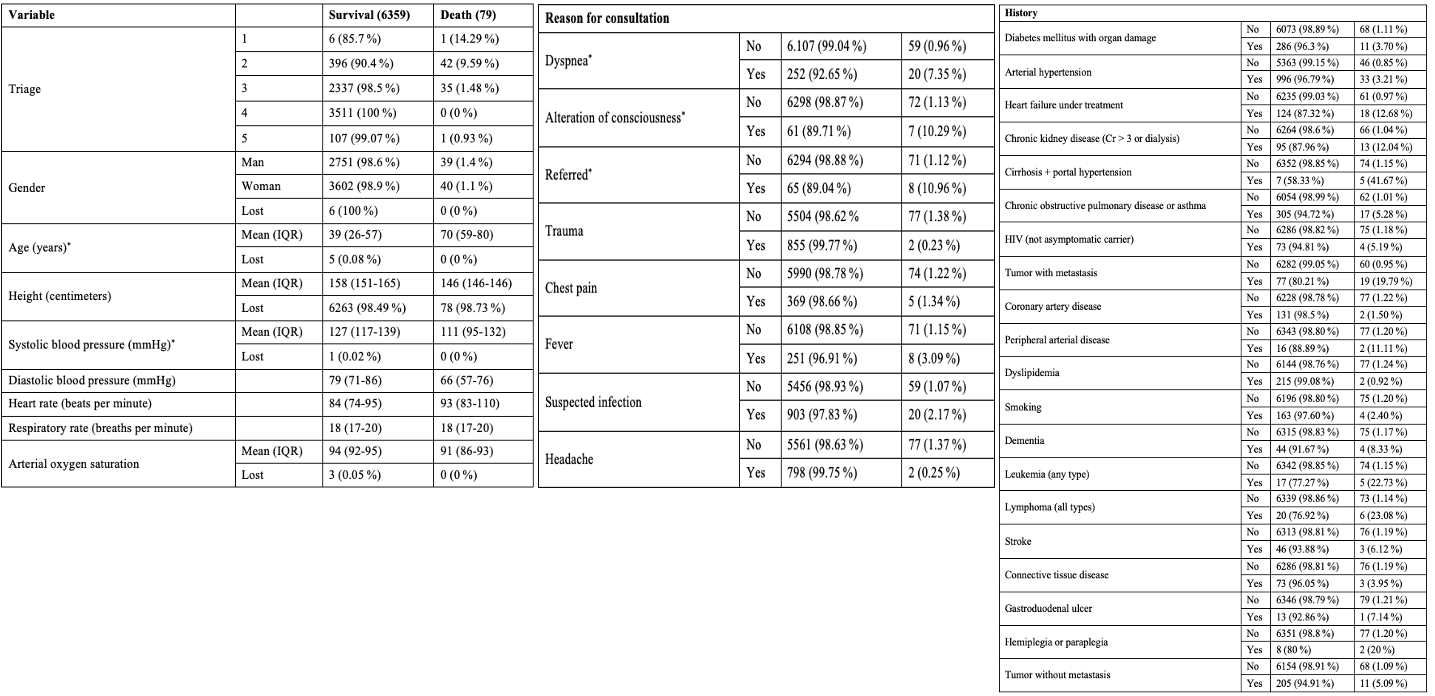
* Statistical significanceIRQ: interquartile range; mmHg: millimeters of mercury.
The variables analyzed that showed a significant difference were: age measured in IQR (59-80 for death), SBP (IQR: 95-132) and Reasons for consultation: dyspnea, altered mental status and referral. These variables were used to develop the logistic regression models.
The remainder of Table 1 shows the HUSI triage components, composed of the remaining hemodynamic variables (heart rate, respiratory rate, DBP, and SaO2). Other reasons for consultation and patient history were not statistically significant, so they were not proposed for inclusion in the model, although the Mortality group had higher heart and respiratory rates, lower DBP, and a higher frequency of history of heart failure, chronic kidney disease, severe liver failure, and metastatic neoplasia, compared to the Survival group.
Finally, regarding triage, it was observed that patients classified as 1-2 had higher mortality vs. patients classified as 3, 4 or 5. This shows a direct relationship between the level of triage and mortality.
Predictive models
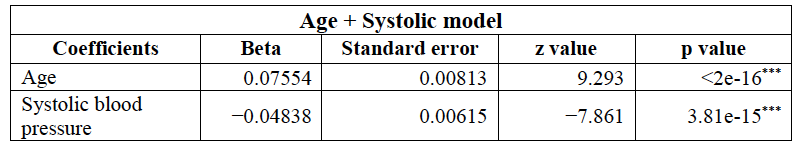
A univariate model is proposed with continuous triage, which had an ROC of 0.82, which is the cut-off point for comparison with other models. Subsequently, two multivariate models were run, consisting of the variables for which significance was found (reasons for consultation, age, and systolic blood pressure). One model was composed of all of them, called the reduced model (Table 2), and in the other model, called Age + SBP, the different reasons for consultation were removed, given the great heterogeneity and segregation of each factor (Table 3).
Table 2 Coefficients that make up the proposed reduced model with each of its characteristics (beta, standard error and z and p values)
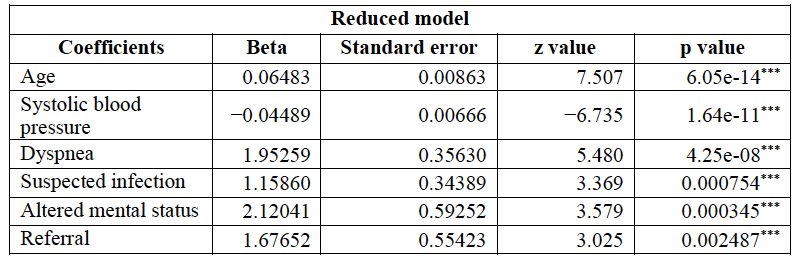
Table 3 Coefficients that make up the Age + Systolic model, proposed with each of its characteristics (beta, standard error and z and p values).
ROCs were performed for the univariate triage model and for the two models proposed for the generation of alerts in patients with the same triage level. We found that the ROC of triage is 0.82, the ROC of the reduced model is 0.90, and the ROC of the Age + SBP model is 0.87, as can be seen in Figure 1.
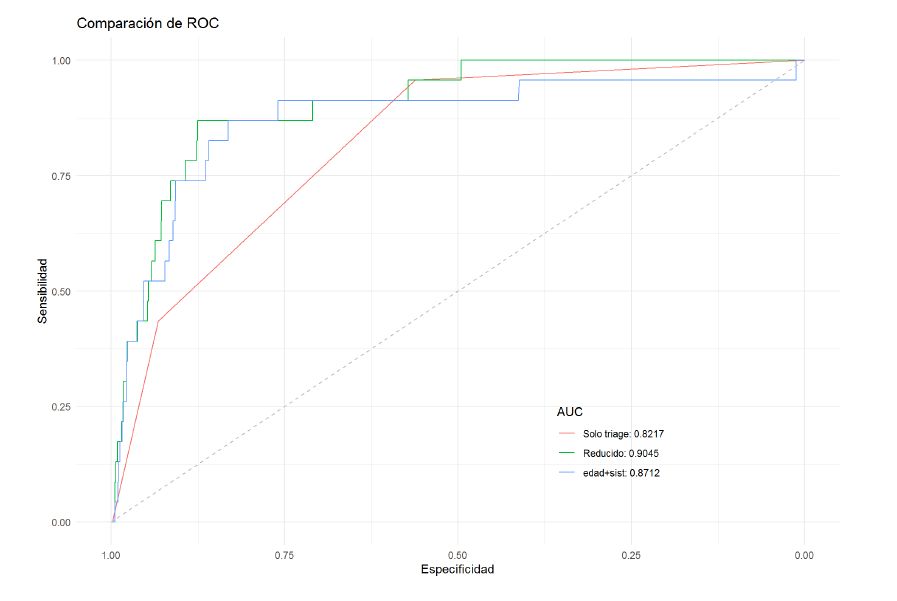
Figure 1 Areas under the curve of institutional triage and the different models proposed (triage only, reduced model and Age + SBP model).
When performing Delong tests between the models, no significant difference is evident between the reduced model (12) and the Age + SBP model, so either of these could be used, with the objective of prioritizing a patient in the same triage level.
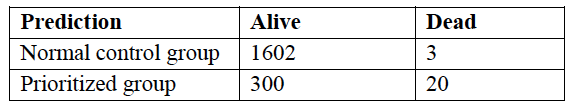
With the confusion matrix of the reduced model (Table 4) and the test data, which consisted of a total of 1925 patients, it was observed that it was possible to prioritize 16.6% of the patients by applying the model (320). In addition, the following operating characteristics were obtained: sensitivity of 0.869, specificity of 0.842, PPV of 0.066 and NPV of 0.998.
Based on the data found and the evidence that the Age + SBP model could generate alerts for the prioritization of patients with the same level of categorization, a decision tree was considered, to obtain cut-off points for possible use in clinical practice using the CHAID model. Table 5 shows the characteristics of the data model used for the decision tree. The age ranges and SBPs were divided into four groups, each with an equivalent number of patients, to allow comparison.
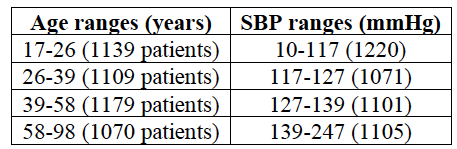
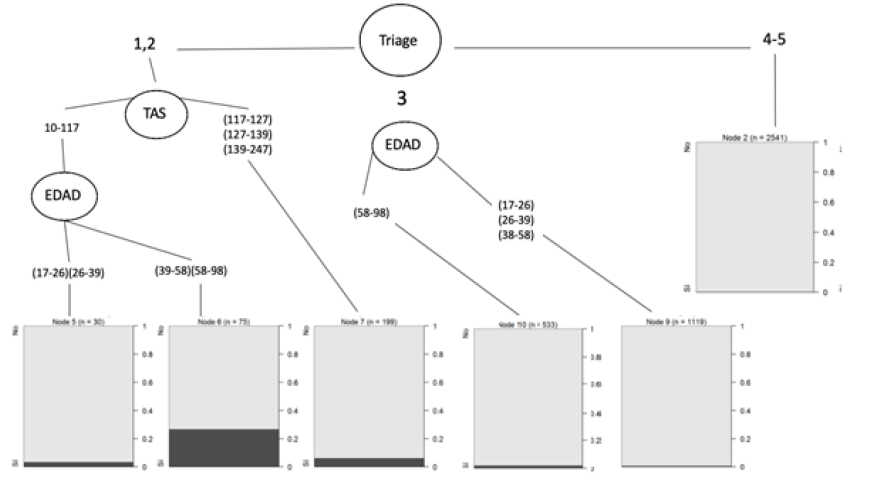
Figure 2 shows the proposed decision tree. The figure demonstrates how in triages 1-2, a cut-off point was found for the SBP of 117 and for an age of 58 years; while for triage 3, a decision cut-off point was found for an age of 58 years.
Discussion
The classification of patients in the emergency room is vital, since it can influence their morbidity and mortality. In a health care institution, triage is the area in charge of classifying the priority of care with the help of a suitable method to achieve a reduction in negative outcomes, speeding up processes and avoiding overload (6,8). Multiple classification scales have been proposed worldwide, among which the ATS, CTAS, MTS, ESI and SAPS II stand out (6).
To date, there is no reference standard for measuring the accuracy of triage, and none of these models have been shown to be superior to any other, since their use depends on the region and institution where they were proposed or adopted. (13-15).
When analyzing the mortality group, we found that triage categorization is related to mortality. A decrease in the percentage of deaths is associated with an increase in the level of categorization (triage 1 with 14.29% of deaths, triage 2 with 9.59% of deaths and triage 3 with 1.48% of deaths).
Although our triage model shows a correlation with mortality, the comparison by ROC is not direct with other currently used triage models. Multiple studies have analyzed the relationship between the classification level of a triage scale and hospital admission. When looking for the relationship between triage and mortality we found a study by Van der Wulp et al. (16), published in Emergency Medicine Journal, which documents that 82.1% of patients (from a cohort of more than 35,000 patients) who died were classified as category 1 in ESI, and 75.9% of patients who died were classified as a red category in MTS (16).
When comparing mortality by triage level, a similarity was found between the ATS, ECTAS and MEETS scales and the findings of the triage performed at HUSI, with the highest mortality for triage 1 (ATS: 12 %; ECTAS: 22 %; MEETS: 14 %; HUSI: 14 %). For triage 2, similar mortality was observed among scales (ATS: 5 %; ECTAS: 6 %; MEETS: 2.1 %; HUSI: 9.59 %) (17).
The ATS and MTS scales have been reviewed on multiple occasions and it has been found that in ATS about 18% and in MTS about 15% of patients were classified in categories II or III, which would imply a possible negative impact on the outcomes of critically ill patients (18,19).
Our data show that of 79 patients who died, 54.4 % were classified as triage 1-2, although the number of patients analyzed was lower than in the studies cited in previous paragraphs, where mortality is compared with different classification scales. Likewise, we found that 44% of the deaths were classified as triage 3; while on scales such as the ESI or the MTS, 7.1% and 3.4% are documented, respectively (16). This leads us to ask whether there is a possibility of under-triage, as suggested in other scales (20), or if the characteristics of the patients admitted to the HUSI had an effect, as participants for the study corresponded to 40 deaths of patients with oncologic pathology.
This study reveals the discriminatory power of the proposed models with an ROC of 0.90 for the reduced model, and 0.87 for the Age + SBP model to predict in-hospital mortality of patients admitted to the emergency room of a university hospital for a medical or surgical condition. This measure is much better than the 0.82 for triage alone, and could be useful to generate additional alerts to classification in equivalent levels, allowing for improved patient admission prioritization.
If we analyze the proposed models, we find a significant difference between the reduced model vs. the Age + SBP model. This finding could be interpreted to recommend the use of generating alarms in patients with important characteristics of higher age and greater SBP involvement with the same level of triage.
When analyzing the different scales by the GRADE method, no strong evidence is found for the standardization of criteria among them. What is more striking is that the ability to include individual hemodynamic variables to predict outcomes has not been extensively studied (17).
Considering a possible clinical implementation, it was decided to perform a decision tree with the data from the Age + SBP model. Cut-off points were found as prioritization characteristics among these groups: for the combined group of triage 1-2--an SBP less than 117 mmHg and an age greater than 39 years--, and in triage 3 an age greater than 58 years. It should be considered that with a larger population. these cut-off points could vary.
As limitations, we found that the data in the HUSI triage have wide segregation, mainly in the variables Reason for consultation and History, which are presented as multiple pathologies and concepts that could be organized into coherent groups for further analysis. Despite verifying the way in which the data were collected, there could be biases secondary to human error, a situation that we tried to avoid with a subsequent double data-by-data review after obtaining all the data.
In the future, the model proposed could serve as a basis for more complex models involving the use of techniques such as Machine Learning or Deep Learning, which may have a better predictive performance than logistic regression.
Considering the above, we propose to apply the statistical model for feasibility and prospective studies, and implementation of this model in the emergency room to help in the early detection of patients with increased mortality probability.

