


Services on Demand
Journal
Article
 English (pdf)
 Article in xml format
 Article references
 Send this article by e-mail
Indicators
-
 Cited by SciELO
 -
 Access statistics
Related links
-
 Cited by Google
 -
 Similars in
SciELO
Similars in
SciELO -
 Similars in Google
Share

 Permalink
International Journal of Psychological Research
Print version ISSN 2011-2084
int.j.psychol.res. vol.6 no.1 Medellín Jan./June 2013
Role of personality traits in the adjustment to diversity
El papel de los rasgos de personalidad en la adaptación a la diversidad
Syed Shameem Ejaz*,a, Anjum Araa
a Department of Psychology, University of Karachi, Pakistan
* Syed Shameem Ejaz, Assistant Professor, Department of Psychology, University of Karachi, Karachi-75270 Pakistan, Cell: (+92)323-2242790, Email: psychology@uok.edu.pk
Received: Febrero 23 de 2012 - Revised: Agosto 15 de 2012 - Accepted: Abril 15 de 2013
ABSTRACT
This article discusses the 'Scale for the Assessment of Adjustment to Diversity (SAAD)'.The scale measures the individual's adjustment levels to diverse situations. Adjusting to diverse situations requires extra efforts by individuals, sometimes these efforts fall short and the situation remains invincible. We assumed that there are personality traits (BITPC)1 responsible for success or failure in the adjustment to diverse situations. This five-factor model was evaluated in five diverse (SOGER)2 situations. A CFA, run on the results obtained from 444 (n) individuals, reveals a not converging five-factor model. However, after running CFA - (Confirmatory Factor Analysis) for all possible permutations the BIP - (Broadmindedness, Insight, and Patience), a 3 factor model was found to be the best fit on cutoff points when two top ranked situations were taken into consideration.
Key Words: Personality assessment, traits, diversity, adjustment potential.
RESUMEN
Este artículo discute la 'Escala de Evaluación de la Adaptación a la Diversidad (SAAD)'. La escala mide los niveles de ajuste del individuo a diversas situaciones. La adaptación a diversas situaciones requiere de esfuerzos adicionales por parte de individuos, a veces estos esfuerzos se quedan cortos, y la situación sigue siendo invencible. Asumimos que hay rasgos de la personalidad (BITPC) responsables del éxito o el fracaso en la adaptación a diversas situaciones. Este modelo de cinco factores se evaluó en cinco diversos (Soger) situaciones. Un Comité de Libertad Sindical, se ejecutan en los resultados obtenidos a partir de 444 (n) los individuos, no revela una convergencia de modelo de cinco factores. Sin embargo, después de ejecutar CFA para todas las permutaciones posibles del BIP - (amplitud de miras, Insight, y la paciencia), un modelo de factor 3 se encontró que era el mejor ajuste en los puntos de corte en dos situaciones con la clasificación más se tuvieron en cuenta.
Palabras Clave: Evaluación de la personalidad, los rasgos, la diversidad, el potencial de ajuste.
1. INTRODUCTION
We rub elbows every day with people whose religious and political beliefs differ from our own, people of different nationalities and cultures, people from different racial or ethnic groups, who may speak languages we do not know, people who have their own cuisines, their own music, and their own modes of dress. In addition, if we do not literally encounter such a range of people every day, we read about them, we hear about them, we watch them on television and develop harmony with them. Adjustment to the environment especially when it is as diversified as ours is requires efforts by an individual to try to understand it patiently, to accept it and start loving it, so that s/he can be more composed in demanding situations. Psychosocial conditions predict what patterns or characteristics a person is going to adapt to adjust into an environment. Personality traits flourishing in a particular social environment provide scripts to individuals for an attempt to adjust. If this script was not written cautiously and lacks in some important aspects, maladjustment will result. Individual with such a script suffers from psychological ailments (disorders) or if an anti-social personality was produced, society pays the toll. Researchers are studying personality traits, from early years, to develop an understanding what traits are important to describe a personality and how these traits help constitute personal strategy to adjust to numerous diverse situations. C. G. Jung (1921-71) provided his personality type theory explaining four basic types. Myers-Briggs as appeared in Quenk (2009), presented MBTI utilizing the type theory and developed a system to establish sixteen sets by combining different personality traits. Raymond. and Mary (1977) and Raymond (1979) have studied psychological and social adjustment in immigrants from Pakistan and India to Britain. Matsumoto, Nakagawal and Estrada (2001) has studied to answer the question 'are cultural differences in emotion regulation mediated by personality traits?' The resultant scale ICAPS (Intercultural Adjustment Potential Scale) is now available on the internet for people and is being used as a data-gathering instrument for cross cultural survey research.
In 2003, Padilla and Perez presented their model of acculturation built upon social cognition, cultural competence, social identity, and social stigma. They argue that acculturation is more difficult for those who have to face stigma in shape of ethnicity, color of skin, or language. Similarly, Freeman and Lindsay (2011) explored the adjustment potential of expatriate mangers in ethnically diverse environments and found that people who have the "ability to change and adapt adjust well." Miller (2007) suggests that understanding acculturation enhances when multidimensional measures are used especially, in the context of values and behaviors.
Defining Diversity: According to Webster's dictionary, diversity is defined as 'a state of difference, dissimilitude, and unlikeness.' Encarta, dictionary by Microsoft defines diversity as 'a variety of something such as opinion, gender, socioeconomic and ethnic variety.' Wikipedia, the online encyclopedia explains diversity as, multiculturalism; the ideology of including people of diverse cultural and religious backgrounds. There are several dimensions of diversity, researchers have been studying from 1887 (PsychINFO). Guion (1991) defines diversity as "a mosaic of people who bring a variety of ethnic and cultural backgrounds, styles, perspectives, values and beliefs as assets to the groups and organizations with which they interact."
According to Loden and Rosener (1991) the primary forms of diversity include; age, ethnicity, gender, physical abilities/qualities, race, and sexual/affection orientation. There is another form of diversity that is not as readily observable as most of these examples, but possesses implications just as profound as our more common conceptions of diversity. This additional form of diversity is psychological diversity that is related to the different ways of information organizing and processing acquired by people (Puccio, 1999), or it can be said as the difference in the way of thinking. Psychological diversity is hard to identify immediately as is the case with gender, age, and race, however, it influences the behavior of people.
Developing the SAAD Model: We observe diversity all around us. It is in all organisms, living or seemingly non-living. We behave differently with all plausible diversities, as we give Doves a different place than Pigeons, although they are quite similar in almost all aspects. Our behavior, if we observe, changes with a slight change in situation or stimulus according to our unique personality structures. It does not mean that we acquire a different set of characteristics on every next occurrence of the same situation rather we show same behavior patterns whenever the similar situation arises but our behavior may be different from others who are in the same situation. We have our own and unique way of looking into life and display, more or less, the same patterns throughout our lives in our problem-solving attitude.
The uniqueness in interpreting our surroundings develops the social collage. Scientists attempt to understand the coping and adjustment process by deducing the personal factors (traits) that influence coping and adjustment, and try to find specific factors (traits) responsible for a better adjustment. Kammeyer-Mueller and Judge (2009) in an attempt to understand the role of individual factors came up with a meta-analytic review that suggests that core self-evaluations help in adjustment process with "fewer perceived stressors, lower strain, less avoidance coping and more problem solving coping, and not related to emotion focused coping." Crisp and Turner (2011) believe that people who "cognitively adapt to the experience of social and cultural diversity" show better adjustment. Matsumoto et al. (2009) reported, "differences on depression, anxiety, optimism versus pessimism, well-being, and self-esteem are mediated by dispositional traits." Peltokorpia (2008) found that "personality traits (social initiative, emotional stability, cultural empathy, flexibility, and open-mindedness)…and cultural empathy" show a positive impact on adjustment. Yakunina, Weigold, Hercegovac and Elsayed, (2011) studying international students' openness to diversity found that "students who were more open-minded, flexible, and empathic also demonstrated greater openness to diversity, which in turn led to better adjustment." Ramalu, Rose, Uli and Samy (2010) investigated the relationship among Big Five traits and cross-cultural adjustment and found that people high on agreeableness, openness to experience, and extraversion show better adjustment.
Scale for the Assessment of Adjustment to Diversity (SAAD) is a similar attempt to understand this social collage. SAAD evaluates individuals in situations (SOGER) that are presumed as unfolding diversity and capture the tendency of using presumed characteristics/traits (BITPC) seem legitimate to be applied to adjust into that particular diverse situation. It is not limited only to cultural diversity and adjustment as most of the scales on the concept of diversity are. It takes into account the domestic diversity and the social situations that are the most common occurrences in day-to-day social interactions.
SAAD is a five-factor model assessing the adjustment potential of an individual in diverse situations within the same cultural setup. According to Loden and Rosener (1991) the primary forms of diversity include; age, ethnicity, gender, physical abilities/qualities, race, and sexual/affection orientation. There is another form of diversity that is not as readily observable as most of these examples, but possesses implications just as profound as our more common conceptions of diversity. This additional form of diversity is psychological diversity that relates to differences in the way people organize and process information (Puccio, 1999). SAAD takes five distinctive situations that are considered most common forms of diversity in contemporary social setups and we call it SOGER. Each of the situations is supposed to be one factor that influences our sensations and perceptions, feelings, behavior, mental and physical health, and resultant social adjustment difficulties.
The hierarchy of situations and traits appear above is just to make the terms easy to pronounce. This arrangement has no significance according to importance (or to any other connotation) of the situation.
2. METHOD
This research was conducted to develop a scale to measure individuals' quality of adjustment in situations having SOGER (socioeconomic, opinion, gender, ethnic, religious) diversity. Diversity places extra stress on an individual to be adjusted into the situation. In social interactions, people put extra effort in handling the situation well. In such an effort, they utilize some favorable traits to the extent they do not use in domestic or familiar situations (Carver, Scheier & Weintraub, 1989). Especially, in diverse situations they need more control over their emotional expressions thus utilizing their traits to the optimum level.
Understanding that the primary forms of diversity include: age, ethnicity, gender, physical abilities/qualities, race, and sexual/affection orientation (Loden & Rosener 1991), the term SOGER (socioeconomic, opinion, gender, ethnic, religious) was coined for diverse situations. Similarly, it was assumed, after learning through extensive review of the literature, that BITPC (broadmindedness, insight, tenderheartedness, patience, composure) are the traits people like to exercise more in social situations (especially diverse situations).
2.1. The Participants
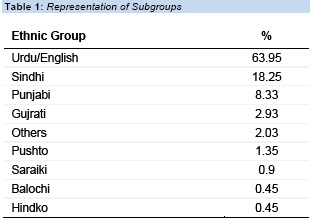
Apropos the tone of the study, a sample has to be drawn from every sub-cultures, ethnic groups and religious sects living in the metropolitan of Karachi. However, it was the toughest job to draw such a sample in our scenario because of segregation based on ethnicity and sectarianism. It was even more difficult in the presence of Taliban terror because people were scared to come out and discuss freely about their sects.
Similarly, Karachi is passing through ethnic violence for last 25 years. It could have been fatal for the study to ask people about their ethnicity or about their mother tongue. We had included a milder version of this questions as "what is your household language" expecting some reasonable information about the ethnicity. Nevertheless, this question never got an appropriate answer because people speak mostly Urdu in Karachi no matter which ethnic group they belong. However, it was in vain and ethnicity factor was never included in analyses.
A sample of 690 was attempted, however, only 444 interviews were materialized. The participants were presented a consent form with a description and purposes of the study. The participants had to sign it if they were willing to participate in the research. We have people from different environments, public organizations like Steel Mill of Pakistan, others as Ciba-Geigy, Chamber of Commerce and Trade, different private organizations and NGOs (non-governmental organizations - these organizations serve the communities to resolve specific issues by raising funds, they cannot generate money by selling their tangible or intangible products i.e., commodities or services) etcetera were visited and people were asked to participate in the study for a proportionate representation of each stratum. Selecting these organizations for taking the participants of the study helped us to keep certain variables under control such as education (graduates=52%, masters=40%, others=8%), and these were the people who really face the diversity otherwise in a domestic environment one may never face some type of diversity for instance the ethnic diversity. Sample reflects near actual representation of females (16%) in the corporate arena in the city. Three more samples were drawn, one (n=48) for validation purpose, one (n=38) for reliability determination of translated versions of validating scales in local language i.e., Urdu [multiple translators from departments of Urdu and English were requested to translate and back-translate the scales], and one (n=33) for testing temporal stability. These three samples were drawn from Karachi University student population.
2.2. Procedure
1. Construction of a five factor model to be tested in five different situations.
According to suggested traits and diversities by literature a working model has to be evolved that can evaluate a person and produce a relative position of her or his status on adjustment to situations having prominent diversities. Initially, five traits were selected that represent adjustment of an individual in diverse situations those are, [B]roadmindedness, [I]nsight, [T]enderheartedness, [P]atience, and [C]omposure.
Similarly, five diverse situations were selected as [S]ocieconomic diversity, [O]pinion diversity, [G]ender diversity, [E]thnic diversity, and [R]eligious diversity.
2. Writing and validating items.
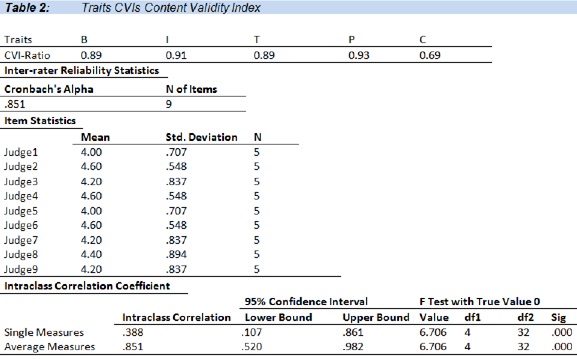
Traits and situations were sent to nine (9) judges to evaluate and rank each trait according to its importance in adjustment. These judges were professors and associate professors of psychology, sociology, and social work. This was done by taking whole five traits as 100% and a judge had to assign certain percentage to each trait keeping within the bounds of 100. Judges were also requested to evaluate and rank the situations and statements representing each trait. They had to evaluate the situations for establishing diversity and statements if they were representative of the traits by selecting 1 if the statement was not representative, 2 if the statement needed major revision, 3 if the statement needed minor revision, and 4 if the statement was representative. Judges were university teachers (2 professors, 3 associate professors, and 4 assistant professors) from psychology and sociology departments. One of the judges was flying abroad and had not time to complete the task. So, traits were judged by 9 and scenarios and statements by 8 judges. The data (from judges) was evaluated for the Content Validity Index (CVI), the process described by Lynn (1986) and Grant and Davis (1997), CVI was used to evaluate item consistency (I-CVIs - Item-level CVIs) among the judges (experts) ratings for trait relevancy, statements representativeness for specific traits, and item appropriateness for the situations. We used those items for which all the judges were agreeing. After minor and major revisions those traits, situations, and statements were chosen to be included who had a CVI above 0.6. This activity provided us with situations representing diversity, traits assumingly representative of adjustment to diversity, and five groups of four statements each representing each trait.
A respondent had two things to do while in SAAD testing session. First, one had to sort five diverse situations according to difficulty levels of her or his own. The situation is considered difficult 'if for a person it demands her or his full potential to be utilized to be adjusted to the situation, would make one uneasy'. For the initial administration of the instrument, it was decided to take only top two situations for a person to advance to second stage of the test. In stage two, respondent had to focus on the top ranked situation and read 20 statements and select the most suitable statement in that particular situation. Once the activity was completed with 1st ranked situation the respondent had to move on to the 2nd ranked situation and read the same statements again in the context of that particular situation and select the most appropriate statement for her or him from each block of statements. This had produced 10 resulting scores for a person.
3. Testing items for clarity of concept and language.
The instrument was tested, for comprehension the concept of diversity, understanding of situations, and clarity of statements, on 20 conveniently selected individuals. This enabled us to fine-tune the instructions, statements by simplifying the language and rephrasing description of scenarios and of statements. Instrument was fine-tuned and ready to be administered initially on a sample of 71.
3. RESULTS
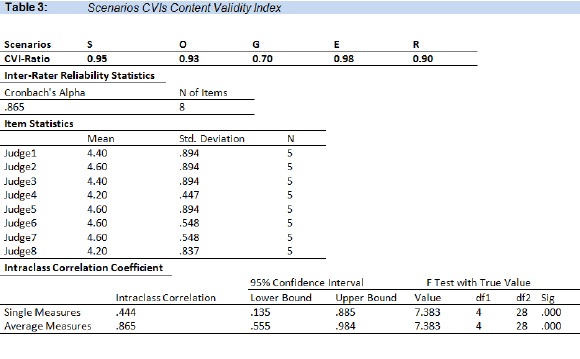
CVI calculations are provided in Table-2 and Table-3. Among the traits Broadmindedness has a CVI of 0.89, Insight has 0.91, Tenderheartedness has 0.89, Patience has 0.93, and Composure has CVI of 0.69 (table-2). The inter-rater reliability for traits among 9 judges is 0.85 (table-2). A computation of intra-class coefficient shows a significantly high reliability of 0.85 with interval of 0.52 to 0.98 with 95% confidence. Among scenarios (situations) Socioeconomic diversity has a CVI of 0.95, Opinion has 0.93, Gender has 0.70, Ethnic has 0.98, and Religious diversity has a CVI of 0.90 (table-3). The inter-rater reliability for scenarios among 8 judges is 0.86 (table-3). A computation of intra-class coefficient shows a significantly high reliability of 0.86 with interval of 0.55 to 0.98 with 95% confidence (table-3). A computation of intra-class coefficient shows a significantly high reliability of 0.86 with interval of 0.55 to 0.98 with 95% confidence (table-3).
Statements were written to represent traits so; to achieve a balanced model only those statements were retained that has a CVI of 0.7 or above. Among statements, Group 1 (representing B) has a CVI of 0.73, Group 2 (representing I) has 0.98, Group 3 (representing T) has 0.88, Group 4 (representing P) has 0.90, and Group 5 (representing C) has a CVI of 0.90 (table-4). The inter-rater reliability for statements among 8 judges is 0.78 (table-4). A computation of intra-class coefficient shows a significantly high reliability of 0.78 with an interval of 0.30 to 0.97 with 95% confidence.

A CFA reveals the following path-diagram (figure:1) and model fit summary (Table:4) for SAAD 5 factors (BITPC) model with 3 top ranked situations, both, hypothesized and observed, evaluations are presented.
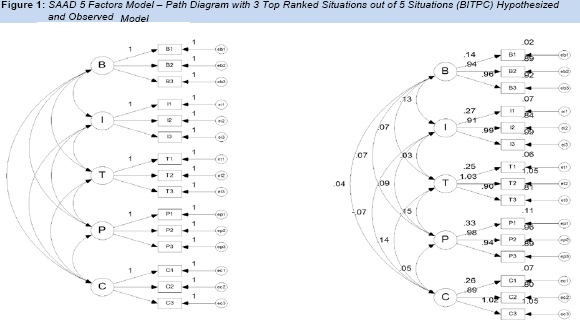
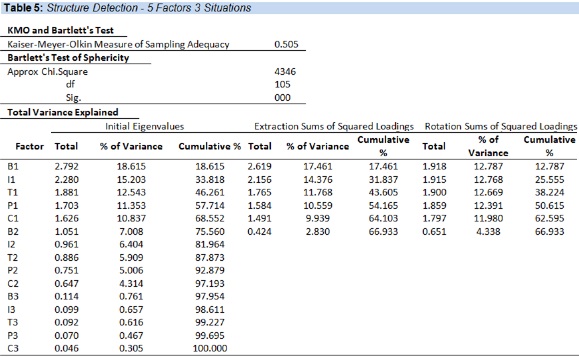
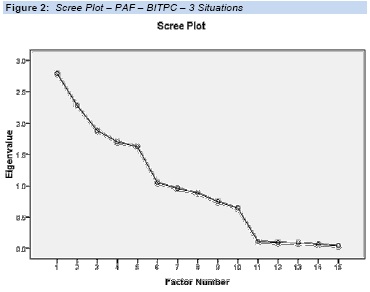
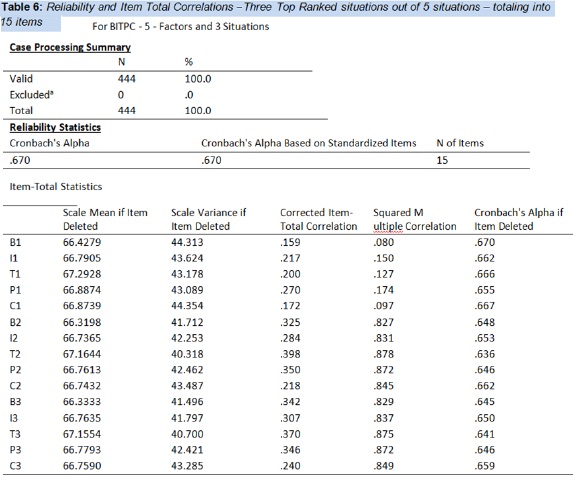
Table-5 has the results of the model fit indices. Table-5 presents the KMO and Bartlett's statistics and total variance with PAF; figure-2 is the scree plot for the same. Table-6 shows the Cronbach's alpha for the BITPC model.
Second CFA was run with five (5) traits and two (2) top ranked situations to see if fit indexes figures get any better. Figure-3 presents the path-diagram, both, hypothesized and observed, evaluations are presented.
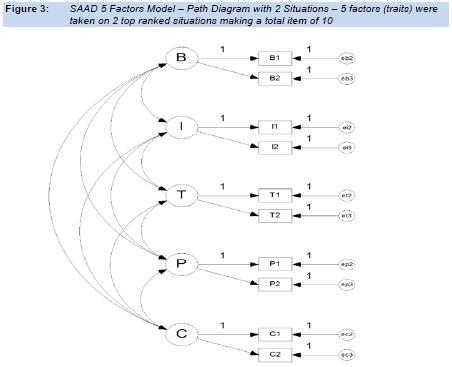
Table-7 has the results of the model fit indices. Table-8 presents the KMO and Bartlett's statistics and total variance with PAF; figure-4 is the scree plot for the same. Table-9 shows the Cronbach's alpha for the BITPC model.
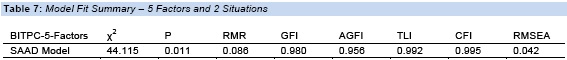
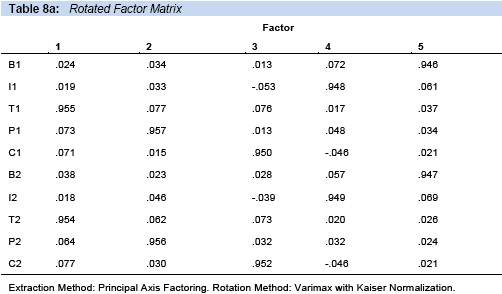
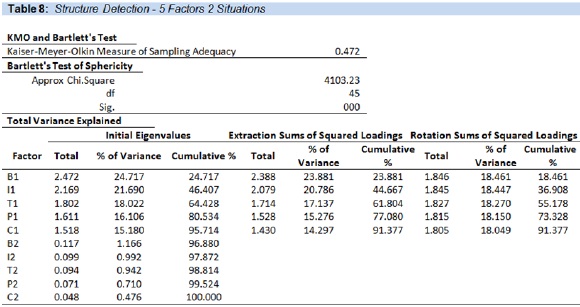
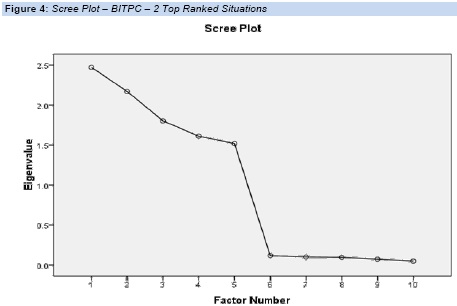
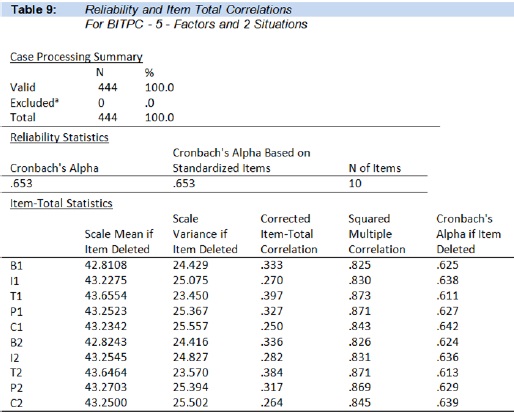
Figure-5 presents the path-diagram for SAAD 3 factors (BIP) model with 2 situations, both, hypothesized and observed, evaluations are presented.
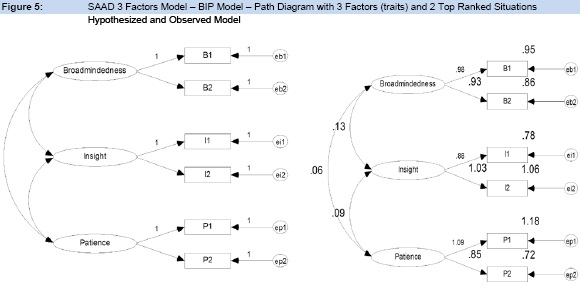
Table-10 has the results of the model fit indices. Table-11 presents the KMO and Bartlett's statistics and total variance with PAF and rotated factor matrix with Varimax and Kaiser Normalization; figure-6 is the scree plot for the same. Table-12 shows the Cronbach's alpha for the BIP model.
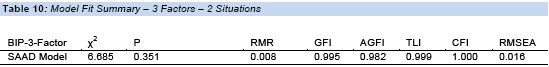
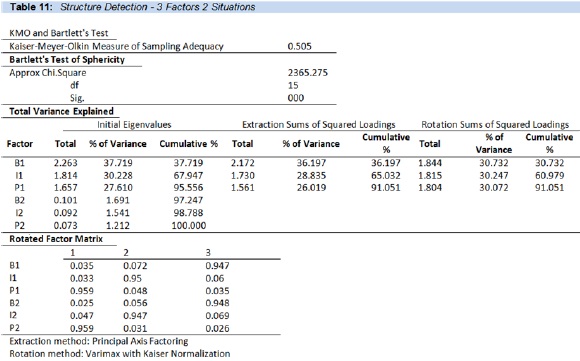
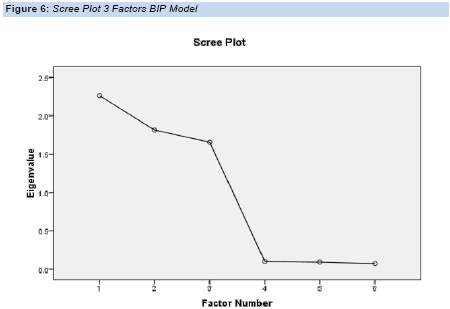
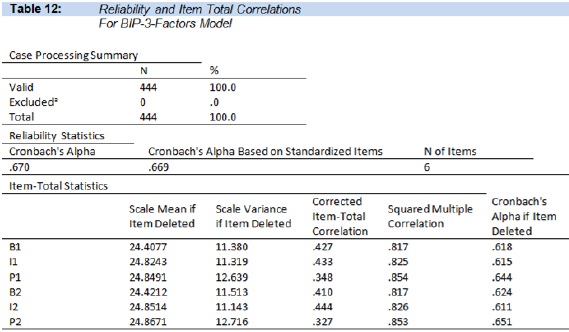
Table-13 has the co-relational statistics among SAAD and three other scales to establish convergent and divergent validity. Same co-relations are presented in figures-7 to 9 as scatter plots.
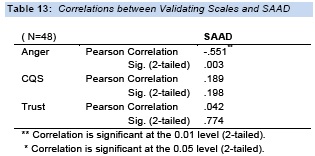
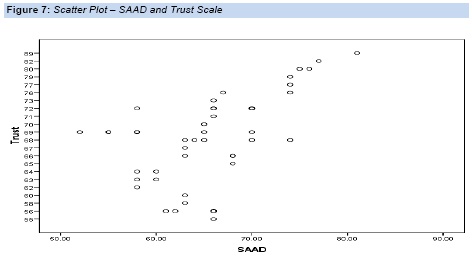
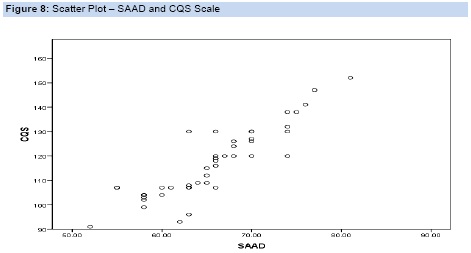
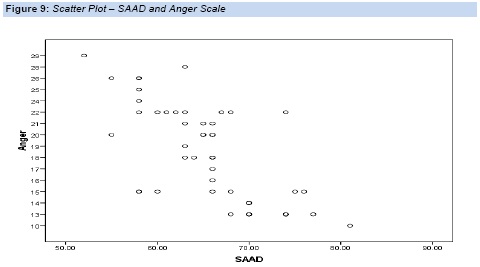
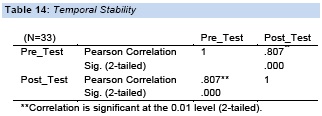
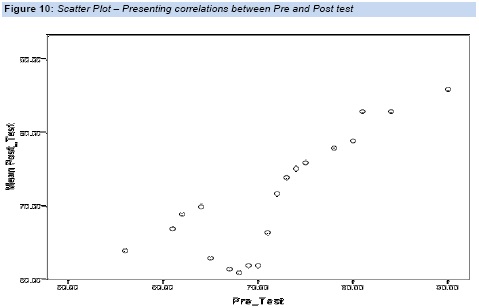
Table-14 has the test-retest results establishing temporal stability of SAAD. Figure-10 is the scatter plot for pre and posttest session (test-retest) results.
4. DISCUSSION
This measure is based on a hypothesized model of five factors. Factors are five traits (BITPC) people assumingly exercise in five diverse (SOGER) situations. The reason to acquire a model-based approach for this research is the presence of already explored, described, and used traits in similar fashion by researchers. It has already been established through literature review that these traits and situations are supposed to be representatives of adjustment and diversity (Costa, McCrae & Dye, 1991; Loden & Rosener, 1991). Therefore, no exploration for the factors was required rather it was seemingly logical to look that the constituent items of the model load on the same factors i.e., a confirmation was required to see whether model fits. The SAAD model theorizes that, 'in a situation with SOGER diversities people tend to utilize BITPC traits in an attempt to adjust to the situation, their success and failure in this attempt evaluates their adjustment potential.' This research does have limitations. These limitations will be discussed following the discussion of yielded results of the model confirmations.
CFA is supposed to be a complete analysis tool to test a theory and establish a model's validity. However, four different statistical analyses were performed. Firstly, KMO (Kaiser-Meyer-Olkin) and Bartlett's Sphericity test was conducted to know the suitability of the data for factor analysis. Secondly, principal axis factoring (PAF) was conducted to detect any existent structure and estimate the total variance. This estimate is going to confirm that we are moving into the right direction. Thirdly, CFA was run to achieve observed values of the hypothesized model and to see whether the model converged with values within the accepted cutoff points of the respective indices. Fourthly, Cronbach's alpha was run to estimate reliability and item-total statistics. Each model has gone through all of these tests to achieve finely filtered results to get a model converged with best possible cutoff points.
The first model evaluated is the basic hypothesized model with five factors. CFA - Confirmatory Factor Analysis3 - was conducted using Amos software. Figure-2, a path-diagram shows the hypothesized and the observed model. For all confirmatory analyses maximum likelihood (ML) estimation was used because ML has been found to produce more accurate fit indices and less biased parameters than generalized least squares (GLS) estimation (Olsson, Foss, Troye & Howell, 2000; Olsson, Troye & Howell, 1999).
The fit of hypothesized five-factor model was assessed examining several fit indices. The Chi-square (χ2) assesses the difference between the sample covariance matrix and the implied covariance matrix from the hypothesized model (Fan, Thompson & Wang, 1999). A non-significant χ2 indicates adequate model fit. As the sample size increases, the sensitivity of the χ2 test increases, potentially resulting in small differences causing misfit (Hu & Bentler, 1995). For this reason, additional absolute fit indices were examined. The RMSEA - (root mean square error of approximation) is moderately sensitive to simple model misspecification and very sensitive to complex model misspecification. Hu and Bentler (1998) recommend a cutoff of 0.06 or less for a well fitting model. The RMR - (root mean-square residual) is very sensitive to simple model misspecification and moderately sensitive to complex model misspecification. Hu and Bentler (1998) recommend a cutoff of 0.06 or less for a good fit. Similarly, cutoff recommended for CFI - (comparative fit index) is 0.95 or above, for GFI - (goodness of fit index) is 0.85 or above, for AGFI - (adjusted GFI) is 0.90 or above. Research shows that the TLI - (Tucker-Lewis Index) has best overall performance regardless of sample size. The recommended cutoff for TLI is 0.95 or above (Baumgartner & Homburg, 1996; Holbert & Stephenson, 2002). The evaluation theme is same for all the models assessed.
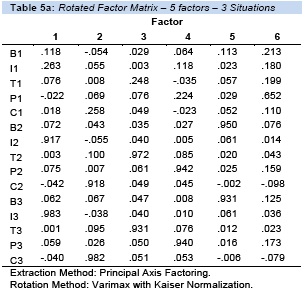
Table-4 has the standardized regression weights and model fit summary for this model. The χ2 test yields a value of 204.13 with a corresponding p-value of 0.000. First, this p-value is very low and suggests a very poor fit. Secondly, the RMSEA value is marginally high (0.59) than 0.05 cut-off, again shows a poor fit. RMR, GFI, CFI, and TLI are relatively good. If we see the regression weights, they are inconsistent, from very low to very high. Apropos Harrington (2008), "in general, the higher the factor loadings the better, and typically loadings below 0.30 are not interpreted, generally, loadings above 0.71 are excellent, 0.63 very good, 0.55 good, 0.45 fair, and 0.32 poor." Similarly, Kaiser-Meyer-Olkin measure shows (table-5) a marginal fit for factor analysis. Principal axis factoring (PAF) shows that constituent items are loaded to the same factors with a variance of 66.9. However, one (1) extra factor (6th factor) was also detected with very low squared loadings, rotated factor matrix (table-5a) shows that this factor is cross loaded with poor loadings, whereas, other factors are loaded perfectly well to their corresponding constituents. Lastly, this model has a reliability of 0.67 ≈ 0.70 (NCSU4) with item-total correlations from 0.159 to 0.398 (table-6).
Taking all the results into consideration from all the analyses suggest that the model is not fit. This asked to check that reducing number of top ranked situations and/or assessing different combinations of factors reflect any change in model fits indices.
The same model with five factors (BITPC) was evaluated with two top ranked situations. The path-diagram in figure-3 and model fit indices in table-7 show a significant improvement. The χ2 value is reduced to 44.11 with 0.011 p-value are better fit. RMR is high with 0.086 from its suggested cut-off of 0.06 shows poor fit. GFI, CFI, TLI, and RMSEA got better (table-7). The regression weights are improved (0.44 to 2.05). A KMO measure (table-8) suggests that it is not suitable for factoring however; total variance improved with 91.3 and similarly, squared loadings improved as well with five (5) factors clearly detected as evident in rotated factor matrix (table-8a) with high factor loadings. The reliability calculations (table-9) show an acceptable reliability of 0.65 with improved item-total correlations ranging from 0.250 to 0.397. However, the overall statistics for this model suggest a poor fit; however, improvements are evident asking for more experimenting with reduced factors with two top ranked situations.
Regression weights of the second model (5 factors, 2 situations) suggest there is an inclination toward three (3) factors i.e., Broadmindedness, Insight, and Patience (BIP). Three factors mean three (3) traits in two (2) diverse situations that makeit a six (6)-item measure. Figure-5, path-diagram, shows evaluation of BIP, a three (3) factors model. The χ2 test yields a value of 6.685 with p-value of 0.351, high enough to reject the null of good fit. RMR is below (0.008) its cut-off (0.60), GFI (0.995), AGFI (0.982), CFI (1.000), TLI (0.999), and RMSEA (0.016) suggest a very good fit. Standardized regression weights are high suggesting again that the factors represent the concept well. The KMO measure (table-11) for this model suggests that factor analysis can be run. Principal axis factoring detected three factors loaded to same items very well with high squared loadings and a total variance of 91.05 (table-11) explaining 91% of the variability. The 3 factor model (BIP) model shows a increase of 23% in total variance covered by these factors was 91%, whereas 5 factors model’s total variance was 67%. All three (3) factor model, whether converged or not, show a persistent high total variance around 90%. This model has a Cronbach’s alpha (reliability) of 0.67 ≈ 0.70 with 0.327 to 0.444 item-total correlations (table-12). All the statistics for the model (BIP) suggest a very good fit.
The BIP model was supported by research of Yakunina, et al. (2011) and Peltokorpia (2008) who suggest openmindedness (broadmindedness|SAAD), flexibility, emotional stability (patience|SAAD), and cultural empathy (insight|SAAD) are the key factors for adjustment to diversity.
4.1. Comparisons of Measures
Testing the validity of the SAAD scale occurred by comparing the scores of the SAAD scale to other measures. Co-relational analysis examined the relationship of the SAAD scale to the Trust scale, CQS scale, and Anger scale. These analyses assessed convergent and divergent validity.
CQS measures cultural intelligence within the domain of diversity, however, it looks into a different capacity and perspective of adjustment to a cross-cultural situation. The comparison of SAAD with CQS provides divergent validity. Considerably low (0.198) co-relational value suggests that SAAD is not measuring cultural intelligence (table-13).
Trust scale on the other hand measures a similar but distinct trait. Similar in a way that trust is supposedly the trait that helps in relationship building and social interaction. However, SOGER situations of SAAD are transient in nature; they do not particularly consider situations where relationship establishment is necessary. Trust needs time to be build after a relationship have already taken place. Low co-relational scores of SAAD and Trust scales (0.042) suggest that SAAD is not measuring the general trust thus establishing a divergent validity (table-13).
Anger scale measures tendency to be angry in any situation. We suppose that a person cannot show any of BITPC traits of SAAD if s/he has a tendency to show anger. Therefore, individuals high on anger scale should have a low score on SAAD and vice versa. A negative but relatively strong correlation (0.551) shows the convergent validity of SAAD scale (table-13). Scatter plots of each examination show the correlations between SAAD and corresponding scale (Figure-7, 8, 9).
4.2. Analysis of Test-Retest Data
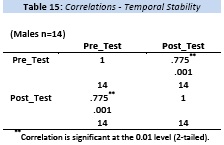
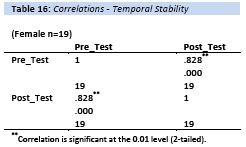
Temporal stability was established by re-administering the SAAD scale four weeks after original administration, on a sub-sample 0f 33 individuals, 14 males and 19 females. SAAD demonstrates a high temporal stability (r=0.807, table-14). Females show relatively more stability (r=0.828, table-16) than males (r=0.774, table-15). A scatter plot in Figure-10, displays these correlations visually.
5. CONCLUSION
SAAD scale was hypothesized with five factors (traits: BITPC) and five diverse situations (SOGER). Statistical results reveal that the model cannot be fit to the data i.e., five traits (factors) do not converge. Data was computed with the representation of all five (SOGER) situations while evaluating each trait against them. Instead of five-factor model, a three-factor model converged very well. Three factors in any two top ranked situations are consistently detected throughout all PAF computations and CFA confirmations. They are loaded seamlessly to their respective constituent items with high loadings and squared loadings and regression weights. However, only BIP - Broadmindedness, Insight, and Patience model is the best fit to the data on all fit indices and other statistics. Theoretically, BIP traits seem relevant to each other, as insight enables in showing broadmindedness and gaining patience in a demanding situation where individual feels uneasy or threatened.
Insight and Patience are the most consistent factors (traits) throughout the computations. Insight and patience in different model, where they are a part of it, bring the model to a closer fit however not a perfect fit due to many other reasons. The second consistent factor is broadmindedness.
All these results make SAAD a reliable and valid instrument. Administering SAAD with three (3) factors i.e., BIP comprising six (6) items can tell if a person can adjust to a demanding situation (any two top ranked SOGER situations by the respondent) that has diversity one sees enough to put her or him on using her or his full potential to be positive in that particular situation.
6. LIMITATIONS ON THE RESEARCH
These limitations include sampling, issues related to reliability, and the measures used for determination of validity. Sample for this study requires to be drawn from public, as it was drawn, however, when we say public of a metropolitan like Karachi then it should represent all religious, ethnic, and socioeconomic groups residing in the city. The studied sample lacks in this regard. Especially, when we talk about religious or sect then it should be able to capture the current belonging of the person to the religion, religious group, or sect. In the current study, it was difficult to ask about this especially in our scenario. Similarly, there should be a check on current SES of the respondent. Sample size was statistically significant though still low, this will be increased in the future studies.
Reliability of the best-converged BIP model comes into the category of 'good'. However, it needs to be increased. Validity of the scale is not as clear as it has to be. Perhaps the use of three validating scales was a wrong decision, a greater number of measures evaluating convergent and divergent validity would have made for a stronger evaluation of validity. The convergent validity would have been established using a more relevant scale. The scale is lacking the predictive validity evaluations.
The SAAD scale shows initial signs of being a valid and reliable measure of the adjustment to diversity. Future studies are anticipated that will allow for the strengthening of the reliability of the measure across demographic groups, as well as increase its convergent and divergent validity and examine the predictive validity. Collection of data for each of five (5) factors from a larger sample as suggested by Boomsma, at least 200 hundred per factor will enable us to know whether two (2) or single (1) factor model fit to data as well as a three factor model fits. Similarly, for single situation evaluations, each situation will require a sample of 200 or above.
NOTAS
1Broadmindedness-Insight-Tenderheartedness-Patience-Composure2Socioeconomic-Opinion-Gender-Ethnic-Religious
3Indiana University Information Technology Service [http://wwwindiana.edu/~statmath/stat/all/cfa/cfa3.html]
4North Carolina State University [http://faculty.chass.ncsu.edu/garson/PA765/factor.htm#assume]
7. REFERENCES
Baumgartner, H. & Homburg, C. (1996). Applications of Structural Equation Modeling in Market and Consumer Research: A Review. International Journal of Research in Marketing. 13(2), 139-161. [ Links ]
Carver, C. S., Scheier, M. F. & Weintraub, J. K. (1989). Assessing Coping Strategies: A Theoretically Based Approach. Journal of Personality and Social Psychology, 56(2), 267-283. [ Links ]
Costa, P. T., Jr. McCrae, R. R. & Dye, D. A. (1991). Facet scales for agreeableness and conscientiousness: A revision of the NEO Personality Inventory. Personality and Individual Differences, 12, 887-898. [ Links ]
Crisp, J. R. & Turner, N. R. (2011). Cognitive adaptation to the experience of social and cultural diversity. Psychological Bulletin, 137(2), 242-266. [ Links ]
Fan, X., Thompson, B. & Wang, L. (1999). Effects of Sample Size, Estimation Methods, and Model Specification on Structural Equation Modeling Fit Indexes. Structural Equation Modeling: A Multidisciplinary Journal, 6(1), 56-83. [ Links ]
Freeman, S. & Lindsay, S. (2011). The effect of ethnic diversity on expatriate managers in their host country. International Business Review, 21(2), 253-268. [ Links ]
Grant, J. S., & Davis, L. L. (1997). Focus on quantitative methods, selection and use of content experts for instrument development. Research in Nursing and Health, 20, 269-274. [ Links ]
Guion, L. A. (1991). The diversity challenge: Programming in Extension in the new millennium. North Carolina Cooperative Extension, NC State University. [ Links ]
Harrington, D. (2008). Confirmatory Factor Analysis (Illustrated ed.): Oxford University Press. US. [ Links ]
Holbert, R. L. & Stephenson, M. T. (2002). Structural Equation Modeling in the Communication Sciences. Human Communication Research, 28(4), 531-551. [ Links ]
Hu, L. & Bentler, P. M. (1995). Evaluating model fit. In R. H. Hoyle (Ed.), Structural equation modeling: Concepts, issues, and applications (pp. 76-99). [ Links ]
Hu, L. & Bentler, P. M. (1998). Fit Indices in Covariance Structure Medeling: Sensivity to Underparameterized Model Misspecification. Psychological Methods. 3(4), 424-453. [ Links ]
Kammeyer-Mueller, J. D. & Judge, A. T. (2009). The role of core self-evaluations in the coping process. Journal of Applied Psychology. 94(1), 177-195. [ Links ]
Loden. M., & Rosener. J. B. (1991). Workforce America: managing employee diversity as a vital resource. McGraw-Hill. DOI: 10.1036/1556233868. [ Links ]
Lynn, M. R. (1986). Determination and quantification of content validity. Nursing Research, 35, 382-385. [ Links ]
Matsumoto, D., Nakagawal, S. & Estrada, A. (2009). The Role of Dispositional Traits in Accounting for Country and Ethnic Group Differences on Adjustment. Journal of Personality, 77(1), 177-212. [ Links ]
Matsumoto, D., LeRoux, J., Ratzlaff, C., Tatani, H., Uchida, H., Kim, C. & Araki, S. (2001). Development and validation of a measure of intercultural adjustment potential in Japanese sojourners: the Intercultural Adjustment Potential Scale (ICAPS). International Journal of Intercultural Relations, 25(5), 483-510. [ Links ]
Matthew, J. M. (2007). A bilinear multidimensional measurement model of Asian American acculturation and enculturation: Implications for counseling interventions. Journal of Counseling Psychology, 54(2), 118-131. [ Links ]
Olsson, U. H., Foss, T., Troye, S. V. & Howell, R. D. (2000). The performance of ML, GLS, & WLS estimation in structural equation modeling under conditions of misspecification and non-normality. Structural Equation Modeling, 7, 557-595. [ Links ]
Olsson, U. H., Troye, S. V. & Howell, R. D. (1999). Theoretic fit and empirical fit: The performance of maximum likelihood versus generalized least squares estimation in structural equation modeling. Multivariate Behavioral Research, 34, 31-58. [ Links ]
Padilla, M. A. & Perez, W. (2003). Acculturation, Social Identity, and Social Cognition: A New Perspective. Hispanic Journal of Behavioral Sciences, 25(1), 35-55. [ Links ]
Peltokorpia, V. (2008). Cross-cultural adjustment of expatriates in Japan. International Journal of Human Resource Management, 19(9), 1588-1606. [ Links ]
Puccio, G. (1999). Psychological Diversity: Implications for Teaching and Learning. The International Center for Studies in Creativity. Retrieved from http://www.buffalostate.edu/orgs/cbir/readingroom/html/Puccio-99.html [ Links ]
Raymond, C. & Mary, S. (1977). Psychological and social adjustment of Asian Immigrants to Britain. Social Psychiatry, 12, 195-207. [ Links ]
Raymond, C. (1979). Psychological and behavioral disturbance in West Indians, Indians, and Pakistanis in Britain: a comparison and rates among children and adults. British Journal of Psychiatry, 134, 201-210. [ Links ]
Ramalu, S. A., Rose, R., Uli, J. & Samy, N. A. (2010). Personality and Cross-Cultural Adjustment among Expatriate Assignee in Malaysia. International Business Research, 3(4), 96-104. [ Links ]
Yakunina, E.S., Weigold, I.K., Weigold, A., Hercegovac, S., Elsayed, N. (2012) The multicultural personality: Does it predict international students' openness to diversity and adjustment?, International Journal of Intercultural Relations, 36(4), 533-540, http://www.dx.doi.org/10.1016/j.ijintrel.2011.12.008 [ Links ]
Jung, C. G. (1971). Collected works of C. G. Jung: Vol. 6. Psychological types (H. G. Baynes, Trans., revised by R. F. C. Hull). Princeton, NJ: Princeton University Press. (Original work published 1921). [ Links ]
Quenk, N. L. (2009). Essentials of Myers-Briggs Type Indicator Assessment. John Wiley & Sons, Inc. New Jersey. [ Links ]
