


 Inglés (pdf)
 Articulo en XML
 Referencias del artículo
 Enviar articulo por email
 Citado por SciELO
  Citado por Google
  Similares en
SciELO
Similares en
SciELO  Similares en Google
 Permalink
Introduction
Anxiety and depression disorders constitute the most common mental alterations of the general population. Data provided by the World Health Organization (2003) reveal ascendant values. At least 264 million people suffer anxiety disorders, equivalent to a 15% increase in the last decade, and approximately 322 million people suffer from depression,18% more than 10 years ago. Anxiety and depression are significant disorders not only because they cause the deterioration of personal and family relationships, but also due to the socioeconomic implications related to healthcare costs and diminished work productivity and quality of life (Ayuso & Álvarez, 2000).
Regarding clinical and symptom history, syndrome diagnosis of anxiety and depression disorders is nowadays primarily done by applying criteria in the Diagnostic and Statistical Manual of Mental Disorders (DSM-V American Psychiatric Association, 2013), or in the ICD (CIE-10, World Health Organization, 1992), and secondarily, by use of clinical assessment instruments. In spite of their usefulness as an element of support to clinical diagnosis these instruments are used mainly as measuring scales of the severity of symptomatology associated with the disorder, thus signalling the presence of anxious or depressive pathology and at the same time determining the severity, proving very useful both in clinical practice and research (Salvador, Romero & González, 2000). For this reason, it is essential that clinical scales are appropriate to the cultural environment where they are applied and that they have adequate psychometric properties of validity, reliability and sensitivity (Heyland, et al., 1998).
Goldberg Anxiety and Depression Scale (GADS) is a simple diagnostic tool, developed specifically to find out the probability that a state of anxiety or depression will occur. It was created by its author in 1988 as a short interview that could be used by healthcare personnel as a filtering instrument.
The dimensionality of the instrument was developed through analysis of latent features, in which item construction was deployed from data obtained from 427 patients who went to 15 general medical practitioners in Manchester. The data was then analyzed using the Psychiatric Assessment Schedule (Bond, Brooks, Carstairs & Giles, 1980), General Health Questionnaire (Goldberg & Hillier, 1979) and evaluated with the diagnosis criteria for generalized anxiety and major depression described in the Diagnostic and Statistical Manual of Mental Disorders DSM-IV third revision (American Psychiatric Association, 1987, 2002).
With the purpose of examining the correlation between the symptoms of psychiatric disorders most commonly found in primary care clinics, two dimensions were identified: symptoms of anxiety and symptoms of depression which obtained a high direct correlation according to their defining characteristics.
Item formulation was done in two groups: detection items were four symptoms corresponding to the lowest thresholds, while probing items were the five symptoms with the highest thresholds. It was determined that the anxiety scale had 82% sensitivity and a positive 0.56 value; the depression scale had 85% sensitivity and a predictive value of positive 0.85. General specificity was 91% and general sensitivity 86% (Goldberg, Bridges, Duncan-Jones, & Grayson, 1988).
GADS has been widely recommended as a tool for both healthcare and epidemiology, and/or a guide for primary care clinical interviews, which can produce bidimensional information about the severity of anxiety and/or depression (López, Gabarrón, & Ruiz, 2011). Regarding cultural adaptations, the scale has been validated in numerous countries, among them the Spanish version by Montón, Pérez Echeverría, Campos, García Campayo and Lobo (1993) for the Spanish population, which authors indicate has 83.1% sensitivity, 81.8% specificity and 95.3% positive predictive value. Also, in a survey of predictive validity in Cuba, it had an adequate predictive value in identifying patients with the disorders (Martín Carbonell, Pérez Díaz, & Riquelme Marín, 2016). Nonetheless, GADS dimensionality has been assessed with the same validation method of the original scale through the analysis of latent features whose results support the bi-dimensional structure of the original scale (Koloski, Smith, Pachana & Dobson, 2008; Mackinnon et al., 1994). In regard to reliability it showed a 0.81% internal consistency by the Cronbach's alpha coefficient for the full scale, 0.70 for the depression scale and 0.74 for the anxiety scale (Mackinnon et al., 1994).
In the Iranian version, the results of factorial analysis revealed that the scale explains 44.63% of the total variance (Aminpoor, Afshinfar, Mostafaei & Ostovar, 2012); in the Australian adaptation its use was considered to be a valid tool for identifying cases of depression and anxiety (Kiely & Butterworth, 2015). The Italian version used the method of main component analysis for its adaptation (Magnavita, 2007).
In addition, a survey conducted in the UK showed that GADS has good reliability as a measure of stability (Kinderman et al., 2015).
As far as the convergent validity of the scale, studies demonstrate a good correlation with the instruments of the following: the Spanish version of the scale of anxiety and pre-surgery information of Amsterdam APAIS (Vergara-Romero et al., 2017); the PRIME-MD (Primary Care Evaluation of Mental Disorders); and the MINI (Mini International Neuropsychiatic Interview) and the Goldberg Health Questionnaire Goldberg (GHQ-28) (Bernardos, Larios & Jimenez, 1999), showing statistically significant values higher than 0.70.
The Goldberg Anxiety and Depression Scale is an instrument widely used in healthcare practice and in clinical research (Varo, Fernández, Cobos, Gutiérrez, & Aragón, 2006).
A review of the availability of GADS in Ecuador showed that it was being used regularly in various occupational health centers in the country (Arellano-Yépez & Riofrío Andaluz, 2010; Espín Hernández, 2017; Granda Villavicencio, Aldude & Vicente, 2017), without going through a process of cultural adaptation or formal validation.
Given that no previous psychometric studies of this instrument have been done in Ecuador, that there are surveys with different methods of analysis in versions that have been adapted into other languages, and that it methodologically speaking it is recommended to progress from exploratory to confirmatory stages in the factorial validation of the measuring scales (Lloret-Segura, Ferreres-Traver, Hernández-Baeza & Tomás-Marco, 2014), we set as our goal to carry out an exploratory study of the factorial validity of GADS without a priori assuming any factorial model. Additionally, we sought to validate the reliability of this instrument in Ecuador by studying a sample of Ecuadorian university students, in order to provide a version that can be used in healthcare and clinical research in our environment.
Method
Participants
The study population consisted in an accidental, non-probabilistic sample (Hernández Sampieri, Fernández Collao, & Baptista Lucio, 2015) of 609 psychology students from the Catholic University of Cuenca. A total of 600 valid answers were obtained (98.5%), from 59.6% women and 40.4% men, with an average age of 21 years old (DY= 2.82). As for the selection criteria, university psychology students of psychology that had signed an informed consent sheet were selected, whereas students under the effect of drugs (except tobacco) were excluded.
Instruments
Goldberg Anxiety and Depression Scale -GADS-(Goldberg et al., 1988). This instrument is composed of two subscales of 9 binary (yes / no) items. The first subscale for anxiety, "Have you had difficulty relaxing?" (questions1 to 9); and the second subscale for depression, "Have you felt low energy?" (questions 10 to 18) were used. The initial questions of each subscale 1-4 and 10-13 respectively are conditioning questions. At least two affirmative answers are required for questions 1-4 to discontinue the subscale. For the second subscale, one positive answer is needed from questions 10-13 to continue answering the subscale. The whole scale presents 91% specificity and 86% sensibility. The cut-off point for the anxiety subscale is 4 or more points and 2 or more points for the depression subscale. Higher point values indicate a more severe problem with 9 as the highest possible value for each subscale). Although the questions are very clear with binary responses, the authors consider that sometimes a low level of intensity is difficult to detect, and a professional judgment is needed to evaluate the clinical significance of the answers.
Sociodemographic questionnaire. A short survey to recollect personal data, such as age, gender and level of completed studies was used.
Procedure
GADS has been adapted to Spanish using a translationback translation methodology (Beaton, Bombardier, Guillemin & Ferraz, 2000; Bullinger et al., 1998), as well as the by the Bulletin of the International Test Commission (Hambleton & Bollwark, 1991; Hambleton & Kanjee, 1995). Using this methodology, it was possible to substantiate semantic and structural equivalence between original items and the Spanish translation.
The scale was analyzed by three 3 Ecuadorian professional expert judges specializing in psychological quantification variables who determined the linguistic comprehension and the applicability of the scale in the Ecuadorian context. In this study the scale was compared to the Spanish version (Montón et al., 1993) showing evidence for semantic equality. Later, the scale was applied to a pilot sample (N = 25) where linguistic comprehension was assured.
The Ethics Research Committee of the Catholic University of Cuenca approved the study and informed consent was obtained in accordance with the APA's Ethical Principles of Psychologists and Code of Conduct (American Psychiatric Association, 2002) for students who voluntarily participated in the study and signed the written document. The data collection process was conducted during the teachers' work time, emphasizing the anonymous character of the information obtained (Behnke, 2006).
Data analysis
The exploratory factorial analysis was carried out using the software program Factor version 10.0.02 (Ferrando & Lorenzo Seva, 2017). In order to get the number of dimensions of the dispersion matrix of tetrachoric correlation (Muthén & Hofacker, 1988), the extraction procedure for the two subscales was obtained by a parallel analysis (PA) (Timmerman & Lorenzo-Seva, 2011) which is frequently recommended to evaluate the dimensionality of a set of variables. AP is known to be have been used in different variants that may produce different indications of dimensionality, hence it is considered the most appropriate method for evaluating the number of common factors underlying the ordered variables (Timmerman & Lorenzo-Seva, 2011). Moreover, the procedure used to obtain the random correlation matrix was by raw data permutation (Buja & Eyuboglu, 1992). Before performing KMO and Bartlett's Test of sphericity the extraction method was done by unweighted least squares (ULS). Promin was used to maximize factor simplicity (Lorenzo-Seva, 1999).
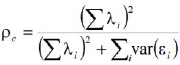
Each scale reliability analysis was carried out by calculating Cronbach's Alpha coefficient (Nunnally, 1975, Nunnally & Bernstein, 1994). The reliability coefficient, or complex reliability (pc) reflects the degree to which observed variables are consistent to their measure of the latent construct as specified by the model. Equation 1 shows that the indicators are presented as λi = standardized charge of indicator i; ei= measurement error of indicator i; and y var εi= 1- λ2i. Complex reliability (pc) is similar to Cronbach's Alpha as a measure of internal consistency. Nevertheless, the difference is that complex reliability uses item charges as they are supposed in the causal model. Fornell and Larcker (1981) argue that complex reliability is superior to Cronbach's Alpha, because it has a more general order and it is not influenced by the number of existing items on the scale. The interpretation of both indices is similar on each.
Correlation item-factor was calculated by the extracted variance (Average Variance Extracted, AVE) of Fornell and Larcker (1981), which means that if the different items intended to measure a construct measure it accurately, the adjustment of these items is assumed to be significant and will be highly correlated. Evaluation of this process is done by means of the average variance extracted (AVE), which provides the amount of variance that a construct obtains from its indicators in relation to the amount of variance due to measurement error. The formula is established in Equation 2, as λi = standardized charge of the indicatori; εi = measurement error of the indicator i, and y var εi = 1 - λ2i.
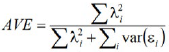
Authors recommend that extracted variance should be superior to 0.50, establishing that more than 50% of the construct extracted variance is due to its indicators (Fornell & Larcker, 1981). Nevertheless, it is argued that this is an extremely strict value (Malhotra & Dash, 2011) and must be interpreted with flexibility.
Results
Factorial structure
Initially, it was confirmed by the pertinent statistical tests that the data could be subjected to factorial analysis.
The Kaiser-Meyer-Olkin (KMO) test obtained a 0.80 index for the anxiety scale and 0.86 for the depression scale. The result of the Bartlett's sphericity test was X2 =947.8 for the anxiety scale and x2 =1248.0 for the depression scale: df=36 and p<0.01 in both scales. Consequently, the relevant analyses were performed. Factor extraction by Parallel analysis for the anxiety subscale (Table 1), and for the depression scale (Table 2) suggest one dimension.
Table 1 Parallel Analysis (PA) of the Goldberg anxiety subscale based on the factor analysis of minimum range (Timmerman & Lorenzo-Seva, 2011) in the Ecuadorian population.
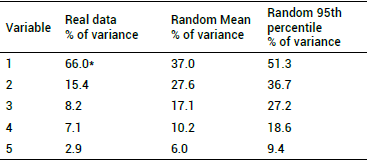
* Dimension recommended amount: 1.
Table 2 Parallel Analysis (PA) of Goldberg depression subscale based on the factor analysis of minimum range (Timmerman & Lorenzo-Seva, 2011) in Ecuadorian population.
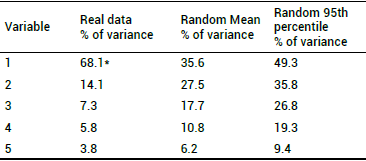
* Dimension recommended amount: 1.
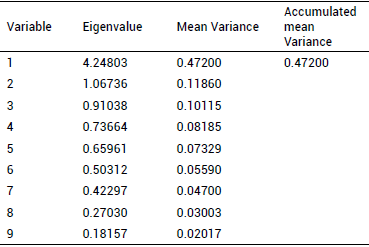
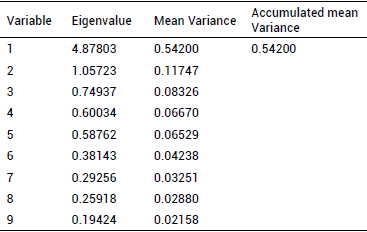
Variance explained by the eigenvalues; an accumulated percentage of 0.47 is observed for the anxiety subscale (Table 3), and a percentage of 0.54 for the depression subscale (Table 4).
Table 3 Variance explained from the eigenvalues for the Goldberg anxiety subscale in Ecuadorian population.
Internal consistency
The instrument's reliability was first determined by the Cronbach's Alpha Coefficient for the anxiety subscale obtaining a 0.75 value, which is considered acceptable. The depression subscale obtained a value of .80, which is considered good (Nunnally & Bernstein, 1994; Carmines & Zeller, 1979). The complex reliability coefficient was also obtained (pc) for the anxiety subscale obtaining a 0.73 value. As for the depression subscale, a value of 0.78 was obtained, both considered acceptable.
Correlation item-factor by the average variance extracted (AVE)
Results showed a value of 0.28 for the anxiety subscale and a higher value for the depression subscale of 0.35.
Discussion
The present research on instrumental adaptation had the objective of exploring the factorial structure and reliability of Goldberg's Scale on Anxiety and Depression (Goldberg et al., 1988), in a sample composed of university students from Ecuador. This scale assesses the severity of symptomatological anxiety and depression. The analysis of psychometric properties showed that the instrument possesses the same bidimensional structure of the original scale, as well as the distribution of the items in both subscales. As for internal consistency, the obtained indexes are shown to be acceptable and good. However, when the items-factor correlations times mean variance was analysed the values are slightly reduced, possibly due to the items being influenced by some external component. Nevertheless, as was mentioned before, this value must not be interpreted strictly, but flexibly (Malhotra & Dash, 2011).
As for the research limitations (Price & Murnan, 2004), since the sample is composed of university students, it is not possible to estimate the diagnostic validity of the sieving instrument with a reference diagnosis in terms of sensibility and specificity. Furthermore, the research was of a transversal cut, and the collection of data was of a psychometric scale, which does not allow us to obtain information about the instrument based on other reliability concepts such as the stability measure and/or alternative or parallel forms; the same applies to criterion validity as well as convergence, discrimination and/or predictive capacity (Hernández Sampieri et al., 2015). On the other hand, in the current methodology, even when the Factorial confirmatory analysis procedures are highly developed the same method is still used for confirmation (Pérez Gil, Chacón Moscoso, & Moreno Rodríguez, 2000). Nonetheless, future studies utilizing factorial analysis should investigate and be compared with the factorial structure in the present research. Finally, the results indicate that GADS is a valid scale for Ecuadorian culture, allowing an updated version to be used in clinical, welfare and research practice, and applied to their environment.
Note: This research was part of an objective of a doctoral thesis of the University of Palermo, made by the main author.


