


 Inglés (pdf)
 Articulo en XML
 Referencias del artículo
 Enviar articulo por email
 Citado por SciELO
  Citado por Google
  Similares en
SciELO
Similares en
SciELO  Similares en Google
 Permalink
Introduction
Empathy is generally described as the capacity to feel and share the feelings and thoughts of others (Decety, 2017). Actually, it is considered to be a multifaceted construct, with diverse components that interact: a) through emotional contact, the capacity to share the emotional states of others; b) under the empathetic inclination, a tendency to contribute to the wellbeing of others; and c) through taking perspective, the deliberate cognitive capacity to understand what another person thinks and feels (Decety, 2015; Decety & Svetlova, 2012; Derntl et al., 2010; Shamay-Tsoory, Aharon-Peretz, & Perry, 2009). Each of these components emanates from specific neurobiological processes (Decety, 2017).
Exercising empathy reinforces prosocial behavior (Decety & Cowell, 2014). This capacity can be shown to be present or absent in specific actions that may be taken in reaction to the suffering or pain experienced by others. In this sense, one who empathizes must be able to relieve such suffering (Batson, Van Lange, Ahmad, & Lishner, 2003). On the other hand, according to many studies, the capacity to show empathy runs counter to aggressive and violent behavior (e.g. Winter, Spengler, Bermpohl, Singer, & Kanske, 2017). Also, anomalies have been detected in schizophrenic patients in their cognitive capacity to exercise empathy (Vistoli, Lavoie, Sutliff, Jackson, & Achim, 2017). People with schizophrenia showed an abnormal modulation of activation in the temporoparietal junction (TPJ) bilaterally (Vistoli et al., 2017). TPJ is the specific brain system associated with cognitive capacity to exercise empathy.
The relationship between empathy and conduct is reflected in the concept of empathie behavior. This term has been used in different studies, often loosely, without a clear understanding behind it. Auné, Blum, Abal, Lozzia and Atorresi (2014) defined empathie behavior as those actions that show comprehension, effort and emotional support. These authors have developed the scale of empathie behavior (SEB) to measure the tendency to behave with empathy.
The Scale of Empathie Behavior (SEB)
The SEB (Auné, Abal, & Attorresi, 2017) is composed of eight items that are responded to using a 6-point frequency scale (Never, Almost Never, Sometimes, Often, Almost Always, Always). By means of exploratory factor analysis (EFA), the developers of the SEB provided evidence that a single dimension runs through the SEB items and that the SEB items are internally consistent (α = 0.82; gib = 0.89). In addition, the authors demonstrated convergent validity between the measurements of the SEB and the Argentinian version of the Assumed Perspective of the Scale of Prosocial Abilities (SPA, Morales Rodriguez & Suarez Perez, 2011), as well as with the study participants' self-perception of their own prosocial behavior. The study participants were 1168 Argentine university students (81% Women).
Modeling of the SEB with the Item Response Theory (IRT)
Even though validity evidence for the SEB scores was established using EFA and classical test theory (CTT) methods, it is also useful to generate psychometric evidence by modeling the SEB with item response theory (IRT, De Ayala, 2009). It is important to mention that the general use of IRT models in Argentina and Latin America is recent and of limited extent, and even more limited in applications to tests of typical behaviors by those who evaluate such modes of behavior. The application of IRT in non-educational environments poses challenges that have been surmounted primarily with narrow constructs. IRT offers specific models for examining and organizing items in instruments and a process of evaluation that cannot be conducted with CTT and EFA methods.
The GRM developed by Fumiko Samejima (1969) is an extension of the two-parameter logistic (2PL) model for items of dichotomous response to the polytomous case. It is appropriate when the responses to an item can be classified into more than two ordered categories, such as to represent different degrees of achievement in the solution to a problem or levels of agreement or frequency to a certain statement. The responses to a given item are classified in M + 1 ordered categories, where M is the total number of original categories of the item, so that those with the smallest numbers represent less of the feature measured by the item than higher categories. We will represent the generic category of the item as m. The scores for the item are successive integers. Despite this, it is assumed that the discrete response 5 of an individual to an item is part of a continuum of response S.
For each item, a slope (a) parameter and a set of threshold parameters of category b m are estimated. The b m are the points of the latent trait where the probability of choosing category m or higher is 0.5. The discrimination parameter a is constant for all the item category characteristic curves (ICCCs) within an item and reports the degree to which their response categories distinguish between trait levels. This means the α parameter can vary across items within the same instrument. The parameter a in the GRM is denoted in different ways. Some authors call it discrimination as is done for the 2PL model (e.g., Escurra Mayaute, & Salas Blas, 2014) and others call it the slope parameter (e.g., Hernández Baeza, Muñiz Fernández, & García Cueto, 2000).
Samejima (1969) developed a two-step process to obtain the probability that an individual chooses a certain category in a given item. In the first step, the probability that an individual with a certain trait level chooses a category m or greater in a given item is expressed by the following formula (Equation 1):
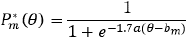
where:
1.7 is the specialized D parameter, since this value gives the best approximation within one decimal point of the logistic function to the accumulated normal. α is the parameter of slope or discrimination of the item.
b m is the point of the latent trait where the probability of choosing category m or higher is 0.5.
e is the base of the natural logarithm: 2.718
θ is the level in the latent trait, in this case the level of empathic behavior.
P * m (θ) = 1 if m = 1 since the cumulative probability of responding in the lowest category or in all the major ones is a certain event.
P * m (θ) = 0 if m = M + 1 since the probability of responding in a category following the largest is null.
In the second step, the probability that an individual responds in a given category is defined as (Equation 2) :
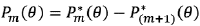
The use of this formula, which subtracts the cumulative probability to the right of a given category and that of the next one, allows us to obtain the ICCCs. Each ICCC describes the probability of giving a certain response option to the item for each level of the trait it measures.
Method
Participants
The sample consisted of 1136 Argentine university students (80.7% Women). The mean age was 21.5 years with a standard deviation of 5.8. The majors with the greatest weight in the sample were Medicine (13.4%), Law (9.6%), Public Accounting (9%), Psychology (5.3%), Business Administration (5.3%) and Audiovisual Arts. (4.4%). The rest of the participants were distributed, with very low frequency, in more than 40 different university careers.
Procedure
The sampling method was convenience sampling. Informed consent was included in the administered protocol. In addition, it was clarified that the use was exclusively for research purposes and participation was entirely voluntary and could be discontinued at any time.
Instruments
Sociodemographic Questionnaire. This included variables such as age, gender, academic major and current academic level of the questionnaire participant.
Scale of Empathie Behavior (SEB). Details about the SEB item type were previously mentioned. The specific items that comprise the SEB are as follows: 1) When I feel that somebody is distressed, I show them that I understand them; 2) I behave as a support to others; 3) I put myself in the other person's shoes; 4) I tell others how much they are valued; 5) I share the bad experiences of my life with friends, so that they won't make the same mistakes I did; 6) If a person tells me about a conflict, I try to explain to him the point of view of the other person; 7) I try to "raise" the self-esteem of my friends; and 8) I am there for my associates in times of sadness.
Data Analysis
The assessment of the unidimensionality assumption assumed by the GRM was carried out by means of an EFA of the polychoric correlation matrix on the eight items that make up the SEB using FACTOR version 10.8.04 (Lorenzo-Seva & Ferrando, 2013). The factor extraction method was Unweighted Least Squares (ULS) with promin rotation. The procedure for determining the number of dimensions was optimal implementation of Parallel Analysis (Timmerman & Lorenzo-Seva, 2011).
The assumption of local independence is also required by the GRM. Through the x2 ld index proposed by Chen and Thissen (1997), each pair of items was tested. If the value of the x2 ld is greater than 10, it indicates possible local dependence (LD) and the nonfulfillment of the assumption. The index is composed of two parts: the x2 statistic and a standardized odds ratio difference. The latter can cause the result to be negative; this would indicate that the observed frequencies of the pair of items have less LD than that predicted by the model (Chen & Thissen, 1997).
Once the assumptions of the GRM were corroborated, the GRM was implemented through the Item Response Theory Patient Reported Outcomes (IRTPRO) 4.2 program (Cai, Thissen, & du Toit, 2011). The adjustment of each item to the model was evaluated with the S-x2 index (Orlando & Thissen, 2000, 2003) and considered to fit the GRM if the associated p > 0.01 (Toland, 2014). Global adjustment of the model was calculated with the M2 statistic (Maydeu Olivares & Joe, 2005, 2006) and the associated RMSEA index; the adjustment was accepted if the RMSEA was less than or equal to 0.05 (Hu & Bentler, 1999; Yu, 2002). The GRM parameters were estimated by marginal maximum likelihood (Bock & Aitkin, 1981).
The DIF by gender was analyzed following the procedure designed by Woods (2009) for its detection. DIF was first tested by applying the modified Wald test (Cai, 2012; Cai et al., 2011; Langer, 2008) to each SEB item, considering remaining items as anchors. Thus, the possibility that some items could exhibit DIF was explored. Then, a second analysis was performed, specific for one item with potential DIF. For this, both groups -women and men- were anchored with one item which was presumed free of DIF. The goal of this second step was to identify a group invariant designated anchor item that more accurately produced Wald's statistic test results than those using all other items as anchors (Woods, 2009).
Since a unidimensional IRT model was implemented, only the latent trait θ was considered to be empathic behavior. The model calculated, for each item, a slope parameter a and five threshold parameters b m , given that there were six response options. Higher parameters a reflected a greater strength of the relationship between each item on the SEB scale an the latent trait empathic behavior.
Once the GRM was found tenable and DIF was not present, the item information function (IIF) was computed for each item to indicate how much reliable information each item was able to provide to the measurement of the latent trait of empathic behavior. Also, the reliability of the SEB was assessed in the framework of the IRT by the test information function (TIF).
Results
Assessment of GRM Assumptions
The EFA on the eight items that make up the SEB indicated that the advised number of dimensions was one. This satisfied the requirement for the presence of a single preponderant factor. Bartlett's statistic = 2399.5 (df = 28; p = 0.000010) and Kaiser-Meyer-Olkin (KMO) test = 0.86926 showed that the correlation matrix could be factorized. The cumulative proportion of variance of the first eigenvalue was 0.4925.
With respect to local independence, the Chen and Thissen's x2 ld statistic took values for each pair of items between -0.8 and 6.8, lower than the limit value of 10. Therefore, the pairs of items were considered sufficiently locally independent to implement the GRM.
Assessment of Differential Item Functioning for Gender
Table 1 shows DIF analysis of the SEB. There is no DIF by gender.

Graded Response Model Item Parameters Estimation
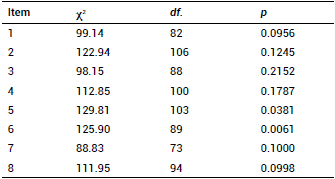
The global assessment (M 2 = 829.24, df = 692, p = 0.0001, RMSEA = 0.02) was adequate. The individual assessment of each item to the GRM indicated that the item 6 didn't fit the GRM (p < 0.01). To ensure the appropriate implementation of the GRM to the data, item 6 was excluded from the analysis (Toland, 2014). Table 2 summarizes the item level fit results.
The results of the item parameters obtained with the GRM are shown in Table 3. Overall, the items traverse a wide portion of the latent trait, from -4.05 (b 1 item 1) to 2.01 (b 5 item 2).
Table 3 Graded response model parameter estimates for the SEB.
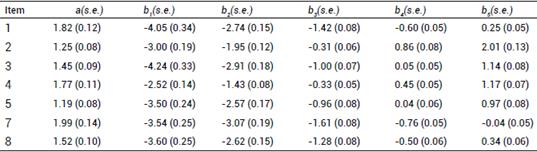
Note. a refers to the slope parameter; b 1, ... b 5 refer to the five threshold parameters; s.e. refers to the standard error.
With respect to a parameters, they had values from 1.19 to 1.99, which represents a high capacity of the response categories to distinguish between participants with different trait levels according to the criteria of Reise and Waller (1990).
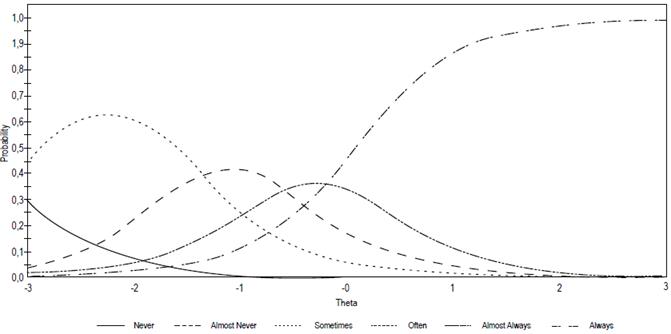
By way of illustration, the ICCCs of items 2 and 7 are shown in Figures 1 and 2, respectively. With respect to item 2, the distance between the b m was wide, allowing the discrimination between different levels of empathic behavior and each of the response categories. However, since the α parameter was comparatively low and its b m was far between, the general discriminative capacity of the item was relatively low. A middle level is needed in the feature to select Often or a higher category. With respect to item 7 it is possible to indicate that, although a parameter is very high, this discriminatory capacity occurs at the medium-low and low levels of the trait. A medium level of empathic behavior is enough to make it much more likely to choose the category than the other response options.

Figure 1 Graded Response Model Item Category Characteristic Curves for Item 2. Theta: level of empathie behavior on the latent trait continuum.
Item Information Function and Test Information Function
Table 4 shows values derived from the IIF and FIT for some levels of empathic behavior trait. As we can observe, the test, and most of the results, are more informative for middle and low levels of the trait, where the standard error (SE) in the measurement is less than that of the higher levels. Items 3 and 4 provide more information at a positive level of the trait. The SE increases with higher levels of the trait, where both the reliability and the level of information that the test offers diminish.
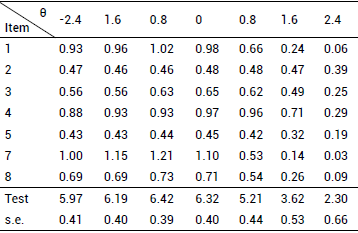
Figure 3 displays the TIF. For the GRM, the TIF reached its maximum value of 6.45, in which θ = -0.40 with a minimum s.e. value of at this point of 0.39. The level of information held relatively constant through the low and mid-levels of the trait, decreasing considerably in the high levels.

Discussion
Empathic behavior develops around the second year of life, based on children's capacities to distinguish between themselves and others (Decety & Meyer, 2008) and regulate their own negative emotions (Paulus, Kühn-Popp, Licata, Sodian, & Meinhardt, 2013). The comfort dimension of prosocial conduct defined by Dunfield (2014) and Warneken and Tomasello (2009) can be related to empathic behavior. Hay and Cook (2007) describe this as feelings for others, and Caprara, Steca, Zelli and Capanna (2005) call it feeling empathic with others, showing that this behavior has been described many times.
The empathic behaviors included in the criteria of the SEB, in which one comforts, assists, and emotionally supports another, are, above all, compassionate. The actions listed are part of the daily life of most of the people surveyed, and generally lead to a circle of mutual social support. Psychometric properties typical of the narrow constructs are demonstrated therein with high correlations of the items with the test (Auné et al., 2017), elevated parameters of inclination and a one-dimensional core (Reise, & Revicki, 2015).
Analysis of the SEB items with the GRM provides evidence that the SEB offers a greater level of information in the middle and low levels of the trait. The standard error grows substantially with higher levels of empathic behavior. As the level of information increases, this investigative capacity yields appropriate values for the totality of the criteria that comprise the SEB. Therefore, if new items are added to SEB to produce a favorable finding, it could be suggested that such items will uncover a high level of empathic behavior.
With respect to a detailed analysis of the items, items 1, 7 and 8 were found to be negative and offered more information in very low, low and intermediate levels of empathic behavior. Items 3, 4 and 5 yielded information in a broader range. As for item 2, it yielded relatively little information along the entirety of the scale.
The analysis presented shows the importance of performing modeling with IRT, because it provides in depth information about the psychometric attributes of each item, to detect if each has DIF, and to evaluate the relationship of each one of the response options of the Likert scale with the latent trait that it attempts to measure. DIF was not evidenced with the SEB regarding gender, indicating that comparisons of gender groups on the SEB don't contain construct irrelevant variance in this instance.
The most important limitation of the present study is the degree of specificity of the sampling. Future investigations will replicate the analysis in the general population and in other specific contexts. Also, the scale needs to include more items to better measure the top end of the scale. Additionally, some of the items could be revised as they are not always clear. Future research should include cognitive interviews and content expert reviews to build test content evidence validity for the SEB and validity evidence of response processes.


