


 English (pdf)
 Article in xml format
 Article references
 Send this article by e-mail
 Cited by SciELO
  Cited by Google
  Similars in
SciELO
Similars in
SciELO  Similars in Google
 Permalink
1. Introduction
Social isolation can be defined on the basis of objective and subjective circumstances, and both need to be taken into account. Objective Social Isolation (OSI) refers to the lack of meaningful relationships with other people (De Jong Gierveld, van Tilburg, & Dykstra, 2016). Perceived Social Isolation (PSI), a synonym of loneliness, refers to the distressing subjective experience resulting from the discrepancy between the expected social relationships and the actual ones (Perlman & Peplau, 1981), although many definitions have been proposed for this concept. Both OSI and PSI are considered to be different constructs (e.g. Perissinotto & Covinsky, 2014), as not all individuals with a limited or nonexistent social network necessarily feel lonely and, by the same logic, loneliness can be experienced despite the existence of an actual social network (De Jong Gierveld et al., 2016). It is loneliness that more strongly relates to the quality and quantity of social interactions (Hawkley et al., 2008).
A person who perceives oneself as socially isolated will suffer from greater disease prevalence and will have a lower life expectancy (Holt-Lunstad, Smith, Baker, Harris, & Stephenson, 2015). Among the diseases that are associated with loneliness we can find: Alzheimer’s disease (Wilson et al., 2007), cardiovascular disorders (Caspi, Harrington, Moffitt, Milne, & Poulton, 2006; Hawkley, Thisted, Masi, & Cacioppo, 2010; Herlitz et al., 1998; Sorkin, Rook, & Lu, 2002), and cancer (Antoni et al., 2006; Nausheen, Gidron, Peveler, & Moss-Morris, 2009). In addition, loneliness is associated with an increased risk of experiencing depressive symptoms, ideation, and suicide attempts (e.g. Van Orden et al., 2010) more strongly than OSI. Significant social bonds, on the other hand, are positively related to happiness (Auné, Abal, & Attorresi, 2017a, 2017b).
De Jong Gierveld et al. (2016) explore three major theoretical approaches to the social isolation phenomenon. First, the deficit theory (Weiss, 1973; Mikulincer & Shaver, 2008) postulates that the absence of specific social relationships gives rise to particular types of loneliness. This theory contributes Weiss (1973) classification of loneliness into two types, which is still valid today to understand this phenomenon (De Jong Gierveld et al., 2016). Weiss differentiated between emotional loneliness, determined by the absence of a source of close emotional support, like a partner or a best friend, and social loneliness, characterized by the absence of a large group of contacts or of membership to a social group, such as friends, colleagues or neighbors.
Perlman and Peplau initially proposed the second theory (1981). It postulates that the quantitative and objective lack of social relationships does not directly and inevitably lead to loneliness. The subjective evaluation of relationships and of expectations with respect to such relationships would influence the perception of loneliness. For example, Russell, Cutrona, McRae, and Gomez (2012) have recently found out that those who claimed to have fewer friendship relationships than desired were more prone to experiencing loneliness.
A third theory is based on the evolutionary approach and it postulates the existence of a genetic influence on loneliness (Cacioppo et al., 2006). From this perspective, loneliness is considered as an adaptive response to social disconnection, as it acts like an impulse to reconnect with one’s social groups. The feeling of exclusion from social groups would make genetically predisposed individuals feel vulnerable, and would generate cognitive, behavioral, and physiological responses as a way of self-protection. Such responses include hostility as well as a negative and anxious perception of others (Cacioppo & Hawkey, 2009). This way, lonely individuals could develop an OSI based on sabotaging their own opportunities to build up positive interpersonal relationships.
1.1 Measuring Loneliness
These are, by order of publication, the most relevant scales for the measurement of loneliness that exist up to date:
1.1.1 The University of California Los Angeles Loneliness Scale
(UCLA-LS, Russell, Peplau, & Ferguson, 1978; Russell, Peplau, & Cutrona, 1980; Russell, 1996). The UCLALS is considered to be unidimensional, even though it has been found out that response direction can generate methodological factors (Auné, Abal, & Attorresi, 2019). A Likert scale is used to specify the response format, with four options expressing frequency (Never, Rarely, Sometimes, Often). Three versions of the UCLA-LS have been published so far-in the years 1978, 1980 and 1996-with changes in the items’ direction and phrasing.
1.1.2 The De Jong Gierveld Loneliness Scale
(De Jong Gierveld & Kamphuis, 1985; De Jong Gierveld & van Tilburg, 1999). It is an 11-item instrument aimed at meeting the Rasch scale criteria. Evidence of unidimensionality, local independence and monotonicity is provided. Item response is dichotomous. Subsequently, a short, 6-item version of the De Jong Gierveld Loneliness Scale was developed (De Jong Gierveld & van Tilburg, 2006).
1.1.3 The Social and Emotional Loneliness Scale for Adults
(SELSA, DiTommaso & Spinner, 1993). It is a scale based on the multidimensional conceptualization of loneliness (Weiss, 1973). Emotional Loneliness is measured by means of two sub-scales, namely Family and Romantic, while Social Loneliness is evaluated by means of a unique sub-scale. Responses are obtained through a 7option Likert scale describing the level of agreement with the items’ statements. The short version of the SELSA is called SELSA-Short Version (SELSA-S) and is composed of 15 selected items from the original instrument (DiTommaso, Brannen, & Best, 2004).
Although all the scales outlined above have presented evidence of validity suitable for measuring loneliness, there are different reasons that justify the development of a new instrument. Firstly, the time that has passed since the creation of the outlined scales may have made their content outdated. Secondly, none of them was designed in a Latin American country. It is widely known that the Latin American culture is different from the Saxon culture, especially regarding the way in which social bonds are manifested and the ways of experiencing happiness (e.g. Beytía, 2016). Thirdly, there is a need to count on a short instrument with non-redundant items and of optimal psychometric quality that will allow it to be used for screening purposes in the clinical practice, detecting subjects who suffer from loneliness. Finally, the number of dichotomous options in the De Jong Gierveld Loneliness Scale may be causing information loss; on the other hand, SELSA may have too many response options. Therefore, it would be useful to develop an instrument with an optimal number of response options.
The aim of this paper is to develop a new, short, unidimensional loneliness scale, the Buenos Aires Loneliness Scale (BALS), applicable to the adult Argentine population. The scale will indicate the degree of loneliness of the people evaluated. Additionally, it is proposed to present evidence of divergent and convergent validity, as well as reliability studies, and to rule out the presence of differential item functioning (DIF) on the basis of gender.
2. Method
2.1 Participants
It was a convenience sample that comprised 509 adult participants (53% of which were female), all residents of the Metropolitan Area of Buenos Aires. The average age was 44.3 (minimum=18, maximum=78), with a standard deviation of 13. Regarding marital status, 47.2% indicated they were married or in a civil union, 25% single, 15.3% divorced, 4.7% widowed, and a 7.9% chose the option “other”.
2.2 Instruments
Sociodemographic Questionnaire. It revealed the following variables of interest: gender, age, marital status, nationality, and place of residence.
Social Bonds Questionnaire (SBQ). A survey-format questionnaire written ad hoc for the present study and composed of the following questions: a) On a scale from 1 to 10, how would you rate the level of support you receive from others in general every day? b) On a scale from 1 to 10, how would you rate the level of support you receive from others in general when you have a serious personal problem? c) On a scale from 1 to 10, how lonely do you feel in general?
Buenos Aires Loneliness Scale (BALS). Each of the items refers to a subjective perception of loneliness or companionship. Initially, a set of 40 items was developed to represent the construct. The aim was to achieve clarity, comprehensibility, relevance, and representativeness in the items’ phrasing. A Likert scale was used to specify the response format, with four options reflecting the level of agreement with the provided statement (1=Completely disagree, 2=Slightly agree, 3=Fairly agree, 4=Totally agree).
Argentine Version of the UCLA-LS (Sacchi & Richaud de Minzi, 1997). It is an adaptation to Argentine Spanish of the second version of the UCLA-LS. The authors of the adapted version used the back-translation method with two translators to obtain the Argentine version of each item. Items were administered in the same order in which Russell et al. (1980) did. Likewise, Sacchi and Richaud de Minzi (1997) specified the indexes for the adapted scale and analyzed the total score against the age and gender variables. The authors of the Argentine version did not obtain a Cronbach alpha coefficient, whereas Russell et al. (1980) reported a .94 alpha and the one in the present study was .90.
Argentine version of the Balanced Inventory of Socially Desirable Responding (Mikulic, Crespi, & Caballero, 2016). It is an adaptation into Argentine Spanish of the Balanced Inventory of Desirable Responding ([BIDR-6] Paulhus, 1988). While the original BIDR-6 consists of 40 items divided into the Self-deception and Impression Management factors, the Argentine adaptation found evidence of a unidimensional structure, and a reduction to 18 items showing psychometric adaptation was made. The response is obtained by means of a Likert scale with seven options ranging from Not True to Very True. Mikulic et al. (2016) reported a Cronbach alpha of .86 while the one in this research was of .81.
2.3 Procedure
2.3.1 Preliminary Version Development
The initial pool of 40 items was composed of original items to measure Perceived Social Isolation or loneliness as understood by Perlman and Peplau (1981). Such items were defined by means of group interviews to general adult and old age populations. It would be useful to design an instrument with an optimal number of response options. Then, the 4-option Likert response format was chosen, since various studies found that this could be an optimal number of response options (e.g. Abal, Auné, Lozzia, & Attorresi, 2017; Lozano, GarcíaCueto, & Muñiz, 2008). In Abal et al. (2017) study, it was found that the probability of choosing a central category decreases considerably when compared with the probabilities of opting for adjacent categories. Therefore, it is not relevant to include a central category. Lozano et al. (2008) carried out a simulation and discovered that with fewer than four alternatives the reliability and validity decrease.
2.3.2 Primary Refinement and Evidence of Content Validity
The initial pool of 40 items was subjected to a blind evaluation by five judges with expertise in Psychometrics, Clinical Psychology and Social Psychology. The judges evaluated the relevance of each item’s content using a three-option graduated scale. Aiken’s validity coefficient (Aiken, 1980, 1985) was used to analyze the agreement among experts and the lower limit of its Confidence Interval (CI), i.e., 90% .60, was adopted as the acceptance criterion (Soto & Segovia, 2009). Subsequently, a pilot study was carried out whereby the selected items were administered to 35 residents of the Metropolitan Area of Buenos Aires over the age of 18.
2.3.3 Refined Version Administration
The instruments were administered through the Google Forms online platform, together with an informed consent, indicating that participation was voluntary. It was explained that results would be used exclusively for research and that anonymity was guaranteed. No time limits or rewards were used to encourage participation.
3. Data Analysis
3.1 Statistical Descriptions
The following statistical descriptions were calculated for each item: mean (M), standard deviation (StDev), asymmetry (As), and kurtosis (K). In addition, Mardia’s indexes (1970) of asymmetry and kurtosis were calculated to determine whether the data followed multivariate normality. Mardia’s indexes were calculated using the MVN package of the R statistical software (Korkmaz, Goksuluk, & Zararsiz, 2014).
3.1 Exploratory Factor Analysis
The exploratory factor analysis (EFA) method was applied by means of the Factor 10 software (Ferrando & Lorenzo-Seva, 2017), and the feasibility of carrying out analysis through the Kaiser-Meyer-Olkin (KMO) coefficient test and the Bartlett sphericity test was confirmed. Since the data did not follow multivariate normality, the factor extraction was carried out through the Robust Unweighted Least Squares method (RULS), with bootstrap sampling. The RULS method was based on the polychoric correlations matrix due to the responses’ ordinal character (Ferrando & Lorenzo-Seva, 2014). The unidimensionality of the dataset was assessed through optimal parallel analysis (Timmerman & Lorenzo-Seva, 2011). This factor is related to the general perception of loneliness.
On the basis of the EFA results, items containing one or more of these criteria were dismissed: a) Excessive asymmetry and kurtosis; b) High standardized residuals (greater than 2.58 as suggested by Hair, Anderson, Tatham, & Black, 1999); and c) Weighing under .40. In order to evaluate the resulting model after item refinement, the goodness of fit (GFI), the root mean square residual (RMSR), the Tucker-Lewis index (TLI), and the root mean square error of approximation (RMSEA) were observed.
With the purpose of studying the BALS reliability, the ordinal alpha, the attenuation index (Domínguez Lara, 2018), the Cronbach alpha index, and the omega coefficient were obtained. It was verified that these indexes would not increase when removing any of the items selected for the scale.
3.3 Validity Studies
In order to obtain evidence of convergent validity, the BALS scores were correlated with scores from the Argentine version of the UCLA-LS and with the answers to questions a), b), and c) from the SBQ. On the other hand, divergent validity was evaluated by correlating the BALS scores with scores in the Argentine version of the Balanced Inventory of Socially Desirable Responding. Correlations were made with Spearman’s nonparametric coefficient (Badii, Guillen, Lugo, & Garnica, 2014).
3.4 Differential Item Functioning Analysis
The existence of gender-based DIF implies that women and men with the same level of loneliness have a different probability of giving a certain response for any of the BALS items. This would be a serious threat against the validity of the unidimensional scale. To determine the presence of DIF, the modified Wald test (Cai, 2012; Cai, Thissen, & du Toit, 2011; Langer, 2008) was applied to each item, considering the rest of them as anchors. The modified Wald test was calculated on the basis of the items’ parameters for each gender, which were estimated using the graded response model ([GRM] Samejima, 1969) of the item response theory (IRT). Estimates were made using the IRTPRO 4.2 software (Cai et al., 2011), and also verifying the GRM assumptions.
4. Results
4.1 Primary Refinement
Expert judgment enabled the refinement of 24 items on which an acceptable degree of agreement was not registered, either because of relevance as an indicator of the loneliness construct or because of the clarity in their phrasing. If at least two of three judges indicated that the item was not clear or relevant, it was eliminated. Table 1 shows Aiken’s validity indexes for three categories calculated for the 16 selected items with their respective confidence intervals. With respect to the pilot test, there was no need of making any changes because no difficulties were detected in understanding the content of the items or the administration instructions. The procedures performed during this primary refinement provided enough validity evidence both in the content area and in a formal area (apparent validity). For apparent validity, the opinion of the persons evaluated about the quality of the items was included.
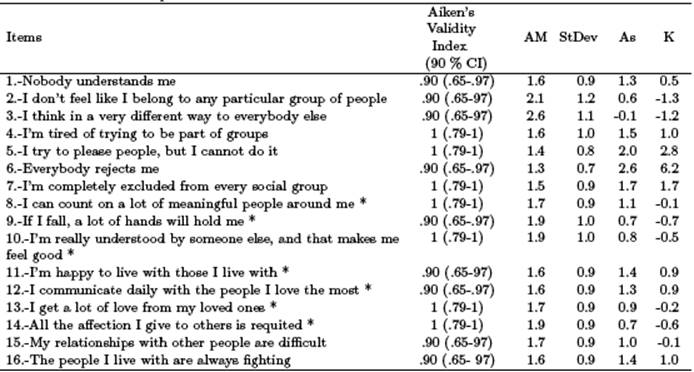
4.2 Statistical Descriptions
The results of Mardia’s test indicated that the data do not follow multivariate normality (Mardia’s index, Asymmetry: χ 2 = 4592.24, p < .0001; Mardia’s index, Kurtosis: z = 65.96, p < .0001). Table 1 shows Aiken’s validity index and statistical descriptions for the 16 administered items:
4.3 Exploratory Factor Analysis
First, an EFA was performed on the 16 administered items. It indicated EFA was feasible since the KMO coefficient=.91 with a bootstrap Confidence Interval [CI] at 95%=(.91 .93) and Bartlett’s sphericity test: χ 2(120) = 3709; p = .00001. The result of the optimal parallel analysis indicated that the unifactorial structure was relevant. This main factor explained the 51% variance. Subsequently, nine items meeting the elimination criteria were progressively ruled out.
A new EFA was performed on the seven selected items, which were 1, 2, 3, 4, 7, 10, and 15. The KMO coefficient was of .85 and the Bartlett sphericity test yielded the following values: χ 2(21) = 953; p < .000001. The main factor explained the 57% variance, and the highest standardized residual was 1.81. The first eigenvalue was 3.58, and all the others were less than one, thus meeting Kaiser’s criteria. Factor loads of the non-rotated matrix were at least of .547. Regarding adjustment indexes, they yielded the following values: GFI=.996 with a bootstrap CI of 95%=(.994 .998); RMSR=.0429 with a bootstrap CI of 95%=(.027 .050); TLI=.993 with a bootstrap CI of 95%=(.988 1.001); and RMSEA=.042 with a bootstrap CI of 95%=(.0038 .0547). These results can be interpreted as an optimal adjustment of the model to the dataset.
As for internal consistency indexes, the following values were found: the Cronbach alpha was of .80 with a bootstrap CI of 95%=(.78-.83); the ordinal alpha was .87 with a bootstrap CI of 95%=(.86-.89); and the attenuation index was 8% and the omega coefficient was of .81 with a bootstrap CI of 95%=(.78-.84). This means that the BALS internal consistency is very good and the Cronbach alpha is not significantly distorted, as the attenuation index is lower than 30% (Domínguez Lara, 2018).
4.4 Studies on Convergent and Divergent Validity
Regarding the validity evidence for the scale, Spearman’s correlation between the BALS scores and the UCLA-LS scores was positive, high, and statistically significant. The correlation of the BALS scores with questions a) and b) of the SBQ (oriented toward the extreme of companionship) was small-moderate, negative, and statistically significant. And the correlation of the BALS scores with question c) of the SBQ (oriented toward the extreme of loneliness) was small-moderate, positive, and statistically significant. Finally, the correlation of the BALS scores with the Argentine Version of the Balanced Inventory of Socially Desirable Responding was approximately null and not statistically significant. These results can be appreciated in Table 2.

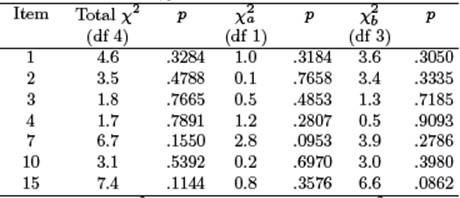
4.5 Analysis of Gender-Based Differential Item Functioning
Table 3 shows the DIF analysis results and the modified Wald test p values associated with the statistical descriptions were not significant, what means that all items are free of gender-based DIF.
5. Discussion
This study introduced the development of a new scale to measure loneliness in adults, applicable in principle to the Argentine population, although there is a possibility of adapting it to other countries and cultures. Successive refinements enabled the selection of seven items with very adequate psychometric properties that formed the new scale, named BALS. At first, five expert judges selected 16 items from the initial pool of 40 items. Then, on the basis of the EFA results, seven of these 16 items were selected. Subsequent analyses proved the quality of these items, since they showed the following: validity evidence based on their internal structure, none of them presents DIF, and good internal consistency as per the Cronbach alpha and ordinal alpha.
Through the BALS, loneliness has been operationalized with a short unidimensional scale suitable for its inclusion in extensive protocols. Six of the items are directly oriented toward loneliness and express feelings and thoughts of exclusion and isolation, while one item is oriented towards companionship. The direct orientation seems to be, in the case of the Argentine population, more appropriate to evaluate the construct.
The high correlation of the BALS scores with the Argentine version of the UCLA-LS allows us to conclude that they might be measuring the construct in a relatively similar way. As was expected, BALS scores were negatively associated with questions a) and b) of the SBQ, dealing with the subjective perception of companionship, and positively associated with question c) of the SBQ, related to the subjective perception of loneliness. The lack of correlation with the scores in the Argentine Version of the Balanced Inventory of Socially Desirable Responding would indicate that the BALS scores are not sensitive to social desirability.
6. Conclusions
The BALS can be mainly used for research and intervention in clinical and social psychology. In the first case, the detection of the patient’s level of loneliness is necessary for correct diagnosis and treatment, enhancing signifycant social bonds or creating new ones, thus generating new socialization opportunities. In the second case, the investigation of the relationship between loneliness and other variables is very broad: from life quality factors, social media characteristics, environmental, and genetic influences, to the interaction with diseases classically conceived as physical (Holt-Lunstad et al., 2015).
In future investigations, samples of specific groups that meet certain characteristics such as poverty or ageing will be surveyed to account for possible differences with the general population scores. In addition, the BALS will be fully modeled with the GRM of the IRT, which will allow us to know the scale’s accuracy and the effectiveness of each of the response categories, in order to evaluate the different loneliness levels experienced by participants.

