


 English (pdf)
 Article in xml format
 Article references
 Send this article by e-mail
 Cited by SciELO
  Cited by Google
  Similars in
SciELO
Similars in
SciELO  Similars in Google
 Permalink
1. Introduction
Executive functioning is an umbrella term that refers to high-level cognitive processes that have a more coordinating and controlling role during other cognitive operations such as initiation, planning, and inhibition (Gilbert & Burgess, 2008; Sohlberg & Mateer, 2017). Recently, within the scope of cognitive hearing sciences, attention is given on how executive functions play an essential role during speech understanding in noisy listening conditions. Poor executive functioning, and in particular poor inhibition, seems to lead to an increased susceptibility to background noises ( Janse, 2012) and will make it harder to successfully select the target signal (e.g. speakers voice) within a noisy environment (Sommers & Danielson, 1999). Hence, evaluating executive functions, and particularly cognitive inhibition, is essential for an optimal diagnosis of speech understanding in noise.
The visual Stroop test can be considered the most clinically used test to measure cognitive inhibition and flexibility. Numbers of versions of this visual Stroop test exist ( Jensen & Rohwer Jr, 1966), all involving (1) a baseline task, requiring to identify the color of nonword stimuli, and (2) an interference task, requiring to identify the color of color names printed in contrasting or non-contrasting colors. Hence, the interference task requires ignoring and suppressing the automatic reading response while attending and responding to the more effortful color-naming. An interference score between baseline and interference task is calculated as a measurement of cognitive inhibition and flexibility.
Due to the contribution of, among other things, cognitive inhibition during speech understanding, a growing interest in implementing cognitive tests within cognitive hearing sciences has been observed. Generally, significant more visual cognitive testing was performed compared to verbal cognitive testing ( Dryden et al., 2017; Kestens, Degeest, & Keppler, 2021). While visual cognitive testing presents an interesting alternative to rule out the negative impact of hearing loss on the perception of verbal test items, it is important to consider the difference in construct validity between visual and verbal cognitive testing within a hearing-related context. Hearing rehabilitation aims to improve everyday speech communication. In this respect, examining cognition through visual testing is likely not serving the purpose due to a lack of construct validity (Shen et al., 2020). Hence, the commonly used visual Stroop test might not be the most salient test within cognitive hearing sciences.
Several auditory variants of the visual Stroop test (i.e., later denoted as auditory Stroop test) exist and have been used in numerous study domains related to social psychology, cognitive-motor dual-task paradigms, emotional development, and speech understanding (Danneels et al., 2020; Knight & Heinrich, 2017; Most et al., 2007; Strouwen et al., 2016; Wurm et al., 2004; Zekveld et al., 2020). As with the visual Stroop test, congruent and incongruent auditory stimuli were used in order to create auditory processing challenges. Generally, it is required to respond quickly and accurately to a specific perceptual feature of a word (e.g., gender, location, or pitch) while ignoring other conflicting information (e.g., ‘male’ spoken by a female, ‘left’ heard in the right ear, and ‘high’ pronounced at a low pitch).
One study already revealed a positive relation between auditory Stroop scores and speech-in-noise performances (Knight & Heinrich, 2017). The usage of an auditory Stroop test within cognitive hearing sciences seems to have significant potentials. Nonetheless, the auditory Stroop test is barely used within cognitive hearing sciences. The latter might be related to limited research regarding its cognitive construct, since it can be questioned whether the auditory Stroop test can be considered a good test to measure cognitive inhibition and flexibility using auditory stimuli. Moreover, knowledge regarding the effect of possible influencing factors such as age, sex, educational level, awakeness, and hearing sensitivity is scarce. However, these variables have been demonstrated to significantly affect cognitive outcomes. First, it is well-known that cognition decreases with increasing age (e.g., Baltes & Lindenberger, 1997; Grassi & Borella, 2013; Harrington et al., 2017). Second, previous research indicated a sex difference favoring females in verbal processing tasks (e.g., Lewin et al., 2001; Majeres, 1997). Third, higher education was associated with better cognitive functioning (e.g., Ardila et al., 2000; Zahodne et al., 2015). Fourth, lower awakeness seemed to be related to decreased cognitive functioning (e.g., Kronholm et al., 2009). Last, there appears to be a link between age-related hearing loss, on the one hand, and accelerated cognitive decline (e.g., Fischer et al., 2016) and dementia (e.g., Deal et al., 2017; Gallacher et al., 2012; Livingston et al., 2017), on the other hand.
The purpose of the current study was fourfold. First, an auditory Stroop test implementable in cognitive hearing sciences was developed. Second, the effect of several independent variables (i.e., age, sex, educational level, awakeness, and hearing sensitivity) on the outcomes of the auditory Stroop test was examined. Hence, more insight into the auditory Stroop test and its influencing factors could be gained. Third, the relationship between the auditory Stroop test and other cognitive functions such as working memory and processing speed was examined. Specifically, working memory and processing speed were administered visually and verbally, attempting to examine if the auditory Stroop test relies on auditory processing of the test items and, thus, might be considered as a good test to measure cognitive inhibition and flexibility using auditory stimuli. Fourth, normative data of the developed auditory Stroop test were obtained in a group of adults ranging from 18 to 69 years of age.
2. Methods
This study was approved by the local Ethics Committee and was conducted in accordance with the Helsinki Declaration. Prior to participation, an informed consent was signed.
2.1 Participants
A detailed description of the study population is shown in Table 1. The study population consisted of 178 participants ranging from 18 to 69 years of age. All participants had at least 12 years of education (i.e., high school graduate). Moreover, normal or corrected-to-normal nearfield vision was assured according to the Near Vision Snellen Eye Chart ( Snellen, 1873). None of the participants had self-reported tinnitus, learning disorders, attention deficits, psychiatric disorders, or neurological disorders. Furthermore, the Montréal Cognitive Assessment was carried out in participants aged 60 years or older. Participants who scored 25 or less on the Montréal Cognitive Assessment were excluded in order to eliminate participants with a risk for cognitive impairment (Nasreddine et al., 2005). Participants awakeness was evaluated using a visual analogue scale ranging from 0 (tired) to 10 (totally awake). Finally, hearing sensitivity was evaluated using standard audiological tests, conform to the International Organization for Standardization (ISO) 8253-1 guidelines (ISO 2010), to ensure normal age-related hearing with symmetrical hearing thresholds in both ears equal to or better than the 95th percentile for ageand sex-adjusted thresholds norms for all octave frequencies between 0.125 and 8.00 kHz (ISO 7029, 2017). Hearing sensitivity was calculated as the average of the thresholds at .125, .25, .50, 1.00, 2.00, 4.00, and 8.00 kHz of participants’ best ear.
2.2 Test procedure
All testing was performed in a quiet room illuminated with standard room and daylight. In order to rule out any order effect, a randomization was used to determine the test sequence of the three cognitive tests: the backward corsi tapping task (visual working memory and processing speed), the letter-number sequencing task (verbal working memory and processing speed), and the auditory Stroop test (verbal executive functioning, and in particular verbal cognitive inhibition and flexibility).
Backward corsi tapping task: A digital version of the existing corsi block tapping task (WAIS-III-NL) was developed using the E-prime 2.0 software. Hence, identical stimulus presentation and automatic data collection were guaranteed (Brunetti et al., 2014). The corsi raster was shown on a white standard computer screen. Within this raster, series of identical blue filled circles appeared for 1 s each with an interstimulus interval of 1 s. Participants had to memorize the quadrangles in which circles appeared and had to indicate the position in reverse order by clicking the quadrangles on the computer screen using a wireless computer mouse. It was obligated to click the correct amount of quadrangles, even if guessing was necessary. Participants were instructed to accomplish this task as accurately and as quickly as possible. The span length increased successively from two to eight appearing circles. Two trials were given per sequence of the same span length. If at least one of the two trials per sequence of the same span length was correct, the next two trials of a sequence of an increased length were administered. Two errors of the same span length resulted in termination of the task.
Participants were seated on a chair in front of the computer screen at an individually determined distance in order to guarantee an optimal operation of the wireless computer mouse. At the beginning of the test, a practice trail was performed in order to check participants computer skills and to verify if the quadrangles could clearly be distinguished on the computer screen. One participant did show insufficient computer skills and, thus, this participant’s obtained scores were not included in further analysis of the backward corsi tapping task.
Three measures were determined to analyze visual working memory, namely span length (range: 2-8), raw score (range: 0-14), and product score (range: 0-112) (Kessels et al., 2008; Kestens, Degeest, Miatton, et al., 2021). To measure visual processing speed, the time clicking the last and first quadrangle was registered, using the E-prime 2.0 software. For each span length, the best performance of correctly solved trials was utilized in further analysis (Kestens, Degeest, Miatton, et al., 2021).
Letter-number sequencing task: The letter-number sequencing task (WAIS-IV-NL) contains combinations of letters and numbers presented through live voice by a native Flemish speaker, at a normal speech rate and normal loudness. Participants were instructed to recall the numbers in ascending order, followed by the letters in alphabetical order as accurately and quickly as possible. The span length successively increases from two up to eight. Span length (range: 2-8), raw score (range: 0- 30), and product score (range: 0-240) were determined to analyze verbal working memory capacity (Kessels et al., 2008; Kestens, Degeest, Miatton, et al., 2021). Verbal processing speed was determined by measuring the time necessary to formulate an answer after the task was given by the investigator using a stopwatch. Immediately after the task was given, the start button was pressed. The stop button was pressed when participants had formulated an entire answer or had indicated to have forgotten the right sequence. The best item out of the correctly solved items per span length was included in further analysis (Kestens, Degeest, Miatton, et al., 2021).
Table 1 The mean, standard deviation (SD), and range per decade and for males and females of the following variables: age (years), educational level (years), awakeness (visual analogue scale: 0 = tired; 10 = totally awake), and hearing sensitivity (decibel, dB HL)
| Age (years) | Educational level (years) | Awakeness | Hearing sensitivity (db HL) | ||||||
| Decade | N | Mean (SD) | Mean(SD) | Range | Mean(SD) | Range | Mean(SD) | Range | |
| 18-19 | Total (n = 52) | 23.2(3.1) | 15.7(1.9) | 12.0-19.00 | 7.8(1.2) | 5.0-10.0 | 2.94(3.79) | -7.86-13.57 | |
| Male (n = 22) | 23.8(3.4) | 15.7(2.2) | 12.0-19.0 | 8.2(1.4) | 5.0-10.0 | 2.53(4.13) | -7.86-10.0 | ||
| Female (n = 30) | 22.8(3.4) | 15.8(1.7) | 12.0-19.0 | 7.5(0.9) | 6.0-9.0 | 3.24(3.56) | -2.86-13.57 | ||
| 30-39 | Total (n = 31) | 33.9(2.8) | 16.1(3.5) | 12.0- 23.0 | 7.7(1.4) | 5.0-10.0 | 3.53(3.14) | -1.43-13.57 | |
| Male (n = 15) | 34.0(2.8) | 14.8(2.7) | 12.0-21.0 | 7.4(1.4) | 5.0-10.0 | 4.24(3.45) | 0.71-13.57 | ||
| Female (n = 16) | 33.7(2.9) | 17.4(3.7) | 12.0-23.0 | 8.0(1.4) | 5.0-10.0 | 2.86(2.76) | -1.43-7.86 | ||
| 40-49 | Total (n = 31) | 44.2(3.5) | 15.0(1.9) | 12.0-19.0 | 7.9(1.1) | 6.0-10.0 | 4.42(2.28) | 0.71-8.57 | |
| Male (n = 15) | 42.5(3.0) | 15.3(2.2) | 12.0-19.0 | 7.8(0.9) | 6.0-9.0 | 4.38(2.41) | 0.71-8.57 | ||
| Female (n = 16) | 45.8(3.1) | 14.9(1.6) | 12.0-17.0 | 8.0(1.2) | 6.0-10.0 | 4.46(2.24) | 1.43-8.57 | ||
| 50-59 | Total (n = 34) | 54.0(2.6) | 15.2(1.9) | 12.0-19.0 | 8.2(0.9) | 6.0-10.0 | 10.13(5.49) | 0.71-27.14 | |
| Male (n = 15) | 54.9(2.6) | 14.5(2.0) | 12.0-17.0 | 8.3(0.7) | 7.0-9.5 | 13.38(5.79) | 0.71-27.14 | ||
| Female (n = 19) | 53.3(2.4) | 15.8(1.6) | 12.0-19.0 | 8.1(1.1) | 6.0-10.0 | 7.56(3.67) | 2.14-15.00 | ||
| 60-69 | Total (n = 30) | 63.9(2.8) | 14.5(1.8) | 12.0-18.0 | 8.6(1.2) | 5.0-10.0 | 12.98(5.46) | 2.86-24.29 | |
| Male (n = 15) | 63.8(2.7) | 14.9(2.1) | 12.0-18.0 | 8.8(1.2) | 5.0-10.0 | 11.90(5.41) | 3.57-23.57 | ||
| Female (n = 15) | 64.1(3.0) | 14.0(1.4) | 12.0-16.0 | 8.4(1.3) | 5.0-10.0 | 14.05(5.47) | 2.86-24.29 | ||
Auditory Stroop test: The developed auditory Stroop test was a new Stroop variant and consisted of two tests. During the first baseline test -further denoted as Stroop-tones-, a high and low pure-tone (stimulus duration: 690 ms) were presented in a random order. The pitch of the high and low pure-tone was 448 Hz and 187 Hz, respectively. Participants were instructed to respond rapidly and accurately to the presented high and low pure-tones by saying ‘high’ or ‘low’. Immediately after a response was given, the next stimulus was presented. During the second test -further denoted as Stroop-words-, the words ‘high’ and ‘low’, both pronounced at a high or low pitch by a female Flemish speaker, were presented in random order. The speech material was recorded using an external microphone (Samsung C01U PRO) and Praat software at a sampling rate of 44100 Hz. The stimulus duration (690 ms) and fundamental frequency of the high and lowpitched voice (i.e., 448 Hz and 187 Hz, respectively) were the same to those used in Stroop-tones. Participants were instructed to identify rapidly and accurately the pitch of the spoken word (e.g. the word high pronounced at a low pitch, correct answer: low). The next stimulus was presented immediately after a response was given.
For Stroop-tones and Stroop-words, the total test duration was 45 seconds, after which the total amount of correct responses was calculated (i.e., total amount of responses minus wrong responses) (Golden, 1975; Kemper et al., 2009). The maximum amount of presented stimuli was 50, in which an equal distribution of highand low-pitched stimuli was guaranteed ( Shor, 1975). Specifically, Stroop-tones consisted of 25 high-pitched and 25 low-pitched pure tones, whereas Stroop-words consisted of 25 high-pitched words (13 times the word ‘high’, 12 times the word ‘low’) and 25 low-pitched words (12 times the word ‘high’ and 13 times the word ‘low’), which were all presented in random order.
Table 2 A description of all univariate analyses between the independent variables and Stroop-tones, Stroop-words, and Stroop interference score. The mean and standard deviation (SD) were given for all independent variables
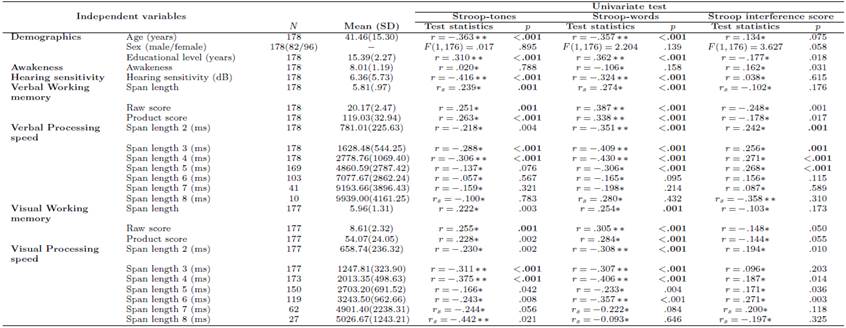
Note. −not applicable; *weak correlation; **moderate correlation; ***strong correlation; p ≤ .002 = significant as indicated in bold
Participants were seated at 0◦ azimuth at a distance of 90 cm from a loudspeaker (Bose, companion 2 series III) in order to maximize the direct-to-reverberant ratio. The equipment was calibrated using a 2250-B Bruël and Kjaer real time sound analyzer (Brüel & Kjaer, Denmark) to guarantee a sound level of 65 dB SPL. Prior to testing, a practice trial for Stroop-tones and Stroopwords was performed in order to verify whether the task was understood. If not, additional instructions were given until the participants fully understood the task.
Verbal executive functions were calculated by means of a Stroop interference score: the lower the interference score, the better the executive functions. The Stroop interference score=100 ([correct responses Stroop-tones- correct responses Stroop-words]/correct responses Stroop-tones) (Kemper et al., 2009).
2.3 Statistical Analysis
Statistical analysis was performed using IBM SPSS version 24. Several analyses were performed to determine significant predictors of Stroop-tones, Stroop-words, and the Stroop interference score. First, univariate analyses were performed to evaluate the effect of several independent variables on Stroop-tones, Stroop-words, and Stroop interference score. More specifically, the 25 independent variables included participants demographics (age, sex, and educational level), awakeness, hearing sensitivity, verbal and visual working memory (span length, raw score, and product score), and verbal and visual processing speed (best performance at each span length). Depending on the normality distribution of the data, a Pearson or Spearman correlation coefficient was calculated for continuous variables. To interpret the correlation coefficients, the following guidelines were used: a weak correlation for values between .00-.29, a moderate correlation for values between .30-.49, and a strong correlation for values greater than .50 (Cohen et al., 2013). For categorical variables, an independent samples t-test was performed. For all univariate analyses, a p-value of 0.002 (α = .05/25) was considered as criterion of statistical significance, taken into account the Bonferroni correction for multiple comparisons.
Second, variables showing a significant association with Stroop-tones, Stroop-words, or the Stroop interference score were subjected to stepwise multiple regression analyses. These analyses aimed to identify the most important predictor of each individual category. In particular, a stepwise multiple regression model for demographics, verbal working memory, verbal processing speed, visual working memory, and visual processing speed was performed for Stroop-tones, Stroop-words, and Stroop interference score separately. For the categories awakeness and hearing sensitivity no stepwise multiple comparison could be performed, since these categories exist of only one variable. Hence, based on the outcome of the univariate analyses, maximal fifteen different step-wise multiple regression analyses could be performed. Once the most important predictors were selected, the third step of the statistical analysis was performed, aiming to analyze if the auditory Stroop test relies on auditory processing. Therefore, hierarchical multiple regression analyses were performed in order to determine if the prediction of Stroop-tones, Stroop-words, and Stroop interference score could benefit from the addition of visual processing speed to verbal processing speed, visual working memory to verbal working memory, and both vice versa, which resulted in twelve hierarchical multiple regression analyses. Hence, all possible combinations were evaluated to fully understand the influence of a specific cognitive function to the model.
Based on these hierarchical models, the most important modality of working memory and processing speed was selected: visual, verbal, or visual and verbal. Subsequently, all determined predictors were combined in a final standard multiple regression model for Stroop-tones, Stroop-words, and the Stroop interference score. Prior to analyze all regression analyses, assumptions were checked. Independence of residuals was assessed by a Durban-Watson statistic of approximately 2 (Laerd Statistics, 2015). Multicollinearity was evaluated by means of correlation descriptors and variance inflation factor. More specifically, the correlations between the independent variables should be less than .7 (Laerd Statistics, 2015), and the variance inflation factor should be less than five (Menard, 2002).
Finally, normative data for Stroop-tones, Stroop-words, and the Stroop interference score were calculated. More specifically, the mean, standard deviation, 5th, 10th, 20th, 30th, 40th, 50th, 60th, 70th, 80th, and 90th percentiles were measured.
3. Results
Table 2 presents the mean and standard deviation of all independent variables, as well as a detailed description of all univariate analyses between the independent variables and Stroop-tones, Stroop-words, and the Stroop interference score. All significantly correlated variables were entered into stepwise multiple regression analyses, aiming to identify the most important predictor(s) of each individual category. The assumptions for conducting stepwise multiple regression were met for all analyses, except for those involving verbal and visual working memory. The latter showed correlations above .7 between span length and raw score (verbal r = .785, visual r = .913), span length and product score (verbal r = .985, visual r = .965), and raw score and product score (verbal r = .923, visual r = .972). As a result, all analyses involving verbal or visual working memory showed a variance inflation factor above 5, indicating multicollinearity. Hence, no stepwise multiple regression analysis was performed within the category of visual and verbal working memory. Within all other categories (participants’ demographics, visual processing speed, and verbal processing speed) stepwise multiple regression analyses were performed of which the results are presented in tables 3, 4, and 5 for Stroop-tones, Stroopwords, and Stroop interference score, respectively.
Table 3 Stepwise Multiple Regression Analysis of the Variables that were Found to Have a Significant Univariate Relationship with Stroop-tones.
| Variable | B | SE B | β | t | p | F | R2 | R2 adjusted |
| Model 1: demographics | - | - | - | - | <.001 | 20.719 | .191 | .182 |
| Significant predictors | ||||||||
| - Age | -.097 | .021 | -.315 | -4.547 | <.001 | - | - | - |
| − Educational level | .519 | .145 | .249 | 3.593 | <.001 | - | - | - |
| Excluded variables | ||||||||
| - | - | - | - | - | - | - | - | - |
| Model 2: verbal processin speed | - | - | - | - | <.001 | 12.244 | .123 | .113 |
| Significant predictors | ||||||||
| − Span length 3 | -.002 | .001 | -.190 | -2.412 | .017 | - | - | - |
| − Span length 4 | -.001 | .000 | -.222 | -2.813 | .005 | - | - | - |
| Excluded variables | ||||||||
| - | - | - | - | - | - | - | - | - |
| -Model 3: visual processing speed | - | - | - | - | <.001 | 28.008 | .141 | .136 |
| Significant predictors | ||||||||
| − Span length 4 | -.004 | .001 | -.375 | -5.292 | <.001 | - | - | - |
| Excluded variables | ||||||||
| − Span length 2 | - | - | -.043 | -.523 | .602 | - | - | - |
| − Span length 3 | - | - | -.060 | -.572 | .568 | - | - | - |
Note. B=unstandardized regression coefficient; SE B=standard error of the coefficient; β=standardized coefficient; R 2=coefficient of determination; −=not applicable; p ≤ .05=significant as indicated in bold.
Based on the univariate and stepwise analyses, the best predictors for Stroop-tones, Stroop-words, and the Stroop interference score were determined. More specifically, age and educational level were the best predictors for participants’ demographics but only for Stroop-tones (F [1, 176] = 20.719, p <.001, R 2 = .182) and Stroop-words (F [1, 176] = 24.204, p < .001, R 2 = .208). Hearing sensitivity was also determined as an important predictor for solely Stroop-tones (r = .416, p < .001) and Stroopwords (r = .324, p < .001). Regarding verbal and visual working memory, raw score was the best predictor, since compared to span length and product score, the highest correlations were observed between raw score and Stroop-tones (visual: r = .255, p = .001; verbal: r =.251, p = .001), Stroop-words (visual: r = .305, p < .001; verbal: r = .387, p < .001), and Stroop interference score (visual: r = .148, p = .050; verbal: r = .248, p = .001). For verbal and visual processing speed, processing speed at span length four was the best predictor for Strooptones, Stroop-words, and Stroop interference score. First, four out of the five stepwise multiple regression models selected processing speed at span length four as a significant predictor (Tables 3 to 5). Moreover, univariate analyses showed the strongest correlations at span length four (Table 2). Last, span length four was the highest span length at which all participants succeeded the trial (Table 2). Hence, span length four was considered the best balance between too easy and too difficult, and thus, seemed the best predictor.
The selected predictors (i.e., age, educational level, hearing sensitivity, raw score of visual and verbal working memory, and visual and verbal processing speed at span length four) were subjected to hierarchical multiple regression. In all hierarchical models age, educational level, and hearing sensitivity were the basic model to which the effect of adding visual to verbal working memory (Table S1), verbal to visual working memory (Table S2), visual to verbal processing speed (Table S4), or verbal to visual processing speed (Table S3) was examined. Overall, the results of the hierarchical multiple regression analyses showed the greatest changes in the coefficient of determination when adding verbal working memory (∆R 2 ranges from .013 to .059) or verbal processing speed (∆R 2 ranges from .023 to .074) to the model than when visual working memory (∆R 2 ranges from .003 to .015) or visual processing speed (∆R 2 ranges from .014 to .037) were added. Hence, three standard multiple regressions were run to predict Stroop-tones, Stroop-words, and Stroop interference score from age, educational level, hearing sensitivity, verbal working memory, and verbal processing speed. The multiple regression models statistically significantly predicted Stroop-tones (F [5, 172] = 12.086, p < .001, adjusted R 2= .238), Stroop-words (F [5, 172] = 16.225, p <.001, adjusted R 2=.301), and the Stroop interference score (F [5, 172] = 4.175, p = .001, adjusted R 2=.082). Regression coefficients and standard errors can be found in Table 6.
Table 4 Stepwise Multiple Regression Analysis of the Variables that were Found to Have a Significant Univariate Relationship with Stroop-words
| Variable | B | SE B | β | t | p | F | R 2 | R 2 adjusted |
|---|---|---|---|---|---|---|---|---|
| Model 1: demographics | - | - | - | - | <.001 | 22.204 | .217 | .208 |
| Significant predictors | ||||||||
| - Age | -.096 | .022 | -.299 | -4.382 | <.001 | - | - | - |
| − Educational level | .657 | .147 | .304 | 4.457 | <.001 | - | - | - |
| Excluded variables | ||||||||
| - | - | - | - | - | - | - | - | - |
| Model 2: verbal processin speed | - | - | - | - | <.001 | 22.098 | .287 | .274 |
| Significant predictors | ||||||||
| − Span length 2 | -.004 | .002 | -.207 | -2.853 | .005 | - | - | - |
| − Span length 3 | -.002 | .001 | -.208 | -2.664 | .008 | - | - | - |
| − Span length 4 | -.001 | .000 | -.272 | -3.550 | .001 | - | - | - |
| Excluded variables | ||||||||
| − Span length 5 | - | - | -.112 | -1.481 | .140 | - | - | - |
| - | - | - | - | - | - | - | - | - |
| -Model 3: visual processing speed | - | - | - | - | <.001 | 10.807 | .157 | .143 |
| Significant predictors | ||||||||
| − Span length 3 | -.003 | .002 | -.207 | -2.012 | 0.047 | - | - | - |
| − Span length 6 | -.001 | .001 | -.242 | -2.351 | .020 | - | - | - |
| Excluded variables | ||||||||
| − Span length 2 | - | - | -.063 | -.605 | .547 | - | - | - |
| − Span length 4 | - | - | -.082 | -.564 | .574 | - | - | - |
Note. B=unstandardized regression coefficient; SE B=standard error of the coefficient; β=standardized coefficient; R 2=coefficient of determination; −=not applicable; p ≤ .05=significant as indicated in bold
Table 5 Stepwise Multiple Regression Analysis of the Variables that were Found to Have a Significant Univariate Relationship with Stroop Interference Score
| Variable | B | SE B | β | t | p | F | R 2 | R 2 adjusted |
|---|---|---|---|---|---|---|---|---|
| Model 1: verbal processin speed | - | - | - | - | <.001 | 8.791 | .138 | .122 |
| Significant predictors | ||||||||
| − Span length 2 | .008 | .003 | .185 | 2.405 | .017 | - | - | - |
| − Span length 4 | .001 | .001 | .147 | 1.701 | .091 | - | - | - |
| − Span length 5 | .001 | .000 | .176 | 2.146 | .033 | - | - | - |
| Excluded variables | ||||||||
| − Span length 3 | - | - | - | - | - | |||
Note. B=unstandardized regression coefficient; SE B=standard error of the coefficient; β=standardized coefficient; R 2=coefficient of determination; −=not applicable; p ≤ .05=significant as indicated in bold
Finally, normative data for Stroop-tones, Stroop-words, and the Stroop interference score were calculated per decade and are presented in Table 7.
4. Discussion
Cognitive inhibition is, among other things, essential to understand speech in complex listening conditions. Nonetheless, an auditory test of cognitive inhibition is barely used within cognitive hearing sciences. Therefore, the current study developed an auditory Stroop test, evaluated several influencing factors and its cognitive construct, and obtained normative data, all in the attempt of its implementation within cognitive hearing sciences.
Table 6 Standard Multiple Regression with Age, Educational Level, Hearing Sensitivity, Verbal Working Memory, and Verbal Processing Speed as Independent Variables and Stroop-tones, Stroop-words, and Stroop Interference Score as Dependent Variables
| Stroop-Tones | ||||||||||
| B | 95% | CI for B | SE B | β | t | p | F | R 2 | R 2 adjusted | |
| LL | UL | |||||||||
| Model | <0.001 | 12.086 | .260 | .238 | ||||||
| Constant | 35.257 | 27.031 | 43.483 | 4.167 | 8.460 | <0.001 | ||||
| Age | -.027 | -.082 | .029 | .028 | -.087 | -.954 | .342 | |||
| Educational Level | .390 | .104 | .677 | .145 | .187 | 2.687 | .008 | |||
| Hearing Sensitivity | -.226 | -.372 | -.080 | .074 | -.274 | -3.050 | .003 | |||
| Working memory | .117 | -.181 | .414 | .151 | .061 | .774 | .440 | |||
| Processing speed | -.001 | -.001 | .000 | .000 | -.135 | -1.723 | .087 | |||
| Stroop-Words | ||||||||||
| B | 95% | CI for B | SE B | β | t | p | F | R 2 | R 2 adjusted | |
| LL | UL | |||||||||
| Model | <0.001 | 16.225 | .320 | .301 | ||||||
| Constant | 21.396 | 13.222 | 29.569 | 4.141 | - | 5.167 | <0.001 | |||
| Age | -.044 | -.099 | .011 | .028 | -.138 | 1.583 | .115 | |||
| Educational Level | .469 | .184 | .754 | .144 | .217 | 3.250 | .001 | |||
| Hearing Sensitivity | -.085 | -.230 | .060 | .074 | -.099 | -1.156 | .249 | |||
| Working memory | .302 | .007 | .598 | .150 | .152 | 2.017 | .045 | |||
| Processing speed | -.001 | -.002 | .000 | .000 | -.236 | -3.143 | .002 | |||
| Stroop Interference Score | ||||||||||
| B | 95% | CI for B | SE B | β | t | p | F | R 2 | R 2 adjusted | |
| LL | UL | |||||||||
| Model | <0.001 | 4.175 | .108 | .082 | ||||||
| Constant | 35.309 | 16.274 | 54.345 | 9.664 | 3.661 | <0.001 | ||||
| Age | .074 | -.055 | .203 | .065 | .113 | 0.136 | .258 | |||
| Educational Level | -.473 | -1.136 | .190 | .336 | -.108 | -1.408 | .161 | |||
| Hearing Sensitivity | -.223 | -.561 | .115 | .171 | -.128 | -1.302 | .195 | |||
| Working memory | -.452 | -1.141 | .237 | .349 | -.112 | -1.295 | .030 | |||
| Processing speed | .002 | .000 | .003 | .001 | .189 | 2.191 | .197 | |||
Note. B=unstandardized regression coefficient; CI=confidence interval; LL=lower level; UL=upper level; SE B=standard error of the coefficient; β=standardized coefficient; R 2=coefficient of determination; −= not applicable; p ≤ .05=significant as indicated in bold
4.1 The Development of the Auditory Stroop Test
The choice of including auditory stimuli was based on previously reported auditory Stroop tests (Danneels et al., 2020; Strouwen et al., 2016). In these studies, the words ‘high’ and ‘low’ were presented at a high or low pitch. Although these auditory stimuli were considered useful, the test design was adapted within the current study to better suit the standard procedure of the commonly used visual Stroop test by implementing a baseline and interference task (Golden, 1975). An interference score was calculated between both tests as measure of verbal cognitive inhibition and flexibility. The used equation was chosen to control for differences in baseline performance among individual participants (Kemper et al., 2009). Last, it should be noted that the developed auditory Stroop test only uses two possible responses (i.e., high or low), which is lower compared to the four response options of the visual Stroop test (i.e., red, yellow, green, and blue), which might affect the expended cognitive effort. However, including four response options within the developed auditory Stroop test would require an excellent auditory discrimination ability of the participant, as the differences between the four presented pitches would be relatively small. Hence, it was assumed that for some individuals discriminating four pitches might be too challenging.
Table 7 Normative Data on Accuracy per Decade for Stroop-tones, Stroop-words, and Stroop Interference Score.
| Decade N (%) | 18-29 52 (100%) | 30-39 31 (100%) | 40-49 31 (100%) | 50-59 34 (100%) | 60-69 30 (100%) |
|---|---|---|---|---|---|
| Stroop-Tones | |||||
| Mean (SD) | 41.15 (4.49) | 40.19 (4.05) | 40.32 (3.38) | 37.82 (5.77) | 36.40 (3.90) |
| Pc 5 | 30.30 | 31.40 | 31.60 | 25.50 | 28.75 |
| Pc 10 | 33.60 | 33.40 | 34.80 | 28.50 | 31.10 |
| Pc 20 | 39.00 | 37.00 | 39.00 | 33.00 | 34.00 |
| Pc 30 | 40.00 | 39.00 | 39.60 | 35.00 | 34.00 |
| Pc 40 | 40.20 | 39.80 | 40.80 | 37.00 | 36.00 |
| Pc 50 | 42.50 | 41.00 | 41.00 | 39.00 | 36.00 |
| Pc 60 | 43.00 | 42.00 | 41.00 | 41.00 | 37.00 |
| Pc 70 | 44.00 | 43.00 | 42.00 | 42.00 | 38.00 |
| Pc 80 | 45.00 | 43.60 | 43.00 | 44.00 | 39.80 |
| Pc 90 | 45.70 | 44.00 | 44.00 | 44.00 | 41.00 |
| Stroop-Words | |||||
| Mean (SD) | 31.29 (3.72) | 30.81 (4.70) | 28.87 (4.97) | 27.68 (5.65) | 26.70 (4.25) |
| Pc 5 | 25.00 | 20.60 | 20.20 | 14.75 | 18.10 |
| Pc 10 | 26.30 | 25.00 | 21.20 | 17.00 | 21.10 |
| Pc 20 | 29.00 | 26.40 | 23.00 | 24.00 | 23.20 |
| Pc 30 | 29.00 | 28.60 | 26.20 | 26.50 | 25.00 |
| Pc 40 | 30.00 | 30.80 | 28.00 | 27.00 | 25.00 |
| Pc 50 | 31.50 | 31.00 | 30.00 | 28.00 | 26.00 |
| Pc 60 | 32.00 | 32.00 | 31.00 | 30.00 | 28.00 |
| Pc 70 | 32.00 | 33.00 | 33.00 | 31.00 | 29.40 |
| Pc 80 | 34.00 | 34.60 | 33.60 | 33.00 | 30.80 |
| Pc 90 | 36.70 | 37.80 | 34.80 | 34.00 | 33.00 |
| Stroop Interference Score | |||||
| Mean (SD) | 23.56 (8.22) | 23.28 (9.51) | 28.20 (11.83) | 26.80 (10.99) | 26.57 (9.46) |
| Pc 5 | 34.65 | 36.43 | 48.29 | 42.53 | 38.82 |
| Pc 10 | 32.11 | 30.43 | 41.03 | 34.09 | 34.84 |
| Pc 20 | 27.97 | 27.27 | 33.66 | 29.98 | 32.25 |
| Pc 30 | 27.27 | 24.59 | 28.71 | 27.59 | 26.47 |
| Pc 40 | 24.40 | 22.92 | 25.00 | 25.32 | 25.95 |
| Pc 50 | 20.00 | 20.36 | 22.21 | 24.39 | 23.54 |
| Pc 60 | 18.16 | 19.00 | 20.76 | 21.32 | 21.67 |
| Pc 70 | 15.63 | 16.95 | 19.71 | 18.42 | 19.73 |
| Pc 80 | 12.66 | 7.96 | 14.84 | 12.89 | 16.79 |
| Pc 90 | 10.07 | 6.71 | 10.39 | 7.30 | 7.05 |
Note. Pc=percentile, SD=standard deviation
4.2 The Effects of Age, Sex, Educational Level, Awakeness, and Hearing Sensitivity
In all performed analyses, more significant findings were observed between the different independent variables and Stroop-tones and Stroop-words, compared to the Stroop interference score. The Stroop interference score is a derived score based on Stroop-tones and Stroopwords. Hence, it might be that due to this derived score some kind of averaging of the observed trends at Stroop-tones and Stroop-words appeared, resulting in an interference score that might be less sensitive to show significance. When analyzing linear regression, however, it is important to judge an independent variable by its magnitude (i.e., regression coefficient) and precision (i.e., 95% confidence interval) rather than just by its statistical significance (Laerd Statistics, 2015). Therefore, the regression analyses of Stroop-tones, Stroop-words, and the Stroop interference score were all included for interpretation.
Age was a significant negative predictor for Strooptones and Stroop-words, based on the univariate and stepwise multiple regression analyses, though this significance disappeared when conducting the standard multiple regression analysis. Moreover, in none of the analyses age seemed a significant predictor for the Stroop interference score. This result was somewhat surprising since it is well known that aging is associated with a decreased cognitive functioning (Baltes & Lindenberger, 1997; Harrington et al., 2017; Van der Elst et al., 2006). As the participants scored over 25 on the Montreal Cognitive Assessment, it is possible that age-related cognitive decline was not enough to have influenced the outcomes. In line with the current results, (Zekveld et al. 2020) did not find a correlation between age and auditory Stroop scores (i.e., reaction time). Besides, their results showed that age in combination with more severe hearing loss resulted in longer auditory Stroop reaction times. The current study did not explore this interaction effect. Furthermore, the current Stroop interference scores demonstrated a large variation between results, even within a specific decade, which might partially explain the non-significance. However, no clear explanation for this large variation could be made based on the current statistical or observational results. Further, previous studies indicating a significant age effect on the visual Stroop test included a greater amount of participants compared to the current study (Hameleers et al., 2000; Van Boxtel et al., 2001; Van der Elst et al., 2006). Last, a trend was observed showing a decrease in performances with increasing age for Stroop-tones, Stroop-words, and the Stroop interference score. Hence, normative data were still obtained per decade.
Stroop-tones, Stroop-words, and the Stroop interference scores were not influenced by sex. Other studies, examining the sex effect on the visual Stroop test, demonstrated contrasting results regarding its sex effect ranging from no sex difference (Houx et al., 1993; MacLeod, 1991; Troyer et al., 2006) to a sex difference favoring females (Baroun & Alansari, 2006; Van der Elst et al., 2006). These observed variations can, among other things, be explained by the used outcome measurement. In the current study, the interference score was based on measures of accuracy since this type of scoring seemed to be less affected by generalized cognitive slowing (Troyer et al., 2006). However, those measures seemed to be less sensitive to sex differences compared to measures of speed (Van der Elst et al., 2006).
Educational level appeared as significant predictor for Stroop-tones and Stroop-words. More specifically, higher educational levels will result in higher scores on Stroop-tones and Stroop-words. For the Stroop interference score, educational level did not show any statistical significance, nor seemed the magnitude and precision reported in the standard multiple regression analysis important. The latter was in contrast with previous research reporting better Stroop interference scores with higher education (Hameleers et al., 2000; Houx et al., 1993; Van der Elst et al., 2006). The impact of low education on Stroop interference scores seemed to be larger than the impact of high education (Van der Elst et al., 2006). Exactly, a relatively high educational level of at least 12 years of education was observed within the included participants, which might explain the non-significance between educational level and Stroop interference score.
Self-reported awakeness appeared to be associated with decreased cognitive functioning (Kronholm et al., 2009). Hence, prior to testing, participants awakeness was questioned by means of a visual analogue scale. Awakeness did not seem to have any relation with Strooptones, Stroop-words, or Stroop interference scores. An awakeness score less than five was not administered within the current study, suggesting that in further research an awakeness score of five or higher might be used as an inclusion criterion.
Since the auditory Stroop test relies on the perception of auditory stimuli, hearing sensitivity was considered as an important factor. Moreover, a link between age-related hearing loss, on the one hand, and accelerated cognitive decline (Fischer et al., 2016) and dementia (Deal et al., 2017; Gallacher et al., 2012; Livingston et al., 2017), on the other hand, was suggested by previous research. Within the current study, a decrement of hearing sensitivity with increasing age was observed, especially in the high frequency region. However, for all decades, hearing sensitivity was within normal or borderline normal ranges (ISO 7029, 2017), and thus, an influence of hearing sensitivity on the outcomes of Stroop-tones, Stroop-words, and the Stroop interference score was not expected. Based on the standard multiple regression analyses, hearing sensitivity was not a significant predictor for Stroop-words and the Stroop interference score, whereas Stroop-tones was, among other things, significantly negatively predicted by participants’ hearing sensitivity. During Stroop-tones, participants can only rely on their hearing to identify the high or lowpitched pure-tones, whereas also other linguistic factors can assist to achieve the identification task of Stroopwords. Hence, it was suggested that the influence of hearing sensitivity was on the level of perception rather than decreased hearing sensitivity did cause cognitive decline. Further, in line with the current results, (Zekveld et al. 2020) did not find a correlation between hearing sensitivity and the auditory Stroop scores (i.e., reaction time), whereas the interaction of increasing age with hearing loss resulted in longer auditory Stroop reaction times. As previously mentioned, this interaction effect was not explored within the current study.
4.3 The Relation with Visual and Verbal Working Memory and Processing Speed
Hearing rehabilitation aims to improve everyday speech communication. In this respect, examining cognition through verbal testing is likely better serving the purpose due to better construct validity compared to visual testing (Shen et al., 2020). In this respect, it was hypothesized that if the auditory Stroop scores were better predicted by verbal working memory or processing speed, the developed auditory Stroop test would rely on auditory processing of the test items, and, thus, could be considered as a good test for measuring cognitive inhibition and flexibility using auditory stimuli.
In line with this hypothesis, verbal working memory predicted Stroop-words and the Stroop interference score significantly better compared to visual working memory, whereas visual nor verbal working memory had anadded predictable value for Stroop-tones. Since Strooptones is an automatic pitch-identification task, no contribution of working memory was expected. Stroop-words, however, requires ignoring and suppressing the automatic listening response, while attending and responding to the more effortful pitch-identification. Hence, before answering, the incoming information needs to be rapidly processed, involving the contribution of verbal working memory. Considering processing speed, the addition of processing speed to the hierarchical model predicted Stroop-tones significantly better. Nevertheless, the modality (i.e., visual or verbal) did not seem to play an influencing role. For Stroop-words, visual and verbal processing speed were both significant factors. The greatest changes in the coefficient of determination were observed when verbal processing speed was added to the model for both Stroop-tones and Stroop-words. Further, only verbal processing speed added value in predicting the Stroop interference score.
As verbal working memory and processing speed were best related to the auditory Stroop scores, only these verbal outcomes were added to the final standard multiple regression model. Verbal working memory and processing speed were found as significant predictors for Stroop-words, but not for Stroop-tones. On the one hand, working memory will be engaged during Stroopwords to shortly store and process the incoming information. The involvement of processing speed, on the other hand, might be related to the used test method in which participants had to identify as much as possible pitches within 45 seconds. This cognitive contribution during Stroop-words can be related to task difficulty. As previously mentioned, Stroop-tones can be considered as an automatic discrimination task of pure-tones, requiring mainly the involvement of the peripheral and central auditory system (Kiessling et al., 2003). Stroopwords, however, requires multitasking whereby the comprehension of the spoken word has to be suppressed while attending and responding to the pitch identification task. In addition to the peripheral and central auditory system, other brain regions related to conflict processing will be activated, such as the anterior cingulate cortex, bilateral inferior frontal gyrus, parietal lobe, and anterior insula (Roberts & Hall, 2008). Considering the Stroop interference score, only working memory appeared as a significant predictor (i.e., the better the working memory scores, the lower the Stroop interference score will be, indicating better executive functioning). The observed relationship between executive functioning and working memory was also reflected in the neurocognitive domains described within the Diagnostic and Statistical Manual of Mental Disorders 5 (DSM-5) in which working memory was considered as a subcomponent of executive functioning (Sachdev et al., 2014).
4.4 Normative Data
One possible application of measuring cognitive inhibition and flexibility within cognitive hearing sciences is to conduct hearing aid fitting based on the auditorycognitive performance of the hearing aid user. More specifically, hearing aid users with poorer cognitive functioning seemed to derive more hearing aid benefit in terms of speech understanding from hearing aid settings, facilitating the matching process between the incoming auditory signal and its representations stored in longterm memory (Kestens, Degeest, & Keppler, 2021). However, the boundary between good and poor cognitive functioning is not yet clearly defined in literature (Kestens, Degeest, & Keppler, 2021). Clinically, a score lower than the 5th percentile is commonly used as cutoff point for an impaired performance within neuropsychology (Lezak et al., 2004). If this cutoff point is also relevant within the field of audiology, it has to be further examined.
4.5 Strengths and Limitations
The developed auditory Stroop test has several important strengths. First, it can be considered as a good test to measure cognitive inhibition and flexibility using auditory stimuli. Second, less test items were used compared to the original Stroop test, resulting in a shorter test duration. The latter makes the developed auditory Stroop test an efficient test for implementation in scientific and clinical protocols. Moreover, greater interference effects are rather found towards the beginning than toward the end of lengthy trials (Klein et al., 1997). Third, normative data were obtained per decade for individuals between 18 and 69 years of age.
Some limitations should also be mentioned. First, test-retest reliability of the auditory Stroop test is unknown. Second, the interference score showed great variance even within a specific decade. Third, the study population consisted of higher educated participants. Fourth, no speed-related measurement was implemented, which might be more affected by demographic variables compared to accuracy measures (Van der Elst et al., 2006).
Fifth, the test design of the visual and verbal cognitive tests to measure working memory and processing speed were not identical. Last, previous results showed the importance of evaluating the interaction effect between age and hearing sensitivity on the outcome of the auditory Stroop, especially within the context of speech understanding in noise (Knight & Heinrich, 2017; Zekveld et al., 2020), though this interaction effect was not investigated within the current study.
5. Conclusion and Future Research
The developed auditory Stroop test was considered as a good test for measuring cognitive inhibition and flexibility using auditory stimuli. More specifically, the auditory Stroop scores could be better predicted by verbal working memory and processing speed compared to the visual counterparts. Furthermore, a trend was observed showing an increase in Stroop interference score with increasing age, whereas sex, educational level, awakeness, and hearing sensitivity did not have a significant relationship with the Stroop interference score.
Further research can focus on expanding the current normative data by including older participants and participants differing in hearing sensitivity and educational level. In addition, the construct validity and reliability should be further assessed by, for example, evaluating its relationship with the visual Stroop test. Last, implementing this auditory Stroop test within cognitive hearing sciences will contribute to unravel the auditorycognitive perspective of speech understanding, which would be beneficial for, among other things, auditory rehabilitation in hearing-impaired individuals.

