


 Inglês (pdf)
 Artigo em XML
 Referências do artigo
 Enviar este artigo por email
 Citado por SciELO
  Citado por Google
  Similares em
SciELO
Similares em
SciELO  Similares em Google
 Permalink
1. Introduction
The Durand Adaptive Psychopathic Traits Questionnaire (DAPTQ; Durand, 2019c) is a 38item selfreport in strument developed to examine adaptive traits associ ated with psychopathic traits. The DAPTQ uses a total score, as well as eight subscale scores: Leadership (4 items), Logical Thinking (5 items), Composure (6 items), Creativity (4 items), Fearlessness (6 items), Focus (4 items), Extroversion (6 items), and Management (3 items). Three of the DAPTQ’s factors mirror factors observed in another instrument in the field of psycho pathic traits Fearlessness, Extroversion, and Compo sure are strongly associated with the factors Fearless ness (r = .59), Social Potency (r = .77), and Stress Immunity (r = .61) from the Psychopathic Personality Inventory (PPI; Lilienfeld & Andrews, 1996), as it was observed in a previous study (Durand, 2019c). The DAPTQ’s other factors, although not included in any measure of psychopathic traits, have been associated with various psychopathic traits across several studies (for a review, see Durand, 2019b). It should be noted that the DAPTQ’s framework is based on the theory that adaptive traits play a central role in the construction of psychopathic traits. This theory is part of an ongoing debate, as traits considered adaptive do not generally correlate with externalizing behaviors, which are considered primordial within the concept of psychopathy (Crowe et al., 2021; Lilienfeld et al., 2012; Miller & Lynam, 2012). Durand (2019c) also emphasizes that the DAPTQ is not a measure of psychopathy, nor of psychopathic traits, as the instrument does not cover any maladaptive traits.
While the DAPTQ is showing promising psychome tric properties (Bronchain et al., 2021; Bronchain et al., 2020; Durand, 2019a), it does not include a validity scale, which can compromise the quality of the results obtained by the instrument. Among other factors, careless responding can negatively impact results by de creasing statistical power and estimates of internal consistency, as well as by affecting correlations between variables (Curran, 2016; Huang et al., 2015). Although it remains unclear which populations are most susceptible to careless responding, estimates suggest that 812% of respondents from a typical study answer carelessly or with insufficient effort (Curran, 2016). Identifying these individuals is particularly important in personality related research, as previous findings suggest that careless respondents typically exhibit lower levels of agreeableness, conscientiousness, and openness (Berry et al., 2019).
Due to the lack of a validation scale, many of the previous studies using the DAPTQ had to rely on validity scales included in other instruments administered at the same time as the DAPTQ. For instance, a valida tion study of the DAPTQ used the Variable Response Inconsistency (VRIN) of the Psychopathic Personality Inventory Short Form (PPISF), which measures the extent to which item pairs with similar content are an swered inconsistently (Durand, 2019a). These types of inconsistency scales are developed by identifying highly correlated item pairs. A total score is calculated based on the sum of the absolute value of the difference for each pair of items. Lower scores reflect smaller discrepancy between similar items, which should, theoretically, be endorsed in a similar manner. As highlighted by Mowle and colleagues (2017), the performance of inconsistency scales should be crossvalidated in multiple samples to ensure generalizability, and it should also be validated against randomly generated protocols.
Based on the issues associated with careless and random responding, it would be beneficial to develop a validation scale specific to the DAPTQ. The DAPTQ could then be used in studies without any other self reported instrument. The present study has four objectives. The first objective is to develop an inconsistency responding scale for the DAPTQ (IRSDAPTQ) using the archival data from Durand’s (2019a) study #1 and study #2. The second objective is to examine the external and criterion validity of the newly developed IRS DAPTQ by examining associations with other inconsistency responding scales, as well as associations with measures of personality traits, such as conscientiousness, that have shown a negative association with careless responding (Kelley et al., 2016). The third objective is to examine the internal validity of the scale by comparing IRSDAPTQ scores obtained from individuals (students and the general population) who completed the DAPTQ with randomly generated DAPTQ scores. The last objective is to identify a tentative cutoff score to classify potentially invalid profiles based on comparisons of respondent data with a randomly generated sample of N = 1000 DAPTQ protocols.
2. Method
The present study used the combined dataset of both samples from Durand (2019a), as well as two original samples and one generated sample. While Durand’s two original studies (2019a) used the 41item version of the DAPTQ, the three items related to the Money Smart subscale were not used here because Durand had found that the items included in the Money Smart factor were derived from multiple constructs unrelated to financial management. Across all samples, the 38 items were answered on a 6point scale: Strongly Disagree, Disagree, Slightly Disagree, Slightly Agree, Agree, Strongly Agree. There was no missing data in any of the datasets. For all studies, the requirements were to be over 18 years old and to be fluent in English. Informed consent was obtained from all participants.
2.1. Sample 1: General Population Derivation Sample
Sample 1 consisted of the combination of Durand’s study #1 and study #2 (2019a). A total of N = 525 par ticipants had completed the DAPTQ and the PPISF. Out of these participants, n = 263 also completed the HEXACOPIR60 (Ashton & Lee, 2009), while the other n = 262 also completed the Triarchic Psychopathy Measure (Patrick, 2010). Participants were almost equal in terms of sex distribution (51% male, 49% female). Over half (57%) of the participants reported not being currently enrolled at a university. Most participants were located in North America (54%) or Europe (30%). Participants were predominantly Caucasian (78%). The mean age of the participants was 29.40 (SD = 10.51) years. The sample used in this study is the final sample used in both of Durand’s studies (2019a), with outliers removed.
2.2. Sample 1: Criterion Measures
HEXACOPIR60. The 60item version of the HEX ACO (HEXACOPIR60; Ashton & Lee, 2009) is a self-reported instrument using a 5point response key, evaluating six domains of personality: honestyhumility, emotionality, extraversion, agreeableness, conscientious ness, and openness. While studies generally focus on the conscientiousness factor when investigating the role of the personality in inconsistent responding (e.g., Kelley et al., 2016; Mowle et al., 2017), the analyses were performed on all six domains to further investigate the findings reported by Berry and colleagues (2019).
Psychopathic Personality Inventory Short Form. The 56item version of the PPI (PPISF; Lilienfeld & Widows, 2005) is a selfreport questionnaire using a 4 point scale, evaluating eight factors of the psychopathic personality: stress immunity, social potency, fearless ness, blame externalization, Machiavellian egocentricity, carefree nonplanfulness, impulsive nonconformity, and cold heartedness. The PPISF is a common instrument for measuring psychopathic traits and has excellent psychometric properties (Durand, 2019b). For the present study, only the VRIN of the instrument was used (i.e., a total score derived from the sum of the absolute difference of pairs of items highly correlated with one another).
Triarchic Psychopathy Measure. The TriPM (Patrick, 2010) is a 58item selfreport instrument using a 4point scale measuring psychopathic traits on three factors: bold ness, meanness, and disinhibition. Like the PPI, the TriPM is a commonly used measure of psychopathic traits with excellent psychometric properties (Durand, 2019b). In the current study, only the Triarchic Assess ment Procedure for Inconsistent Responding (TAPIR; Mowle et al., 2017) was used. The TAPIR is an in consistent responding scale developed using the same procedure as the VRIN of the PPI.
2.3. Sample 2: Undergraduate Sample
Sample 2 included a total of N = 654 undergraduate students from the University of Ottawa. Participants were predominantly female (80%). Participants were mostly in the first (65%) or second (24%) year of their bachelor’s program. Participants were majoring in the fields of social sciences (37%), sciences (29%), health science and medicine (18%), arts (10%), or other (6%). The mean age was 20.33 (SD = 2.09) years. Unlike with Sample 1, outliers were not removed. Participants were compensated with a course point.
2.4. Sample 3: General Population Sample
Sample 3 included a total of N = 289 individuals from the general population recruited on reddit.com/r/Sample Size. Participants were relatively equal in terms of sex (56% female, 44% male). Almost half (47%) of the participants reported being enrolled as a student at a university. Participants were mostly located in Europe (45%) and North America (43%). The mean age of the participants was 29.36 (SD = 11.64) years. As with Sample 2, no attempt was made to remove outliers. Participants were not compensated.
3. Results
A Pearson correlation among all 38 items of the DAPTQ was performed to identify strong correlations (r .50) within Sample 1. In addition to a minimum correlation of .50, no individual item could be included in more than one pair (i.e., items were included only in the pair with the strongest correlation). Out of the 46 pairs of items with a correlation of over .50, 14 pairs of unique items were selected. Selection of the pairs was done by ranking the results of the correlations in decreasing order, starting with the strongest correlation (pair 619, r = .78), and then proceeding to include the next strongest pair, while excluding pairs containing an item from a pair previously selected. Based on the mean difference for each pair, two pairs were excluded for having a mean difference ≥1.00. This threshold of 1.00 to exclude pair of items is in line with previous research related to the development of a response inconsistency scale (Mowle et al., 2017). The total score of the IRSDAPTQ was then calculated by summing the absolute value of the difference between each pair of items (range: 060). Table 1 summa rizes the item correlations and mean differences for each pair by sample. The final version of the IRSDAPTQ con sists of 12 pairs and includes at least one pair from each scale of the DAPTQ. The final scale is as follows:
(DAPTQ_1DAPTQ_36)+(DAPTQ_3DAPTQ_11)
+ (DAPTQ_4 DAPTQ_26)+(DAPTQ_6DAPTQ_19)
+(DAPTQ_8DAPTQ_32)+(DAPTQ_9DAPTQ_15)
+(DAPTQ_10DAPTQ_33)+(DAPTQ_16DAPTQ_18)
+(DAPTQ_20DAPTQ_23)+(DAPTQ_22DAPTQ_38)
+(DAPTQ_24DAPTQ_27)+(DAPTQ_30DAPTQ_34)
=IRSDAPTQ.
Table 1 DAPTQ Item Pair Correlations and Mean Differences per Pair
| Samples | |||
| Item pair | 1. Derivation | 2. Undergraduates | 3. General population |
| Items 1 and 36 (Lo) | .61 (.69) | .50 (1.02) | .57 (.70) |
| Items 3 and 11 (Co) | .66 (.95) | .63 (.73) | .71 (.76) |
| Items 4 and 26 (Le) | .73 (.62) | .57 (.82) | .70 (.70) |
| Items 6 and 19 (Cr) | .78 (.67) | .65 (.82) | .81 (.79) |
| Items 8 and 32 (Ma) | .53 (.93) | .43 (.99) | .53 (.96) |
| Items 9 and 15 (Fo) | .69 (.59) | .59 (.67) | .73 (.53) |
| Items 10 and 33 (Ex) | .63 (.80) | .63 (.80) | .66 (.80) |
| Items 16 and 18 (Fe) | .63 (.81) | .57 (.79) | .67 (.77) |
| Items 20 and 23 (Ex) | .68 (.83) | .61 (.87) | .73 (.79) |
| Items 22 and 38 (Lo) | .59 (.79) | .64 (.73) | .62 (.70) |
| Items 24 and 27 (Co) | .54 (.91) | .51 (.85) | .57 (.92) |
| Items 30 and 34 (Co) | .75 (.66) | .72 (.64) | .80 (.58) |
| Non-retained items | |||
| Items 5 and 13 (Fo/Ma) | .51 (1.00) | .36 (1.13) | .46 (1.06) |
| Items 14 and 31 (Fe) | .55 (1.24) | .43 (1.21) | .50 (1.29) |
Note. All correlations p < .001. Parentheses refer to mean differences. Le=Leadership; Lo=Logical Thinking; Co=Composure; Cr=Creativity; Fe=Fearlessness; Fo=Focus; Ex=Extroversion; Ma=Management.
Subsequently, external validity was examined by com paring the results of the IRSDAPTQ with the VRIN of the PPISF from Durand’s study #1 and with the VRIN of the PPISF and the TAPIR of the TriPM from study #2 (2019a). For study #1, the IRSDAPTQ was weakly correlated with the VRIN (r = .19, p = .002). For study #2, the IRSDAPTQ was weakly correlated with the TAPIR (r = .13, p = .031) and was not correlated with the VRIN (r =.07, p = .267). The TAPIR and the VRIN were also weakly correlated with each other (r = .23, p < .001). Validity was further explored by examining the association between the IRSDAPTQ and the six HEXACOPIR60 factors of Sample 1 through a Pearson correlation. Based on a Bonferroni correction of .05/6 = .008 to correct for multiple testing, only one significant result emerged: a weak negative correlation between the IRSDAPTQ and conscientiousness (r = .21, p = .001). The VRIN of the PPISF of study #1 was not significantly correlated with any of the HEX ACO’s factors.
Internal validity of the IRSDAPTQ was assessed by comparing the means of the IRSDAPTQ for samples of students and the general population with randomly generated DAPTQ protocols (N = 1000). These random protocols were generated via an excel spreadsheet with a command to generate a whole number between one and six, inclusively, for each item of the DAPTQ, repeated 1000 times. The responses were equally weighted. While 100% random protocols may not be an accurate reflec tion of careless responding for some participants, they accurately represent individuals who complete question naires randomly in order to quickly finish the task and receive the compensation (e.g., course points). Figure 1 displays the distribution of DAPTQ scores for the derivation, undergraduate, general population, and ran dom samples. The IRSDAPTQ scores for each human sample were consistently lower (derivation: M = 8.35, SD = 3.34; undergraduate: M = 8.88, SD = 3.59; gen eral population: M = 8.10, SD = 3.33) than those for the randomly generated sample (M = 21.32, SD = 4.87; see Table 2 for the test results).
Lastly, a receiver operating characteristic (ROC) curve was computed to find a possible cut score to identify po tentially problematic protocols with high levels of inconsistencies. The ROC curve is a graphical plot displaying the ability of a binary system to classify data based on sensitivity (i.e., correctly detecting positive cases) and specificity (i.e., correctly detecting negative cases). Table 3 shows the classification accuracy of potential cut scores for differentiating genuine data from randomly generated DAPTQ protocols. Based on these results, a cutoff of 14 might be the most appropriate, yielding an adequate tradeoff between sensitivity and specificity.
4. Discussion
The purpose of the present study was to develop an in consistent responding scale, the IRSDAPTQ. An initial scale of 14 item pairs was developed from the derivation sample. Based on mean differences between the items in each pair, two pairs were excluded, yielding a scale of 12 item pairs covering all eight subscales of the DAPTQ. The validity of the IRSDAPTQ was assessed by com paring the scores with scores generated from alterna tive inconsistency scales and with a measure of personality traits, as well as by comparing mean differences on the IRSDAPTQ between protocols completed by participants and randomly generated protocols. Across all samples, the IRSDAPTQ strongly differentiated genuine data from randomly generated protocols.
Table 2 Predicting Randomly Generated Protocols Using the IRSDAPTQ
| Sample | AUC | SE | t | Cohen’s d | Mean difference | 95% CI |
| Derivation | .99 | .003 | 61.17 | 3.11 | 12.97 | [12.56-13.90] |
| Undergraduate | .98 | .003 | 59.72 | 2.91 | 12.44 | [12.03-12.85] |
| General Population | .99 | .004 | 53.06 | 3.17 | 13.22 | [12.73-13.71] |
Note. All correlations p < .001. Parentheses refer to mean differences. Le=Leadership; Lo=Logical Thinking; Co=Composure; Cr=Creativity; Fe=Fearlessness; Fo=Focus; Ex=Extroversion; Ma=Management.
Table 3 Classification Accuracy for IRSDAPTQ Raw Scores Based on the ROC Curve Analysis
| IRSDAPTQ score | 100% random sensitivity | Undergraduate | General population |
| specificity (%) | specificity (%) | ||
| 9 | 100.0 | 51.4 | 59.5 |
| 10 | 99.5 | 63.5 | 70.9 |
| 11 | 99.0 | 71.3 | 80.6 |
| 12 | 98.4 | 79.4 | 87.9 |
| 13 | 97.1 | 85.9 | 90.7 |
| 14 | 95.1 | 90.4 | 93.4 |
| 15 | 92.4 | 93.6 | 95.2 |
| 16 | 88.5 | 95.7 | 97.6 |
| 17 | 83.8 | 96.8 | 98.3 |
| 18 | 77.6 | 97.9 | 98.6 |
| 19 | 70.6 | 98.3 | 99.0 |
| 20 | 61.8 | 98.9 | 99.7 |
Note. Classification accuracy of potential cut scores.
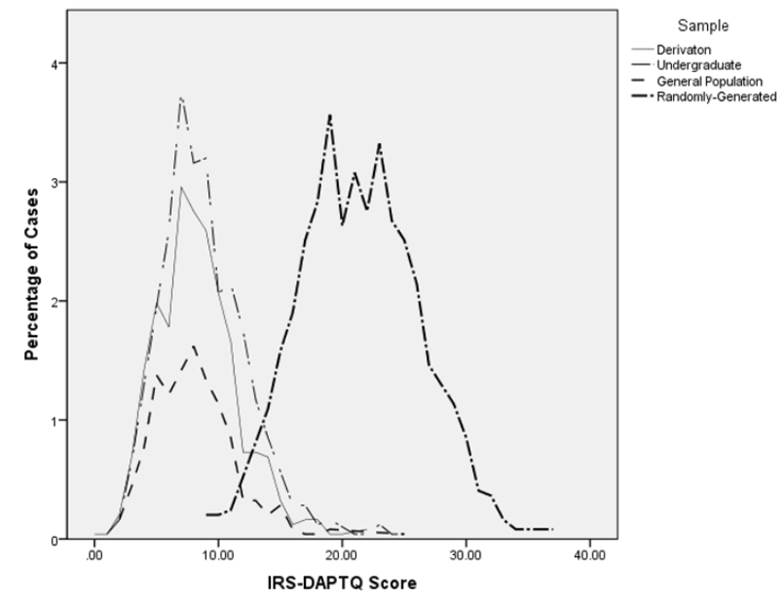
Figure 1 Distribution of the IRSDAPTQ Scores for the Derivation, Undergraduate, General Population, and Randomly Generated Samples
The results of the Pearson correlations between the IRSDAPTQ and both the VRIN and the TAPIR may be explained by the use of different scales. The DAPTQ uses a 6point rating scale, while both the PPI and the TriPM use a 4point rating scale. This may increase the variability of responses in the DAPTQ, hence decreasing its correlation with the two inconsistency scales. Interestingly, the two inconsistency scales did not correlate strongly with one another either. It is possible that a correlation can only emerge in datasets including high numbers of outliers.
In line with previous findings, the inconsistency scale of the DAPTQ was significantly negatively correlated with conscientiousness. Similar correlations were observed between conscientiousness and the inconsistency scale of the Triarchic Psychopathy Measure (r = .26, p < .01; Mowle et al., 2017) and the inconsistency scale of the Psychopathic Personality Inventory (r = .18 to .23, p < .01; Kelley et al., 2016). These findings sup port the hypothesized relationship between inattentive ness when completing questionnaires and certain basic personality traits, especially conscientiousness (Bowling et al., 2016).
The sensitivity and specificity associated with the proposed cut score is in line with previous findings. For instance, Mowle and colleagues (2017) suggested a cut score between 11 to 13 for their inconsistency scale, which corresponds to a sensitivity of 96.8 to 87.4% and an un dergraduate specificity of 90.1 to 95.5%. This specificity is also in line with the inconsistent responding usually observed in undergraduate students (Curran, 2016). It should be noted that for the proposed cut score, the specificity of the general population sample recruited on Reddit was substantially higher (93.4%) than the speci ficity of the undergraduate population (90.4%).
5. Conclusion
While the validity of the IRSDAPTQ cannot be confidently established due to the small number of samples investigated in the current study, the scale successfully identified random profiles and showed similar sensitivity and specificity across human samples. There are, however, a few notable limitations to the present study. First, the IRSDAPTQ could not be checked against a well validated inconsistency scale for the new samples, without which validity cannot be established (Bagby & Sellbom, 2018). A subsequent study should examine the scores obtained on the IRSDAPTQ in correlation with validity scales assessing response inconsistency. Second, the present study uses a 100% randomly generated sample, which mimics individuals filling in random answers to complete a study as quickly as possible, rather than individuals who answer carelessly only on occasion throughout the questionnaire. A future study should instruct participants to complete the instrument without reading every statement in order to mimic occasional disinterest in the questions. In addition to addressing these limitations, future research should further investigate the effect of offering course point/monetary rewards to undergraduate students by comparing their performance to that of uncompensated participants from the general population, since rewards could also affect inconsistent responding. Additional samples, such as employee groups, should also be re cruited to examine the validity of the IRSDAPTQ across a wider range of populations.

