English (pdf)
 Article in xml format
 Article references
 Send this article by e-mail
 Cited by SciELO
  Cited by Google
  Similars in
SciELO
Similars in
SciELO  Similars in Google
 Permalink
1. Introduction
Traditional and contemporary psychometrics deal with the ordering of individuals across a single latent or more continuum of skills and competencies. However, these models fail to describe a person’s strengths and weak- nesses or fine-grained competencies. Thus, a series of models have been developed termed Cognitive Diagnostic models (CDMs) or Diagnostic Classification Models (DCMs). The additional goal of these models, beyond rank-ordering individuals, is the classification of mastery and non-mastery individuals on specific attributes tapping single or multiple traits (Liu et al., 2018). The methodology has been utilized across a range of skills and competencies documenting the potential benefits of the procedure (Alexander et al., 2016; Gorin & Embretson, 2006; Jang, 2009; Kaya & Leite, 2017; McGill et al., 2016). The present paper is organized along the following axes: (a) it describes the logic and reasoning of Diagnostic Classification Models (DCMs) in relation to other known models and (b) it presents an applied example of the use of DCM for the assessment of language skills and competencies (Rupp & Templin, 2008; Sessoms & Henson, 2018) concerning the CEFR framework (e.g., Alderson, 2007).
2. Diagnostic Classification Models (DCM): Description
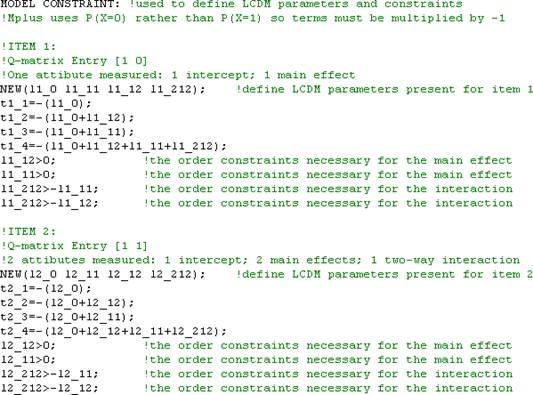
Based on traditional modeling approaches, a person’s score is comprised of a raw estimate and a standard estimate that describes the person’s score in relation to the rest of the population (in normative instruments) using continuous or categorical approaches. For example, as shown in Figure 1, upper panel, a person’s score could be the summed estimate of exercises designed to assess basic math skills. Using the proposed Diagnostic Classification Modeling (DCM) approach (Jurich & Bradshaw, 2014; Templin & Bradshaw, 2013; Templin & Hoffman, 2013), as shown in the lower panel of Figure 1, the competencies required to achieve the basic math exercise 5 + 1 1 are both addition and subtraction. Consequently, estimation of the competencies of addition, subtraction, multiplication, and division requires the estimation of both main effects and interactions in exercises that involve multiple competencies. As a result, the conclusion derived from DCMs is one that a person is either proficient or not, in addition, subtraction, etc., but does require work on e.g., division (for an excellent discussion on DCMs see Kunina-Habenicht et al., 2009). On the other hand, the results from traditional analytical approaches (classical or contemporary) would provide information on placement only such as the person being in the 60th percentile in math or having a pass/fail score in response to a categorical classification system.
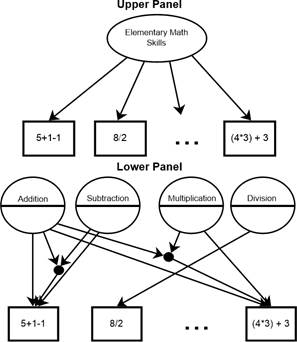
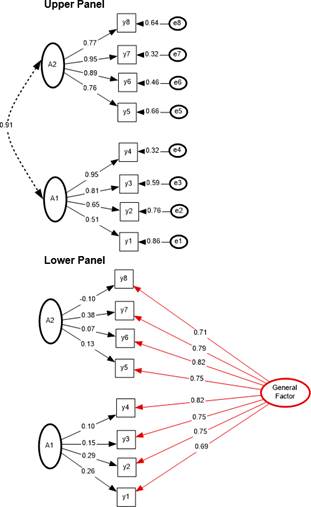
Traditional modeling approaches involved the factor model, exploratory in the old days, and confirmatory later (see Figure 2), upper panel, depicting a 3-factor correlated model of three intercorrelated skills. The middle panel of Figure 2 displays the same 3-skills structure by use of Item Response Theory (IRT) with the boxed (item estimates) containing information on item difficulty levels (crossed line shows intercepts) in addition to their link with the latent factors (slopes). The bottom panel of Figure 2 shows a complex structure, in which items define more than one skill and competencies and the circled latent variable estimates use a split line to denote threshold estimates of categorical variables denoting skill acquisition or not. This model resembles the exploratory structural equation modeling approach, recently put forth by Asparouhov and Muthen (2009).
3. Statistical Properties of Diagnostic Classification Models (DCMs)
Cognitive diagnostic models have recently received increased attention with applications across various disciplines (see Gierl et al., 2010; Tu et al., 2017; Xie, 2017; Walker et al., 2018). The first step in the development of DCMs is the creation of the Q-matrix which shows which items define which skill(s) (Chen et al., 2015; Köhn & Chiu, 2018; Liu et al., 2017; Bradshaw, 2016; Madison & Bradshaw, 2015). Table 1 shows a Q-matrix of a portion of the English Proficiency Test (EPT) measure, in which 8 items were aligned to each one of the A1 and A2 skills, as based on the Common European Framework (CEFR) (seeAlderson,2007;Hasselgreen,2013; Little,2007; Kusseling & Longsdale,2013). These items are dichotomously scored. More information about the instrument can be found here:(https://etec.gov.sa/EN/PRODUCTSANDSERVICES/QIYAS/EDUCATION/EPT/Pages/default.aspx).
Figure 2 Traditional and contemporary models for the assessment of skills and competencies. Horizontal lines within boxes reflect thresholds of categorical variables
As shown in Table 1, item i19 defines only A1 skills whereas items i7, i18, i21, and i14 only A2 skills. Last, items i6, i1, and i20 define both A1 and A2 skills. Then ext step in the creation of a DCM model is to define parameter values for each item. As shown in Table 2, item i19 was defined to assess only the A1 skill. Consequently, it has an intercept parameterλi,0and a main effect for skill A1 termedλi,1,(1)(and zero terms for skillA2 and the interaction between the two skills). Item 6,which defined both A1 and A2 skills, contains an intercept termλi,0,a main effect for the A1 skillλi,1,(1), a main effect for the A2 skillλi,1,(2), and an interactionterm for A1 and A2λi,2,(1,2). These terms are estimated within a confirmatory latent class model using the termsin Table 3, for estimating the outcomes in each one of the latent classes(Rupp & Templin,2008). The classes in Table 3 define each one of the four possible outcomes: the C1 class shows individuals who do not possess any of the A1 or A2 skills; the C2 class shows the presence of individuals who possess the A2 skill in the absence ofA1 (a potentially undesirable finding); class C3 shows asubgroup of individuals who achieve A1 levels of proficiency; last, C4 participants are those who possess bothA1 and A2 attributes. As shown in Table 3, each item contains an intercept term and then a slope if it defines any of the two skills, as well as an interaction term when that item defines both skills. For example, item 1 has an intercept term λ3,0, an intercept and slope terms whendefining the A1λ3,0+λ3,1,(1)or A2λ3,0+λ3,1,(2)skills, and an intercept, two linear slopes, and an interactiontermλ3,0+λ3,1,(2)+λ3,1,(1)+λ3,2,(1,2)when defining acquisition of both skills.
Table 1 Q-Matrix of 8 items belonging to 2 attributes in reading competency using the EPT as based on the CEFR framework
| Items | A1 | A2 |
| i19 | 1 | 0 |
| i6 | 1 | 1 |
| i1 | 1 | 1 |
| i20 | 1 | 1 |
| i7 | 0 | 1 |
| i18 | 0 | 1 |
| i21 | 0 | 1 |
| i14 | 0 | 1 |
Note. Item numbers reflect actual item numbers of EPT measure.
Table 2. DCM Parameter Values for reading as a second language
| Intercept | Main Effect α1 | Main Effect α2 | 2-Way Interaction | |
| Items | λi,0 | λi,1,(1) | λi,1,(2) | λi,2,(1,2) |
| i19 | 1 | 1 | 0 | 0 |
| i6 | 1 | 1 | 1 | 1 |
| i1 | 1 | 1 | 1 | 1 |
| i20 | 1 | 1 | 1 | 1 |
| i7 | 1 | 0 | 1 | 0 |
| i18 | 1 | 0 | 1 | 0 |
| i21 | 1 | 0 | 1 | 0 |
| i14 | 1 | 0 | 1 | 0 |
Note. 1=selected, 0=not selected.
4. Diagnostic Classification Models (DCMs): An Applied Example
As described above, a DCM was fit to the data from a language instrument (for the acquisition of English as a second language) for the assessment of A1 and A2 skills based on the CEFR framework of languages. The English Proficiency Test (EPT https://etec.gov.sa/EN/PRODUCTSANDSERVICES/QIYAS/EDUCATION/EPT/Pages/default.aspx) targets at determining English language competency for individuals wishing to join academic programs taught in English. It is part of a battery of tests related to university admission and is comprised of 80 multiple-choice questions assessing three domains, namely, language structure (40 items) reading comprehension (20 Items), and written analysis (20 Items).
Table 3. DCM Kernels for each item and each one of the latent classes in Reading
| C1 | C2 | C3 | C4 | |
| αC | [0,0] | [0,1] | [1,0] | [1,1] |
| 1. i19 | λ1,0 | λ1,0 | λ1,0+λ1,1,(1) | λ1,0+λ1,1,(1) |
| 2. i6 | λ2,0 | λ2,0+λ2,1,(2) | λ2,0+λ2,1,(1) | λ2,0+λ2,1,(2)+λ2,1,(1)+λ2,2,(1,2) |
| 3. i1 | λ3,0 | λ3,0+λ3,1,(2) | λ3,0+λ3,1,(1) | λ3,0+λ3,1,(2)+λ3,1,(1)+λ3,2,(1,2) |
| 4. i20 | λ4,0 | λ4,0+λ4,1,(2) | λ4,0+λ4,1,(1) | λ4,0+λ4,1,(2)+λ4,1,(1)+λ4,2,(1,2) |
| 5. i7 | λ5,0 | λ5,0+λ5,1,(2) | λ5,0 | λ5,0+λ5,1,(2) |
| 6. i18 | λ6,0 | λ6,0+λ6,1,(2) | λ6,0 | λ6,0+λ6,1,(2) |
| 7. i21 | λ7,0 | λ7,0+λ7,1,(2) | λ7,0 | λ7,0+λ7,1,(2) |
| 8. i14 | λ8,0 | λ8,0+λ8,1,(2) | λ8,0 | λ8,0+λ8,1,(2) |
Note. λ1,0=intercept of item 1. The c-term denotes latent class.
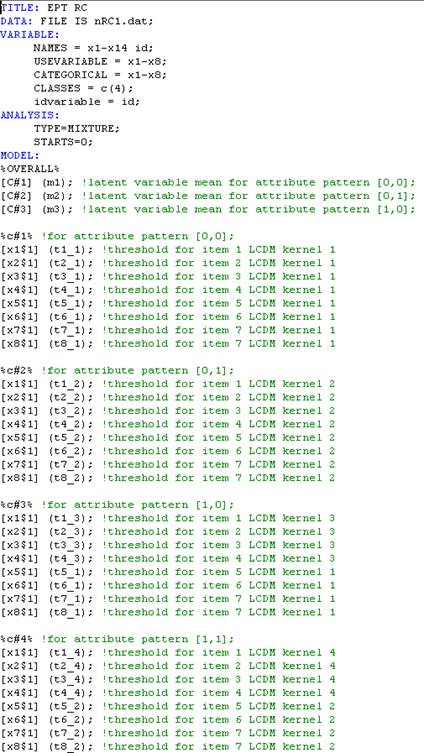
Participants were 2642 examinees who took on the English Proficiency Test (EPT), measure as part of their English competency exam. The specific items were designed to assess two attributes or skills, namely, A1 and A2 as per the CEFR framework. The hypothesis put forth was that there would be a distinct group possessing A1 skills, a group having both A1 and A2 skills, and, more interestingly, would examine the presence of a group that does not possess any of the two skills, called pre-A1 level, which has been observed in certain cultures. Data were analyzed using the Q-matrix in Table 1, the parameters in Table 2, and the LCDM cognitive Kernel functions in Table 3 (see also DiBello et al., 2015). Furthermore, data were also analyzed using a variable based approach and the confirmatory factor models of 2-factor correlated, and bifactor models (see Figure 3). All models were analyzed using Mplus 8.7. An annotated syntax file using Mplus that was used for the DCM model in Figure 4 is shown in Appendix A.
As Figure 3 shows, both a 2-factor correlated model and a bifactor model provided a very good model fit using both absolute and relative criteria [2-factor model: χ 2(19) = 36.566, p = .009, CFI=.999, TLI=.998; RM- SEA=.019; bifactor model: χ 2(12) = 20.160, p = .064, CFI=.999, TLI=.998; RMSEA=.016]. Specifically, the 2-factor correlated model showed significant factor loadings for each indicator on the respective latent construct. Furthermore, the bifactor model provided a superior model fit with the general factor being a dominant factor and the two specific factors losing most of the explanatory power. Subsequently, factor scores reflecting person’s abilities were saved for further scrutiny.
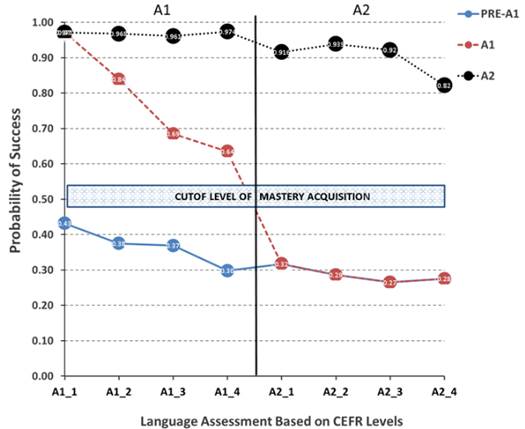
For comparative purposes, data were also analyzed using a 2-class and a 3-class exploratory model with no constraints on the latent class formation, thus, subgroups emerged in an exploratory fashion. Last, when data were analyzed by use of the DCM model, results indicated the presence of three distinct subgroups: a group having neither A1 and A2 skills, termed pre-A1 level group, which comprised 830 participants, representing 31.4% of the samples’ participants. A group having A2 skills in the absence of A1 was not observed, as expected, having zero participants. Two groups with A1 and A2 skills reflected 399 and 1,413 participants, which accounted for 15.1% and 53.5% of the participants. These results are shown in Figure 4 with the preA1 class showing response probabilities less than 50% throughout, A1 participants being successful on only the 4 specific A1 items, and A2 individuals being successful with a probability of success greater than 50% on all eight language items. Table 4 presents model comparisons across several competing models. As shown in the table and based on information criteria, the best model fit was linked to a 3-class exploratory model. However, this model was not interpretable with regard to the measurement of specific skills and competencies, that is, A1 and A2 levels, because there was a class with mixed skills that are against the logic of mastery put forth by DCM models. Consequently, the 3-class exploratory model was not deemed appropriate. From the remaining models, a superior model fit emerged for the DCM model with 3 skills, including the interesting pattern of [0,0], suggesting the absence of minimum levels of A1 skills. A similar model fit was observed by the 2-class exploratory model and the bifactor models that have a close resemblance to the DCM model but were inferior in model fit. Last, the worst fit was observed by the 2-factor correlated model.
In an attempt to compare and contrast person-based estimates from the factor model and the DCM, scatterplots were created, as shown in Figure 5. The upper panel of the figure shows factor scores based on the 2-factor correlated model, which were related to the person-based estimates, based on the latent class representing pattern [1,0]. The relationship between the two estimates was only 0.487, which is at best modest. The lower panel of the figure shows the relationship between the general factor scores, from the bifactor model (reflecting ability estimates at A1 and A2) in relation to the latent class of the DCM representing pattern [1,1]. The relationship was .927, relating the two person-based estimates, which were very high. However, the scores at A1 level skill were very discrepant between the factor model and the DCM, showing disparate estimates of person ability. Furthermore, no comparison was available for the class lacking A1 skills (i.e., pattern [0,0]), as the fac-tor model could not provide scores for such a subgroup.
Table 4. Model Fit Comparison Using Evaluative Criteria
| Model Comparison | LL | Npar | AIC | BIC | SABIC | CAIC | WE |
| 2-Factor Correlated | −10548.79 | 17 | 21131.59 | 21231.53 | 1177.52 | 21248.53 | 1416.48 |
| 2-Class Exploratory | −10554.82 | 17 | 21143.65 | 21243.60 | 21189.58 | 1260.60 | 1428.54 |
| Bifactor Model | −10540.11 | 24 | 21128.21 | 21269.31 | 21193.06 | 1293.31 | 1530.42 |
| 3-Class Exploratory | −10433.85 | 26 | 20919.69 | 21072.56 | 20989.95 | 21098.56 | 1355.42 |
| DCM: 3 Skills | −10483.34 | 27 | 21020.68 | 21179.42 | 21093.64 | 21206.42 | 1473.16 |
Note. λ1,0=intercept of item 1. The c-term denotes latent class.
5. Conclusions, Limitations and Recommendations for Future Research
The primary purpose of the present study was to inform and illustrate, using examples, the use of Diagnostic Classification Models (DCMs) for the assessment of skills and competencies in language skills and competencies. A secondary purpose is to compare and contrast traditional and contemporary psychometrics for the measurement of skills and competencies. The most important finding of the present application was that three distinct language skills groups were observed by use of the DCMs, including the recently observed pre-A1 group across various countries (e.g., Bower et al., 2017). The pre-A1 group was comprised of ample participants who did not possess the required level of A1 proficiency as delineated by the CEFR framework, certainly not in the Kingdom of Saudi Arabia.
The present findings, however, are very important, especially when contrasted with those of traditional methodologies such as the factor model (Gorsuch, 1983). Relationships between person-based estimates of ability and those from the DCM were modest, to say the least when looking at the A1 skill. Consequently, estimates of person skill acquisition by use of the factor model are clearly inappropriate in light of the advanced knowledge provided by the CDMs. A significant difference between the two is that the factor model addresses the question of degree of acquisition in total, and in the absence of requisite and other skills that extend beyond the person’s level. All that information is included in the factor model and contributes to the estimation of persons’ skills and competencies. In the DCMs, however, a skill is clearly defined as being dependent upon a specific set of competencies and excludes other competencies that potentially confound the measurement ofa person’s abilities. For that reason, DCMs represent amore accurate estimate of a person’s set of skills.
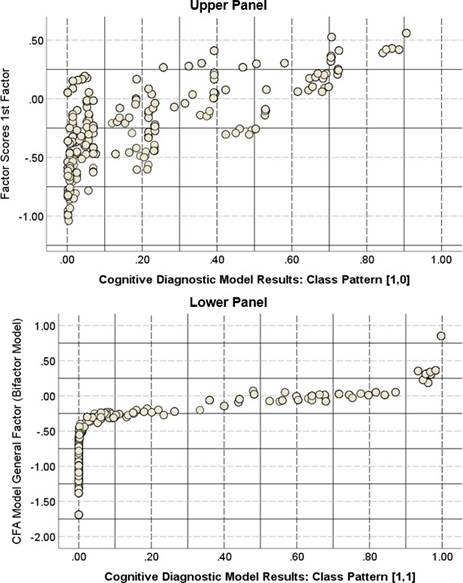
Figure 5 Comparisons between person estimates of ability as based on the factor model and the DCM model’s estimates. Values on the y-axis are factor scores from the first factor (A1) of the CFA model (upper panel) and in the lower panel, factor scores from the general factor of the bifactor model in CFA
The present findings have several limitations. One of the potential limitations reflects a large number of available DCM models and the proper choice among them (Alexander et al., 2016; Bonifay & Cai, 2017; Bozard, 2010; Bradshaw & Madison, 2016; Bradshaw et al., 2014; Davier, 2009). A second limitation put forth by Raykov relates to the internal consistency estimates of latent subgroups reflecting specific skill levels (see Huang, 2017). A third potential limitation reflects accounting for complex structures and also the presence of covariates in the model that likely alter person’s estimates of skills (Xia & Zheng, 2018). For example, in a measure of learning disabilities, how would a measure of IQ as a covariate will factor in the model? (See McGill et al., 2016). A fourth potential limitation reflects disparate opinions on what constitutes a proper measure of global fit in DCM models in light of challenges related to the number of response patterns and consequently the degrees of freedom, etc. (Hansen et al., 2016). A fifth limitation relates to the estimation of item discrimination parameters (Henson et al., 2018) and that of personbased estimates of fit (Emons et al., 2003). Last, issues on the measurement of reliability of DCM Kernes have been raised (Templin & Bradshaw, 2013). Conversely, future directions may target at empirically investigating how to deal with these potential limitations, as well as a methodological extension such as the use of DCMs in Computerized Adaptive Testing (CAT) environments (Wang, 2013). For example, accounting for complex structures may involve simply modeling random effects to incorporating stratification weights.