


 Inglês (pdf)
 Artigo em XML
 Referências do artigo
 Enviar este artigo por email
 Citado por SciELO
  Citado por Google
  Similares em
SciELO
Similares em
SciELO  Similares em Google
 Permalink
1. Introduction
Over the past two decades, the number of studies and theoretical work on emotional intelligence (EI) has grown consistently, including increasing evidence in favor and against the validity and reliability of EI measures (Ackley, 2016; Davis & Nichols, 2016; Fiori & Vesely-Maillefer, 2018; Goldenberg et al., 2006; Siegling et al., 2015; Stough et al., 2009). Although EI is a construct developed from different theoretical models and measuring methods, it has been used to understand people’s capacity to manage their own emotions, adapt to the environment, and relate to others (Ackley, 2016; Roberts et al., 2010), as well as predict academic performance (MacCann et al., 2020; Sánchez-Álvarez et al., 2020), health (Martins et al., 2010), and well-being (Sánchez-Álvarez et al., 2016). Therefore, obtaining instruments with a low measurement error and a high fit index for different cultures and populations is becoming increasingly important. It is especially critical for measuring in youth as their socioemotional development is correlated with various measures of success later in life (Brackett et al., 2011). In this article, we analyze the structure of the Emotional Quotient Inventory: Youth Version (EQ-i: YV[S]) (BarOn & Parker, 2000), describe its psychometric characteristics, and investigate how it works with a specific population. EQ-i: YV[S] is a measure that requires more investigation because it is one of the most widely used and has to be less inconsistent across the studies (Sánchez-Álvarez et al., 2020).
1.1 Models and Measurement of EI
One concern for theory on EI is the conceptual heterogeneity of distinct approaches, that is, whether it is considered an ability, a trait or a mixed-model (Goldenberg et al., 2006; Keefer et al., 2018). The ability EI (AEI) model defines EI as a system of cognitive abilities to reason or process emotional information by perceiving, using, understanding, and managing emotions and their meanings in one’s self and in others (Mayer et al., 2016). The trait EI (TEI) model, in contrast, conceives EI as a constellation of dispositional tendencies and self-perceptions about emotional functioning, preferences, and qualities, such as perception (self and others), expression, emotion regulation, adaptability, and assertiveness (Petrides, 2010; Petrides et al., 2016).
Each approach has different features and produces distinct measuresand results (Petrides & Furnham, 2001). The TEI model is based on a personality framework and is often studied through a typical-performance measure, such as a self-report of behavioural tendencies and perceived abilities (Petrides, 2009). In contrast, AEI model assumes that EI develops over time and is related to cognitive intelligence. Researchers using this approach often employ maximum-performance measures evaluating particular abilities. In other words, objective measures to e-valuate individuals’ capacities across different emotional tasks without right or wrong answers (Mayer et al., 2002).
In spite of the differences between approaches, there are mixed-models that attempt to reconcile them. Baron (2006) does so through the concept of Social and Emotional Intelligence (SEI): a combination of traits, competences, emotional abilities, and faculties. SEI encompasses how we express ourselves, understand others, and deal with demands and environmental pressures. This model is shaped by five high-level factors: intrapersonal competencies, interpersonal proficiency, adaptability, stress management, and general mood. Intrapersonal skills refer to understanding and being aware of one’s own emotions, feelings, and ideas. Interpersonal skills are the capacity to understand and being aware of other’s emotions, feelings, and ideas. Adaptability is the ability to modify emotions depending on each situation. Stress management is the ability to control and tolerate emotions. Finally, general mood is the aptitude to express and feel positive emotions, such as being optimistic (Bar-On, 2006).
1.2 Measuring SEI
To evaluate the SEI model, Bar-on (1997) developed a self-report questionnaire for adults. It comprises 133 items assessing five scales and 15 subscales. The instrument provides a measure of the level of EI, as well as an affective and social profile of the individual. Building on this work, Bar-On and Parker (2000) created the EQ-i: YV long and short form to evaluate children and adolescents from ages 7 to 18. This measure uses the same theoretical model that was used to build the scale for adults. The short form contains 30 items assessing four scales (interpersonal, intrapersonal, stress management, adaptability) and a desirability social scale (positive impression). It was designed as an alternative to the long form to use when time is limited.
EQ-i: YV has been translated into numerous languages and applied in different countries and cultures, such as Lebanon (Hassan & Sader, 2005), Hungary (Kun et al., 2012), Spain (Esnaola et al., 2016; Ferrándiz et al., 2012; Gilar-Corbi et al., 2021), United Kingdom (Davis & Wigelsworth, 2017), China (Esnaola, Arias, et al., 2018), Oman (Said et al., 2013), Peru (Merino et al., 2014; Ugarriza & Pajares-Del-Águila, 2005) and Mexico (Esnaola, Azpiazu, et al., 2018; Ruvalcaba et al., 2014). In Colombia, EQ-i: YV has been used to analyze the difference between children from rural and urban contexts (Herrera et al., 2017) and by age ranges (Buitrago et al., 2019). However, none of these studies has examined psychometric properties in this population.
1.3 Validity and Reliability of EQ-i and EQ-i: YV
Bar-On and Parker (2000) conducted an initial validation of the EQ-i: YV[S] from a large dataset with the long version. The short version was created by selecting 30 items that obtained the highest loads for the five scales through a hierarchical model. This procedure has been criticized as inadequate to establish psychometric properties for a short measure and as changing the internal structure of the instrument (Smith et al., 2000). Further studies with the short form have suggested potential issues, such as evidence supporting unidimensional, multidimensional, hierarchical, and bidimensional models. For example, in an application with Hungarian adolescents, Kun and colleagues (2012) confirmed a multidimensional five-factor structure including the positive impression scale, but they also excluded six items (Items 12, 15, 20, 26, 28, and 30) from different scales and found significant correlations between two pairs of errors (Items 8-9; Items 19-24).
Other studies have excluded the positive impression scale from a multidimensional model of SEI, improving loading factor items and their errors. A study with a Chinese sample found a good fit to a multidimensional structure with four first order factors (intrapersonal, interpersonal, stress management, and adaptability) and only identified two items (Items 1 and 18) with low factor loadings (Esnaola et al., 2017). Similar findings were obtained by Davis and Wigelsworth (2017) in a study with British adolescents. They eliminated two items (Items 12 and 26) from the total scale. In contrast, other applications with children in Mexico (Esnaola, et al., 2018) and Spain (Esnaola et al., 2016) found that a secondorder model (i.e., hierarchical) provided an optimal fit for four first-order correlated scales and a general factor of SEI. The findings with Mexican and Spanish populations also suggested possible issues because of item error correlations. In general, all these studies found a poor fit to a unidimensional and bidimensional structure.
Furthermore, methodological contradictions have been identified among the methods used to analyze the empirical validity of the EQ-i and the long and short form of the EQ-i: YV (Davis & Wigelsworth, 2017; Esnaola et al., 2016; Esnaola, et al., 2018; Parker et al., 2011; Stanimirovic & Hanrahan, 2012). Factorial analysis show that orthogonal methods are most commonly selected. However, empirical evidence indicates that EQ-i: YV[S] factors are theoretically related. In this case, it is recommended to use first-order models or factorial analysis with direct Oblimin or Promax rotations to establish a concrete relation between the traits. Additionally, some studies have indicated that stress management is not correlated with the rest of the scales (Davis & Wigelsworth, 2017; Esnaola et al., 2017; Kun et al., 2012). These various concerns and contradictions indicate that it is necessary to increase the evidence around the factorial structure fit.
In terms of the reliability of the EQ-i: YV[S] BarOn & Parker (2000) reported moderate to satisfactory internal consistency (α = .65 to .87), and satisfactory inter-item correlations (.15 to .55) and test-retest indices (.81 to .88). Later studies provided similar evidence for reliability of the full scale (α = .64 to .80; Davis & Wigelsworth, 2017; Esnaola et al., 2016; Said et al., 2013). Although internal consistency reliability levels have been widely found to be suitable for the full scale, empirical evidence reveals differences in correlation coefficients for its subscales. Some studies report unacceptable and poor internal consistency (α = .23 to .58) for the intrapersonal scale (Davis & Wigelsworth, 2017; Said et al., 2013; Ugarriza & Pajares-Del-Águila, 2005), and questionable (α = .51 to .64) and acceptable (α = .65 to .77) reliability coefficients for the interpersonal scale (Davis & Wigelsworth, 2017; Esnaola et al., 2016; Esnaola et al., 2018; Kun et al., 2012; Said et al., 2012; Ugarriza & Pajares-Del-Águila, 2005). Other studies indicate that the stress management and adaptability subscales barely meet recommended levels of reliability (α = .80 to α = .82) for use in clinical work (Smith et al., 2000). Finally, inadequate internal consistency (α = .23 to .66) for all subscales has been found on children between 7 and 10 years old (Said et al., 2013; Ugarriza & Pajares-Del-Águila, 2005). These internal consistency differences could be explained by the method used to estimate the reliability in most studies.
1.4 The Current Study
Based on the existing literature, EI is a useful and widely employed construct to predict positive outcomes (i.e., academic achievement, health, and well-being) in children and adolescents. Bar-On’s SEI theory and the EQ-i: YV[S] scale to measure it offers a holistic approach that integrates abilities and traits and provides a broader framework to study EI (Bar-On & Parker, 2000). Still, as described, the EQ-i: YV[S] has shown differences in factorial structure and in the number of items and reliability across the samples analyzed. Furthermore, there has been no work assessing the psychometric properties of the EQ-i: YV[S] with a Colombian population. Hence, this study tests the validity of the EQi: YV[S] by analyzing its dimensionality and internal structure. This is done by comparing unidimensional, bidimensional, multidimensional, and hierarchical models. We also analyze the reliability with McDonaldťs omega. Considering that EQ-I is a measure of individual features and abilities to cope with context pressures and demands, we also explore the predictive validity of the measure with a coping scale for children. Finally, we examine the relationships between gender, school level (i.e., primary and secondary), type of school (i.e., public and private) and EQ-i: YV[S] scores.
2. Method
This was a psychometric study using quantitative methodology with individual cross-cutting measures. Students were selected from a database provided by Tunja’s and Sogamoso’s Education Secretary. Botharemid-sizedcities of approximately 350000 people in Colombia’s northwest with high rates of poverty rate (around 30%).
2.1 Participants
A probabilistic sampling was conducted from the set of elementary and secondary students in Tunja and Sogamoso between 8 and 14 years old (N = 1355; M age = 10.80; SD = 1.41). This population was stratified by type of school (public and private), level (primary and secondary), gender (males and female), and age (8 to 14 years old). We chose the sample through proportional random assignment, multistage of clusters and without replacement with a reliability of 95%. Inclusion criteria were age and enrolment in a public or private school located within the urban area. Exclusion criteria were a medical or developmental disorder. Child risk status was obtained during the consent process that involved interviews with parent.
2.2 Instruments
The Emotional Quotient Inventory: Youth Version Short, EQ-i: YV[S] (Bar-On & Parker, 2000), is a self-report instrument designed to measure emotional intelligence in children and adolescents aged 7 to 18 years. It consists of 24 items across four subscales: intrapersonal competencies, interpersonal proficiency, stress management, and adaptability. There are also six items from a positive impression subscale to identify socially desirable responding. The first four subscales generate the total EQ-i score. The instrument uses a 4-point Likert style format (very seldom true of me, seldom true, often true, and very true). For this study, we used a Spanish version that was validated with a Peruvian population (α = .77 to .88, matching the original questionnaire; Ugarriza & Pajares-Del-Águila, 2005). Itwas unnecessary to perform linguistic or cultural adaptations because we did not find significant differences with the Colombian context.
The Children’s Coping Scale (Spanish acronym EAN; Morales-Rodríguez et al., 2012) is a self-report measure designed to evaluate coping strategies of primary school children. The scale evaluates the coping strategies in two coping style groups: problem-focused coping and nonproductive coping. It is comprised of 35 items rated on a 3-point Likert-type scale, with responses ranging from 1 (never) to 3 (many times). Morales-Rodríguez and colleagues found a high internal consistency for both the nonproductive style (α = .85) and problem-focused style (α = .85) subscales. In the current research the Cronbach’s alpha was also adequate for both the nonproductive style (α = .60) and problem-focused style (α = .65) subscales.
2.3 Procedure
For this study, it was necessary to obtain the approval and endorsement from schools, parents, and children. Participants were informed of the confidentiality and anonymity, and voluntary nature of participation. None of the participants received any reward for taking part in the study. Data gathering took place in a regular classroom by trained psychologists. Students completed the instrument in print format. The study protocol was approved by the IRB of the Santa Fe Foundation in Colombia.
2.4 Analytic Procedure
To analyze the psychometric properties of the EQ-i: YV[S] four steps were followed using the three statistical programs: JASP 0.12, SPSS 28, and AMOS 24.0.
2.4.1 Step 1: Data Cleaning
Data screening showed some missing data for item responses, but it represented less than 1% of the overall data. Individual missing items were replaced with mean values as per guidance from individual measures (Puma et al., 2009). The distributional assumptions were also examined using Mardia’ test for multivariate normality (Kurtosis coefficient=715.143, normalized estimate=39.529; Skewness coefficient=36.056, χ 2 = 5642.789, df = 2600).
The selected sample was then randomly divided into two sets. Dataset 1 was composed of 416 students (30% of overall sample) and was used to perform Exploratory Factor Analysis (AFE). It included 221 girls (53%) and 195 boys (47%) between 8 and 14 years old (M = 10.97; SD = 1.35; M = 10.74 and SD = 1.27, respectively). In dataset 1, 362 students (87%) attended public schools and 54 (13%) went to private schools. In dataset 2, 881 students (86.5%) were from public schools and 294 (31%) attended private schools. Dataset 2 was comprised of 939 students (70% of overall sample) and was used to perform Confirmatory Factor Analysis (CFA). It included 488 girls (52%), and 451 boys (48%) between 8 and 14 years old (M = 10.85; SD = 1.39 and M = 10.75; SD = 1.35, respectively).
2.4.2 Step 2: EFA
To investigate the internal structure, an EFA was conducted through Parallel analysis with O.L.S. extraction method, rotation oblimin and minimum saturation criterion of 0.30 per item (Bandalos & Finney, 2019). KaiserMeyer-Olkin (KMO>.07; p < .05), and Bartlett’s test indices were used to verify the adequacy of the sample size, their correlations, and the number of variables for the viability of factorial analysis. Positive impression items were not included because this scale measured social desirability, which is not the focus of this paper. The analysis was conducted with dataset 1 (n 1 = 416).
2.4.3 Step 3: CFA
An Exploratory Structural Equation Modeling (ESEM; Asparouhov & Muthén, 2009) was used to carry out a CFA with the model obtained in the AFE step. The analysis was performed with dataset 2 (n 2 = 939). A Maximum Likelihood method was selected for analyzing the four theoretical dimensions from the Bar-On and Parker (2000) model. A range of model fit indicators were used to evaluated goodness of fit. Chi-square values were examined. For Root Mean Square Error (RMSEA) of approximation with 90% confidence intervals, values less than .05 indicate good fit and less than .08 reasonably good fit (Tabachnick & Fidell, 1996). To examine incremental fit measures, the Comparative Fit Index (CFI) and the TuckerLewis Index (TLI) were used. These indices range in value from 0 to 1.00, with values > .90 indicative of a reasonably good fit and values of .95 to be indicative of good fit (Marsh et al., 2004). Akaike information criterion (CAIC) also was included, with the smallest value indicating the model that provided the best balance between goodness of fit and model parsimony (Bozdogan, 2000).
In line with earlier validation studies to assess the fit of internal structure of EQ-i: YV-S (Esnaola, Arias, et al., 2018; Parker et al., 2011), four models were examined: a one-factor model with all items loading into a single factor (M1 unidimensional); a first-order factor model with correlated latent variables for each of the four subdomains (M2 multidimensional); a second-order factor model with a four first-order factors and a one second-order factor of general Socio Emotional Intelligence (SEI; M3 hierarchical); and a bifactor model with a general factor SEI and four specific factors where SEI and specific factors are orthogonal (M4 bidimensional).
2.5 Step 4: Reliability and Correlations
Two methods of estimating internal consistency reliability were used: Cronbrach’s alpha (α > .65 to .80) and McDonald’s omega (ω > .65) (Vaske et al., 2017). It is important to note that while Cronbach’s alpha is the most popular method to estimate the reliability of internal consistency to self-report measures, it has been criticized due to its tendency to be affected by the number of items, answer options, and test variance ratio (Lozano et al., 2008). The assumptions underlying Cronbach’s alpha are likely not met in practice and could underestimate the real reliability score (Ginac, 2009; Vaske et al., 2017). From a factorial analysis framework, McDonald’s omega coefficient is an effective alternative for estimating reliability (McDonald, 1999). It uses standardized factor loadings to estimate the value of reliability regardless of the number of items. Also, it is recommended when the assumption of tau-equivalence (i.e., equal factor loadings of all test items) is violated (Trizano-Hermosilla & Alvarado, 2016).
Additionally, we obtained the mean and standard deviation by gender for each scale of EQ-i: YV[S] using dataset 2. Pearson correlations coefficients were used for the assessment of relations between scales.
2.5.1 Step 5: Predictive Validity
Previous studies have indicated that children and adolescents who have higher scores on emotional intelligence traits tend to exhibit more adaptive coping (Davis & Humphrey, 2012; Keefer et al., 2013; Resurrección & Salguero, 2014). Given these associations between emotional intelligence and coping strategies, we analyzed whether the EQi: YV[S] subscales predict problem-centered and nonproductive coping strategies. A linear regression model was conducted for each of these coping strategies assessed with EAN scale (Morales-Rodríguez et al., 2012).
3. Results
3.1 Internal Structure
EFA was carried out with dataset 1 (see Table 1). Results show the same factorial distribution proposed by Bar-On and Parker (2000). The Kaiser-Meyer-Olkin (KMO) value (.768) and Bartlett test (χ 2 (df =276; n=416) =1613.419, p = .000) were statistically significant, demonstration intercorrelation between the items. The variance explained was 27.6% and 21 items were saturated, exceeding the recommended .30. Items 12 (“It is hard to talk about my deep feelings”), 26 (“I have trouble telling others about my feelings”), and 4 (“I am capable of respecting others”) were excluded due to loading values close to zero.
Table 1 Factor Loadings Exploratory Analysis
| F1 | F2 | F3 | F4 | Uniqueness | |
| IE1 | -.073 | .014 | .038 | .345 | .866 |
| IE2 | -.080 | .052 | .541 | -.081 | .709 |
| IE4 | .220 | .159 | .073 | .152 | .865 |
| IE5R | .684 | -.022 | -.002 | .011 | .534 |
| IE6 | .053 | .017 | .600 | .098 | .588 |
| IE8R | .339 | -.160 | .109 | .175 | .829 |
| IE9R | .645 | -.026 | .068 | -.064 | .566 |
| IE10 | .051 | .538 | .035 | .034 | .682 |
| IE12R | .042 | -.123 | .034 | -.079 | .973 |
| IE13 | .029 | .710 | .019 | -.083 | .518 |
| IE14 | .024 | .144 | .394 | -.001 | .792 |
| IE16 | -.083 | .351 | .118 | .017 | .835 |
| IE17R | .733 | .040 | -.064 | .045 | .467 |
| IE18 | .038 | .018 | .111 | .420 | .783 |
| IE19 | .010 | .408 | .010 | .143 | .773 |
| IE21 | -.014 | -.020 | .580 | -.000 | .671 |
| IE22 | .043 | .330 | .046 | .168 | .811 |
| IE23 | .009 | -.050 | .060 | .630 | .603 |
| IE24 | -.032 | .567 | .012 | .075 | .642 |
| IE26R | .030 | -.200 | .038 | -.014 | .960 |
| IE27R | .618 | .050 | -.009 | -.033 | .615 |
| IE28 | -.027 | .157 | -.116 | .452 | .741 |
| IE30 | -.140 | .254 | -.072 | .326 | .770 |
Note. F1= Stress management; F2= Adaptability; F3=Intrapersonal; F4=Interpersonal.
Table 2 SEM Confirmatory Factor Analysis Fit Indexes (n 2 = 939)
| Model Fit | Baseline Comparisons | Parsimony-Adjusted Measures | |||||||||||
|---|---|---|---|---|---|---|---|---|---|---|---|---|---|
| Model | Type | χ2 | df | χ2/df | RMSEA | CI 90% | CFI | TLI | NFI | PRATIO | PCFI | PNFI | AIC |
| M1 | Unidimensional | 1865.774 | 189 | 9.89 | .097 | .093-.101 | .462 | .402 | .439 | .900 | .416 | .395 | 1991.774 |
| M2 | Multi-dimensional | 334.358 | 183 | 1.82 | .030 | .025-.035 | .951 | .944 | .899 | .871 | .829 | .784 | 472.358 |
| M3 | Hierarchical | 1865.774 | 189 | 9.87 | .097 | .093-.101 | .462 | .402 | .439 | .900 | .416 | .395 | 1991.774 |
| M4 | Bidimensional | 246.091 | 168 | 1.46 | .022 | .016-.028 | .975 | .969 | .926 | .800 | .780 | .741 | 414.091 |
Note. χ 2 = Chi square; df = degrees of freedom; CFI=Comparative Fit Index; TLI = TuckerLewis Index; SRMR = Standardized Root Mean Square Residual; RMSEA = root mean square error of approximation; CI=Confidence Interval; PRATIO= Parsimony Chi-Square Normative; PCFI=Parsimony Criterion Fit Index; PNFI= Parsimony Normative Fit Index; AIC= Akaike information criterion.
Table 3 Models factor structure of EQ-I: YV[S] scales Standardized Regression Weights
| Scale/Item | M1 | M2 | M3 | M4 | |||
|---|---|---|---|---|---|---|---|
| Item | SEI | ||||||
| Intrapersonal | 1 | ||||||
| IE2 It’s easy to tell people how I feel (Es fácil decirle a la gente cómo me siento) | .271 | .459 | .073 | .402 | .218 | ||
| IE6 I can easily talk about my feelings (Puedo hablar fácilmente sobre mis sentimientos) | .338 | .641 | .114 | .592 | .252 | ||
| IE14 I can easily describe my feelings (Puedo fácilmente describir mis sentimientos) | .350 | .557 | .122 | .459 | .300 | ||
| IE21 For me, it is easy to tell people how I feel (Para mí es fácil decirle a las personas cómo me siento) | .279 | .561 | .078 | .539 | .211 | ||
| Interpersonal | 1 | ||||||
| IE1 I care what happens to others (Me importa lo que les sucede a las personas) | .276 | .402 | .076 | .354 | .227 | ||
| IE18 I like doing things for others (Me agrada hacer las cosas para los demás) | .426 | .523 | .182 | .339 | .381 | ||
| IE23 I feel bad when people get hurt in their feelings (Me siento mal cuando las personas son heridas en sus sentimientos) | .426 | .595 | .182 | .565 | .368 | ||
| IE28 I can tell when my friend feels sad (Puedo darme cuenta cuando mi amigo se siente triste) | .362 | .482 | .131 | .326 | .340 | ||
| IE30 I know when people are upset even when they don’t say it (Se cuando la gente esta molesta aun cuando no dicen nada) | .381 | .444 | .145 | .176 | .374 | ||
| Adaptabilidad | 1 | ||||||
| IE10 I can understand difficult questions (Puedo comprender preguntas difíciles) | .505 | .563 | .255 | .503 | .418 | ||
| IE13 I can give good answers to difficult questions (Puedo dar buenas respuestas a preguntas difíciles) | .532 | .599 | .283 | .477 | .465 | ||
| IE16 When I want, I can have many ways of answering difficult questions (Puedo tener muchas maneras de responder una pregunta difícil cuando yo quiero) | .474 | .505 | .225 | .188 | .458 | ||
| IE19 I can easily use several ways of solving problems (Puedo usar fácilmente diversos modos de resolver los problemas) | .523 | .532 | .273 | .080 | .541 | ||
| IE22 When I answers difficult questions, I try to think in several solutions (Cuando respondo preguntas difíciles, trato de pensar en muchas soluciones) | .520 | .521 | .271 | -.016 | .591 | ||
| IE24 I am good at solving problems (Soy bueno(a) resolviendo problemas) | .502 | .540 | .252 | .235 | .475 | ||
| Stress Management | 1 | ||||||
| IE5R I get mad for everything (Me molesto demasiado de cualquier cosa) | .122 | .649 | .015 | .644 | .075 | ||
| IE8R I fight with people (Peleo con la gente) | .095 | .409 | .009 | .407 | .060 | ||
| IE9R I have bad temper (Tengo mal genio) | .071 | .637 | .005 | .638 | .018 | ||
| IE17R I get upset easily (Me molesto fácilmente) | .115 | .731 | .013 | .727 | .058 | ||
| IE27R I am feeling blue easily (Me siento triste fácilmente) | .106 | .624 | .011 | .621 | .062 | ||
| IE29R When I get upset, I act without thinking (Cuando me molesto actúo sin pensar) | -.031 | .420 | .001 | .431 | -.088 | ||
Note. SEI= Socioemotional Intelligence; M1= Unidimentional; M2= Multi-dimentional; M3= Hierarchical; M4= Bidimentional.
Table 4 Models factor structure of EQ-I: YV[S] scales Standardized Regression Weights
| Scales | Total sample (n = 939) | Females (n = 488) | Males (n = 451) | |||||||||||
|---|---|---|---|---|---|---|---|---|---|---|---|---|---|---|
| M | SD | ω | α | IC | M | SD | ω | α | IC | M | SD | ω | α | IC |
| Intrapersonal 7.80 | 2.61 | .643 | .638 | .598-.674 | 7.86 | 2.65 | .655 | .649 | .595-.697 | 7.73 | 2.57 | .626 | .625 | .505-.679 |
| Interpersonal 13.79 | 3.21 | .578 | .573 | .505-.635 | 13.61 | 3.08 | .575 | .566 | .502-.624 | 13.99 | 3.34 | .648 | .644 | .589-.693 |
| Stress management 18.98 | 3.70 | .756 | .750 | .725-.774 | 19.16 | 3.53 | .737 | .732 | .693-.767 | 18.79 | 3.86 | .773 | .769 | .734-.800 |
| Adaptability 15.49 | 3.63 | .715 | .713 | .684-.741 | 15.79 | 3.52 | .694 | .692 | .648-.732 | 15.16 | 3.73 | .733 | .731 | .691-.768 |
Note. Dataset 2; Intrapersonal: 4 items; Interpersonal: 5 items; Stress Management: 6 items; Adaptability: 6 items.
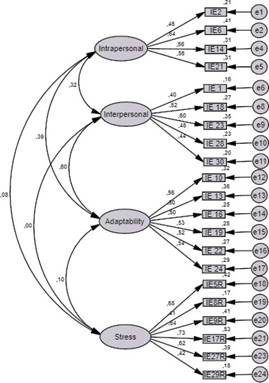
Subsequently, CFA analyses were conducted with the items obtained in the EFA using dataset 2 (see Table 2). The unidimensional model (M1) and hierarchical model (M3) fit the data poorly. The bidimensional model (M4) produced a better fit, but it obtained low factor loading in most of the items both for latent factors and general factor (see Table 3). The multidimensional model (M2) demonstrated good fit: Chi square rates over degrees of freedom was closer to 1; RMSEA index showed lower values (< .04); and a CFI, TLI values was upper to .9 except to NFI. Parsimony-Adjusted Measures were acceptable and AIC value was the lowest value for all four of the models. Also, M2 obtained high factor loading with a range of .40 to .73 (see Figure 1) and moderately correlation (r = .40, .68) between intrapersonal, interpersonal, and adaptability latent domains, but stress management was not correlated with the other latent domains. These results indicate that the stress management scale is orthogonal to the other scales in M2.
3.2 Reliability and Descriptive Analysis
Means, standard deviations, and internal consistency coefficients (Cronbach’s α and McDonald ω) for dataset 2 are presented in Table 4. Internal consistency values were modest (>.60) to acceptable (>.70) for most EQi: YV[S] scales, except for interpersonal stress. Similar coefficients were obtained for both males and females, except for the interpersonal scale that had lower values for females (>.50). Internal consistency analysis established that the grouped items were related to their specific factor. Significant differences were found between average scores for stress management and gender (t(df =937;n=939) = 2.688, p = .008), with small effect size (d = .10) females reporting higher scores than males. Significant statistical differences were not found between other scales and gender, school type (i.e., public and private), or school level (primary-secondary).
Interitem correlation values related to the EQ-i: YV[S] dimensions were moderately and positively related. Significant correlations included intrapersonal and interpersonal (r = .321), intrapersonal and adaptability (r = .393), interpersonal and adaptability (r = .593), and stress management and adaptability (r = .104). There was no significant correlation between the intrapersonal and interpersonal scales.
3.3 Predictive Validity
In model 1, EQ-i: YV[S] subscales explain 18.5% of observed variance in problem-centered coping scores F(4,903) = 52.353, p < .001. Interpersonal (β = .283; CI = .354, .568), Adaptability (β = .172; CI = .162, .037) and Intrapersonal (β = .095; CI = .073, .349) scales were statistically significant. In model 2, EQ-i: YV[S] subscales explain 11.2% of observed variance in nonproductive coping strategies scores F(4,903) = 29.479, p < .001. Stress management (β = .318; CI = .575, .388) and Intrapersonal (β = .101; CI = .367, .079) scales were statistically significant.
4. Discussion
The purpose of this study was to confirm the psychometric structure of EQ-i: YV[S] with a sample of Colombian children between 8 and 14 years of age. The EFA results indicated that items are significantly correlated and the questionnaire has a multidimensional structure, and cluster according to Bar-On’s SEI Model (2006). These results suggest the questionnaire include a multifactorial set of interrelated emotional and social competencies, skills, and facilitators (Bar-On & Parker, 2000). The findings from these analyses were consistent with most previous research (Davis & Wigelsworth, 2017; Esnaola et al., 2016; Esnaola et al., 2018; Esnaola et al., 2018; Ugarriza & Pajares-Del-Águila, 2005).
The CFA provided evidence that multidimensional and bidimensional models obtained better fit indexes than unidimensional and hierarchical models. The multidimensional model also had higher factor loadings for items and factor correlations than the bidimensional model. Similar findings pointing toward a multidimensional model were found in a studies with a Chinese sample (Esnaola et al., 2017; Kun et al., 2012).
In the current analyses, three items exhibited very low factor loadings: two from the intrapersonal scale (Items 12 and 26) and one from the interpersonal scale (Item 4), which were removed for the short form. Similar results were found by previous studies (Davis & Wigelsworth, 2017; Said et al., 2013). The convergent validity at item level and the interfactorial correlations between the four-first order scales confirmed Bar-On and Parker’s theoretical model (2000). However, the results indicated that stress management is an orthogonal scale. This finding mirrors other work suggesting low or non-significant correlations between stress management subscale and the other subscales (Davis & Wigelsworth, 2017; Esnaola et al., 2017; Kun et al., 2012).
In this study, reliability coefficients obtained were higher for the four subscales of EQ-i: YV[S] than reported by Ugarriza and Pajares-Del-Águila (2005), but lower than other previous studies (Esnaola et al., 2016, 2017; Esnaola et al., 2018; Gilar-Corbi et al., 2021; Kun et al., 2012). The reliability estimates were acceptable for the stress management and adaptability subscales but low for the intrapersonal and interpersonal subscales (ω < .65). Consistent with studies reviewed, the interpersonal subscale obtained the lowest reliability. According to this finding, we suggest using the short version of EQ-i: YV as a screening tool for Colombian children and adolescents at risk for socioemotional concerns and delays. In other words, it should not be considered a clinical diagnostic test (Smith et al., 2000) and should be used in conjunction with other tests (Merino et al., 2014).
Our analyses also demonstrated the association between the EQ-i: YV[S] and young people’s coping strategies. The theoretical and empirical links between emotional intelligence and coping have been previously established (Davis & Humphrey, 2012; Keefer et al., 2013; Resurrección & Salguero, 2014). The current findings extend this basis by indicating that the EQ-i: YV[S] may be useful not only for assessing children’s abilities to express themselves and their emotions and understand others’ feelings and perspectives, but also be connected to the efficacy of the ways they manage challenges and stress. Further work is needed to confirm this predictive inference of the EQ-i: YV[S], but this finding could have important implications for clinicians and educators as they work to support children’s resilience and holistic development.
One limitation of our analyses was that we did not include 7-year-old children because they had difficulties understanding instructions and items as their reading skills are not as fully developed as older children. Therefore, we suggest adapting and validating a version of the questionnaire for this age group. Additionally, we did not investigate connections between children’s EI and other contextual factors and challenges. To this end, future research on the EQ-i: YV[S] should investigate relationships with personality, suicidal ideation, coping strategies, and sociocultural variables, as has been done with other measures of EI (Goldenberg et al., 2006). With these increased understandings, and as part of a battery of assessments, the EQ-i: YV[S] has potential to inform the work of educators and psychologists as they strive to support socioemotional development in children across the globe.
5. Conclusion
EI has become a primary focus of research and education with younger children. This study demonstrates limitations and possible areas for development related to the use of retrospective self-reports with a mixed approach to EI. While building on other work across various cultural contexts, we have tested the validity of the EQ-i: YV[S] structure with Colombian children and its reliability limitations. As our findings connect with other research with the instrument, it can help provide a foundation for better understandings of EI across cultures and development of cross-cultural interventions to support EI in children. Further cross-cultural research is still needed, however, to increase the reliability and validity evidence of the EQ-i: YV[S]. Based on our findings, we recommend further research with clinical and community samples to examine the predictive power of the questionnaire for educational or clinical evaluations.
Overall, the current study supports the factorial structure of the EQ-i: YV[S], confirming Bar-On and Parker’s theoretical model (2000). Given that two subscales obtained low reliability, we recommend using the scale as a screening tool for Colombian children in urban areas. The EQ-i: YV[S] could be used to identify school-age children and young people who may not have developed productive or effective coping responses that put them at risk of mental health and behavioral concerns (Evans & Kim, 2013). While further assessment and support of these children would be needed, the ease and brevity of EQ-i: YV[S] provides a critical first step for identifying children with low socio-emotional indices before being referred to a full assessment.

