


Services on Demand
Journal
Article
 English (pdf)
 Article in xml format
 Article references
 Send this article by e-mail
Indicators
-
 Cited by SciELO
 -
 Access statistics
Related links
-
 Cited by Google
 -
 Similars in
SciELO
Similars in
SciELO -
 Similars in Google
Share

 Permalink
Revista de Economía del Caribe
Print version ISSN 2011-2106
rev. econ. Caribe no.16 Barranquilla July/Dec. 2015
Voting for the environment: the importance of Democracy and education in Latin America*
Votando por el ambiente: La importancia de la democracia y educación en América Latina
Danny García Callejas**
* This paper is derived from the research project titled "Social Development and Natural Resources: Transmission Channels and Disparities in Colombia", financed by the Universidad de Antioquia (Colombia) with the support from the Departamento de Economía and Comité para el Desarrollo de la Investigación (Codi) de la Universidad de Antioquia, and is a by-product of my paper "Corruption, Economic Freedom and Political Freedom in South America" presented at the 2014 Midwest Political Science Association (MPSA) Conference at the Palmer House Hilton in Chicago on April 3-6, 2014. I acknowledge financial support from the Facultad de Ciencias Económicas and Fondo Patrimonial para el Desarrollo de la Docencia de la Vicerrectoría de Docencia de la Universidad de Antioquia.
The author would like to thank the editor and anonymous referees for their comments and suggestions on previous versions of this paper. I am also grateful to colleague and Professor Catalina Granda Carvajal and assistants at the SER Seminar at the Department of Economics at the Universidad de Antioquia (Medellín) for their feedback and opinions. As usual, all mistakes and errors are mine.
** Ph.D. in Public Policy, University of Massachusetts. Professor, Economics Department and member of the Grupo de Macroeconomía Aplicada, Universidad de Antioquia (Colombia). Address: Departamento de Economía, Facultad de Ciencias Económicas, Calle 67 No. 53-108, Bloque 13, Oficina 409, Ciudad Universitaria, Medellín, Antioquia 050010, Colombia, South America. Phone: +011 (574) 219 5800 and +011574) 219 5820. Fax: +011 (574) 233 1249.
E-mail: danny.garcia@udea.edu.co.
Fecha de recepción: mayo de 2015
Fecha de aceptación: septiembre de 2015
ABSTRACT
Abstract: This study found that doubling the level of democracy in Latin America reduces CO2 emissions per capita by up to 6%. This relationship is estimated by using a fixed effects panel system of equations for 19 Latin American countries, between 1995 and 2008. Democracy acts as a conduit for increasing demands on environmental quality in Latin America, due to urban population growth and economic prosperity. Nevertheless, this study has, at least, two caveats: first it cannot unveil the long run relationship between democracy and environmental quality in the region; and, secondly, this study assumes that democracy entails positive outcomes for countries adopting this political system.
Keyword: Democracy, Environmental Quality, CO2 Emissions per Capita, Latin America, Panel System of Equations.
JEL Codes: C33, N46, Q53, Q56.
RESUMEN
Este estudio encontró que duplicar el nivel de democracia en América Latina reduce las emisiones de CO2 per cápita hasta en 6%. Esta relación se calcula mediante el uso de un sistema de ecuaciones de panel con efectos fijos. La muestra incluye 19 países de América Latina, entre 1995 y 2008. Este estudio concluye que la democracia actúa como un conducto para la creciente demanda de calidad del medio ambiente en América Latina, generada por el aumento de la población urbana y prosperidad económica en la región. Sin embargo, esta investigación tiene, al menos, dos salvedades: en primer lugar, es ambigua sobre la relación de largo plazo entre democracia y calidad ambiental en la región; y, en segundo lugar, asume que la democracia trae beneficios positivos para los países que adoptan este sistema político.
Keyword: Democracia, Calidad ambiental, Emisiones de CO2 per cápita, América Latina, Sistema de ecuaciones para datos de panel.
JEL Codes: C33, N46, Q53, Q56.
1. INTRODUCCIÓN
This study claims that democracy has a positive effect on environmental quality in Latin America, although previous papers find a positive (Farzin and Bond, 2006; Fredriksson and Wollscheid, 2007), ambiguous (Buitenzorgy and Mol, 2011; You et al., 2015) or negative relationship (Midlarsky, 1998; Halkos and Tzeremes, 2013) between democracy and environmental quality.
Democracy acts as a conduit allowing social demands to be set as priorities by policymakers. Since more democracy implies more political accountability, political activism, freedom of speech, freedom of press, and fosters social movements then environmental concerns may be incorporated in the political agenda. In fact, democracy guarantees that raising awareness is possible, hence influencing public opinion and electoral outcomes.
Although democracy is not the cure of all evils for Latin America, it does vindicate political participation and protest as legitimate ways of influencing public policies, encouraging lower levels of corruption, higher commitment to social demands and more equality. Thus, democracy promotes political participation and accountability, channeling environmental awareness toward action among citizens and policymakers.
Hence, Latin America, with an increasing urban population facing new issues besides global warming, would pressure for improvements in environmental quality. Public awareness should imply a higher demand for a cleaner environment and democracy would serve as the conduit for influencing the policy agenda.
In order to test the democracy-environmental quality relationship, this paper will estimate a panel data system of equations for 19 Latin American countries, for the period 1995-2008. This paper fills three gaps in the literature. First, no previous study has focused on Latin America. Second, this paper acknowledges the non-linear and indirect nature of democracy-via economic development. Third, this study provides policymakers with direct and indirect estimates of democracy on environmental quality and alternative conduits that may encourage it throughout the region.
Finally, this paper is divided as follows. Section I comments on the previous literature on the topic. Section II lays out the conceptual framework, a model of political activism, the research question and hypotheses. Section III provides the results and tests the theory. Section IV depicts some of the limitations of this study. Lastly, some conclusions are presented.
2. PREVIOUS FINDINGS
The relationship between democracy and the environment has been studied for quite some time. Yet the link between them is dubious. In fact Midlarsky (1998) argues that the relationship between democracy and the environment is multidimensional. Midlarsky (1998) finds a negative relationship between democracy and carbon dioxide emissions, soil erosion by water and deforestation. Didia (1997) also finds a negative association between democracy and tropical deforestation. However, Li and Reuveny (2006) find that the effect of democracy on environmental quality varies across the different types of environmental degradation.
Although Midlarsky (1998) finds, in most cases, an unexpected and inverse relationship between environmental quality and democracy, after controlling for other factors, his study accounts for cross-sectional data. Additional factors could be controlled for in a panel data approach. For example, Carlsson and Lundström (2000) show that government size and pro-market policies affect the impact that democracy has on environmental quality. These authors find that a large government size reduces and may eliminate the impact of democracy on reducing CO2 emissions, consistent with Bernauer and Koubi (2013). Nevertheless, Carlsson and Lundström (2000, p. 2) acknowledge that economic freedom and political freedom have a relationship with GDP growth and GDP per capita, casting doubt on their estimates due to possible endogeneity.
In contrast, Neumayer (2002) finds that the more democratic a country is, the more multilateral agreements favoring the environment it signs. Yet there may be other driving factors in the author's findings. For instance, Das and Dirienzo (2010) suggest that countries with moderate ethnic diversity are societies with more civil engagement and are more democratic. Ethnically homogenous countries exhibit higher environmental standards.
Farzin and Bond (2006) argue that income inequality, age distribution, education, and urbanization all affect the democracyenvironmental quality relationship and may reduce the importance of democracy as a conduit for reducing pollution levels, and education may have an ambiguous effect on environmental quality (Mayer, 2013).
Pellegrini and Gerlagh (2006) show that by including corruption into the analysis, the effects of democracy disappear. Their main conclusion is that countries with a democratic tradition are also less corrupt and thus prone to uphold environmental regulations. In contrast, Duit et al. (2009) are skeptic of the positive impacts of democracy on biodiversity. In fact, these authors conclude that none of the previously mentioned variables are as important as landscape transformations.
In a more traditional angle that takes advantage of an Environmental Kuznets Curve approach, Gallagher and Thacker (2008) find a negative yet long run relationship between the "stock" of democracy and sulfur and carbon dioxide emissions. However, this study omits corruption in their analysis. Yet, Aklin et al. (2014) claim that corruption matters since its effects on environmental quality may be significant and are perceived differently varying with income and wealth levels of citizens.
Grafton and Knowles (2004), on the other hand, analyze the importance of social capital on environmental quality. The authors conclude that social capital can be a bad thing for the environment. Moreover, if social capital encourages population density, then it might even have a negative effect on environmental quality, since the authors find a positive association between population density and environmental degradation.
In contrast, Winslow (2005) suggests that democracy has a positive effect on reducing pollution (sulfur dioxide (SO2), suspended particulate matter (SPM) and smoke) in urban areas-where population density may be the highest.
Zavestoski et al. (2006) explain that democracy affects environmental policies through the internet. The internet increases awareness of governmental policies, regulations and plans while providing an effective and cheap channel for exchanging ideas and grouping citizens that share similar values and facilitating citizens' engagement in environmental issues. This political and social activism is feasible in democratic societies putting pressures on policymakers (Martinez et al., 2008). In turn, policymakers accommodate or modify laws and regulations to satisfy public demands-giving civil liberties an important role in explaining the democracy-environmental quality relationship (Bernauer and Koubi, 2004; Bernard et al., 2014), leading to higher environmental standards (Fredriksson et al., 2005).
Finally, the relationship between democracy and environmental quality might depend on the sample of countries included in the empirical analysis and the amount of accumulated democracy (Fredriksson and Neumayer, 2013). Arvin and Lew (2009), use a sample of developing countries in the period 1976-2003. The authors conclude that their results are dependent on the indicator of environmental quality they use and on the sub-sample they select. Their estimates are inconsistent across subsamples of developing countries, concluding that a democracy-environmental quality relationship may be spurious (Walker, 1999).
3. DEMOCRACY AND ENVIRONMENTAL QUALITY: THE THEORY
3.1. The Conceptual Framework
The relationship between democracy and environmental quality is ambiguous. Midlarsky (1998) argues that democracies may be ineffective in increasing environmental quality if interest groups favoring less environmental regulation have an important role. In other words, lobbyists-and elites-advocating for low or limited environmental regulations may influence policymaking more than other societal actors.
Setting aside the compelling arguments against the positive relationship between democracy and environmental quality, this paper is focused on the positive outcomes (Schultz and Crockett, 1990; Congleton, 1992; and Payne 1995).
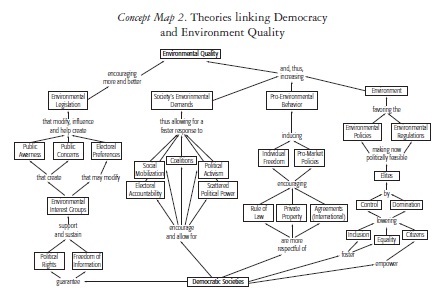
The argument of a positive relationship between democracy and environmental quality may be depicted as follows. More democracy implies more freedom of press, freedom of speech, human rights, equality and social justice. This creates a conduit conveying social needs through political participation. Democratic countries also allow for an easier exchange of information amongst its citizens raising public awareness and influencing public opinion. As their income and quality of life increases, societies demand more environmental quality shaping policy agendas. Consequently, regulations, international agreements and local policies are created to fulfill these needs, encouraging a higher environmental quality (Concept map 1).

There are four additional and independent channels that positively link democracy and environmental quality. First, democracy guarantees and encourages political rights and freedom of information for all individuals alike. This permits protests, social movements, opposition and raising awareness, fostering the creation of all types of interest groups, including those that favor the environment. These groups raise public concerns about environmental issues, encouraging political parties to be formed or inducing politicians to include these topics in their political agendas to satisfy electoral preferences. Governments would adopt these demands through policies intended to protect the environment.
Second, democracy empowers all citizens by facilitating political activism, social mobilizations and debates about society's problems. This induces the formation of political coalitions incorporating citizen's preferences about the environment. Perhaps, most importantly, democracy encourages accountability, persuading policymakers to fulfill the requests of a cleaner environment.
Third, democratic societies are more respectful of rule of law, private property and international agreements. As pollution increases and affects private property through externalities, governments intervene. Similarly, as partner countries advance having a higher preference for the environment, the home countries is compelled to sign equivalent treaties. Because of private property, governments implement pro-market and pro-government policies promoting an environmental sustainable behavior.
Finally, democracy implies social inclusion and economic equality. Empowered citizens would require government to punish polluters favoring a cleaner environment (Concept map 2).
3.2. Research Question and hypotheses
The relationship between democracy and the environment in Latin America is ignored. This question is not serendipitous for at least three reasons. Firstly, the diversity of levels of GDP per capita and democracy in Latin America makes it an appealing case for exploring additional theoretical underpinnings. Secondly, the availability of natural resources and biodiversity in Latin America may prove a paradoxical case where environmental quality may be low due to scarce political participation and not limited resources. Thirdly, the diverse levels of income inequality in the region suggest also political inequalities, limiting environmental justice. Thus, this paper will answer the following research question: What is the impact of democracy on environmental quality in Latin America?
Additionally, the theory (§ II) encourages exploring three hypotheses:
H1: An increase in democracy improves environmental quality, in countries with low levels of education.
H2: Higher levels of education increase environmental quality, in countries with low levels of democracy.
H3: An increase in GDP per capita reduces environmental quality.
3.3. A model of Pollution and Political activism
This section develops a model in which there are two groups of active constituents: one promoting environmental pollution (polluters); and environmentalists pursuing a cleaner environment. Imagine right-wing and left-wing activists, being the former more prone to polluting policies when in power (Garmann, 2014).
Each period there is a share of the population politically active. Among the politically engaged citizens, there is a fraction P of individuals in favor of pollution and a percentage NP of citizens against contamination.
The government establishes anti-pollution laws and legislation, yet it is influenced by polluters and environmentalists alike. But, when citizens consider that official decisions are against society's best interest, then the ruling party may be removed from office. In this case, β is the probability that the government will stay in power after accepting a high level of pollution.
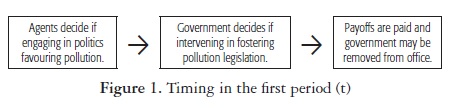
First, agents must decide if they engage in politics promoting high or low levels of pollution. Second, the government must decide if it intervenes in favour or against environmental legislation. Third, after all agents have decided on their actions and acted, payoffs are paid and government may continue or be removed from office (Figure 1).
Hence, the expected utilities of economic agents gaining from high pollution and low pollution are:
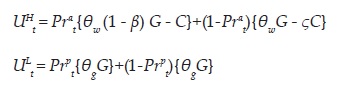
Prat is the probability that the government in power will accept a high level of pollution; Prpt is the probability that the government in power will seek legislation- if there is none-for a high level of pollution. θ w is the probability of the pollution project being accepted without government interference, and θ g the probability of the project being approved given government intervention. G is the benefit for society of the approved polluting project and C its cost. ς is the percentage of loss on government intervention if the project is rejected. β is the probability that the government will stay in power after accepting a high level of pollution.
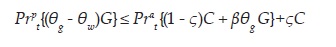
Government will not intervene if the utility for agents from a highpolluted environment is less than from a low polluted environment.
In period t, if there is a high level of pollution, the gain for economic agents with government seeking to reduce contamination or promoting a high level of pollution are the following:
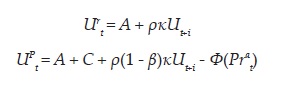
Where A is government popularity; ρ is a discount factor; Ut+1 is the future gain for the economy as a consequence of the level of pollution; Φ(Prat) is the cost of promoting a high level of pollution that is decreasing in the probability that the government in power will accept a high level of pollution (Prat); and κ is the proportion of politically active individuals in society and depends positively of the level of democracy and education (so κ = f (Education and Democracy)).
Economic agents will abstain from promoting a high level of pollution (legislation) if URt > UPt, or equivalently:
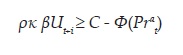
In period t, if there is a low level of pollution, the gain for economic agents with government seeking to maintain low contamination or promoting an increase in the level of pollution are the following:
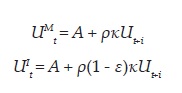
Where ε is the probability that government will continue in office after promoting an increase in the level of pollution, assuming contamination is low.
If UMt > UIt, meaning that ε ≠ 0, then government will always seek a low level of pollution, if there is a chance of being removed from office if doing otherwise (e.g. creation of the Environmental Protection Agency, EPA, by Nixon in 1970). The idea is that governments are unwilling to lose power by committing political suicide.
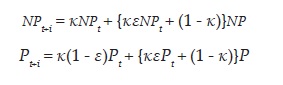
Suppose there are two fractions of the population: polluters (P) who are citizens politically active that favour pollution; and, nonpolluters (NP) that are politically engaged environmentalists. Then we have that {P, NP} would represent the state of the economy in period t. Yet in period t+1, the state of the economy will depend on the actions of these individuals in the previous period.
Case 1. Suppose that economic agents are not promoting legislation favouring pollution (high level of pollution) by lobbying government in period t.
Case 2. Suppose that economic agents are promoting legislation favouring pollution (low level of pollution) by lobbying government in period t and government supports such efforts.
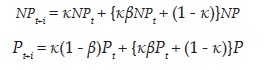
In contrast to Case 1, epsilon is now replaced by beta. What is the steady state for the symmetric equilibrium? In this case I will present the solution for the second case, agents promoting a higher level of pollution for the economy. Thus,
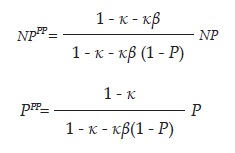
And the gain for economic agents with a government seeking an increase in the level of pollution is the following:
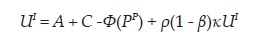
Meaning that,
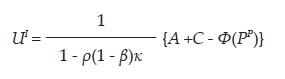
Yet κ is directly related to education and democracy thus implying that a higher level of both factors should lead to less pollution. Although if A, the level of popularity, is directly related to GDP per capita, a first testable equation would imply:
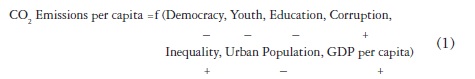
Pollution = f(Democracy, Education, GDP per capita)
- - +
3.4. Conceptual Elements for Testing the Theory
The previous framework suggests a positive relationship between environmental quality and democracy, emphasizing on the role of social movements, freedom of information, political participation and economic development.
Environmental quality is a concept encompassing many aspects. This creates a first hurdle for determining the dependent variable of interest. A first possibility is using the Environmental Performance Index developed by the Yale Center for Environmental Law and Policy. However, using this index would limit the sample size and accuracy of the analysis. The data is plagued with missing data for the period of analysis, 1995-2008, and for a large group of Latin American countries.
An attractive alternative is using CO2 Emissions per capita as a proxy for environmental quality. This variable poses several advantages. First, with the world's awareness on climate change, it has become a primary target and concern for the public. Second, it is more perceptible in urban areas than other pollutants because car and buses are primary emitters. Third, carbon dioxide is linked to respiratory illnesses that reduce quality of life, raising concerns from the public. Fourth, transportation is a major concern in Developing Countries with a close connection to carbon emissions, an indicator for citizens of the overall environmental quality in urban areas.
Furthermore, data on carbon dioxide emissions should be relatively accurate given the importance of the issue on a worldwide scale and the availability of different sources. However, using CO2 emissions has its caveats. First, emissions are concentrated in urban areas, excluding policies and environmental programs targeted for rural areas. This is troublesome because Latin America depends heavily on its mining sector. Yet, environmental quality in urban areas should be positively correlated with those in rural areas. Second, urban citizens are influenced by media and world media regarding the environment. This may skew their perceptions on the true impacts of emissions and on their perceived level of environmental quality.
On the independent side of the equation, the theory suggests social movements as a first element. Social movements catalyze citizens' demands regarding environmental concerns. These movements are pivotal in reshaping state policies and influencing voting preferences. However, data on social movements is difficult to acquire in a panel data context for Latin America. Thus a proxy is in order. Youth has a pivotal role in shaping society (Youniss et al. 2002). Younger individuals are more risk-taking (France, 2000) and thus more inclined to civic engagement and political participation; younger and more educated individuals are more prone to environmental social movements than other groups of the population (Strandbu and Krange, 2003); and teenagers are highly interested in issues related to the environment (Hager, et al. 2007). Therefore, it is reasonable to proxy social movements with a percentage of youth in the population.
Education also plays a crucial role in fostering social movements and raising awareness. Rather than youth being the sole proxy for social movements, education should be included as a factor promoting efficacy and advocacy. Yet education is an abstract concept. What level of education or should all levels of instruction be included? Tertiary education is the most effective in encouraging civic engagement and political participation (Hoskins et al., 2008; World Bank, 2002, p. 32). Therefore, it seems reasonable to proxy education with tertiary education.
As also mentioned in the theory, the level of political activism is not only influenced by education and social movements but by the percentage of the population located in urban areas. Urban areas enable networking and social relations that also encourage gatherings and social mobilizations. Indeed, a high concentration of population in one area facilitates social discussion. Thus, the percentage of urban population is included as one of the factors that may explain environmental quality. Also, higher concentrations of population may improve economic and environmental efficiency in the provision of goods and services, leading to lower levels of emissions. Hence, a negative relationship is expected between the percentage of urban population and environmental quality.
Another factor to consider from the theory is economic development. Societies with higher levels of economic development are associated with less economic inequality-although not linearly-(Kuznets, 1955), and more available resources in society that may finance programs intended to improve the environment (Shafik, 1994, p. 758). This should facilitate political participation, leading to higher levels of environmental quality. How to measure economic development? This study adopts GDP per capita as a proxy for economic development. Although not a perfect measure, it is a reliable indicator, easier to explain by other components and assess indirect impacts.
The theory also suggests that corruption affects the level of environmental quality by reducing the effectiveness of democracy. Corruption enables interest groups to influence the political agenda in an unfairly manner. Besides, it provides corporations, institutions and individuals an alternative for breaking the law, perhaps without getting caught. This maintains or increases pollution even if the current legislation requires a reduction.
Although corruption may highlight the disparities of power and income in society, inequality serves as a better factor in measuring those disparities. Unequal societies enable power disparities to grow in the political arena. Privileged groups accommodate policies in their favor hurting the powerless. This derives in a political agenda prioritizing the interests of those with power. For example, polluting plants and factories could be located close to workers in low-income communities. Since environmental justice would prove ineffective in this case, then low environmental quality arises.
In summary, the independent variables explaining environmental quality are: democracy, economic development, social movements and political participation (including freedom of information and of press). However, these concepts are proxied through variables available and measured for Latin America. The proxies are: a democracy index, percentage of youth, gross percentage of the population in tertiary education, perceived corruption, level of inequality, percentage of urban population and GDP per capita. The primary equation to estimate and its expected signs are:
However, this equation overlooks the indirect effects that spur from Democracy through GDP per capita (Goldsmith, 1995; Barro, 1996; Sala-i-Martin, 1997; Feng, 1997; Rivera-Batiz, 2002). However, the GDP per capita democracy relationship would be inaccurate if only democracy is included in the equation. Thus, including growth components suggested by the neoclassical theory of growth (Solow, 1956; Becker et al., 1990; Grossman and Helpman, 1990; Barro, 1991) would point to a second equation as follows:

In conclusion, a comprehensive analysis of the effects of democracy on environmental quality should at least include the indirect effect from economic growth. Furthermore, democracy should also affect the level of environmental quality through the economic growth equation. This indirect effect should be considered if one does not want to overestimate the effect of democracy on environmental quality.
4. DEMOCRACY AND ENVIRONMENTAL QUALITY: THE EMPIRICAL RELATIONSHIP
4.1. The Data
The source for CO2 data is CDIAC (2015) and World Bank (2015). The variables youth and education were taken from the World Bank (2015) and the Economic Commission for Latin America and the Caribbean -ECLAC- (2015). The variable youth is the percentage of people between ages 15 and 24 for a specific year and country. Education is the tertiary gross school enrolment rate.
The variable democracy is taken from the Polity IV database (Marshall and Jaggers, 2015), that defines democracy as a form of government that "relies mainly on the use of 'positive sanctions/ incentives' (i.e., legitimate authority) to manage the political agenda and to ensure social order" (Marshall and Jaggers, 2015). This variable ranges originally from -10 to +10, where +10 indicates the highest level of democracy and -10 a hereditary monarchy. However, this index for democracy takes only positive values for the Latin American countries in the sample for the period 1995-2008.
As an indicator of economic progress, this study uses GDP per capita. This variable is taken from World Bank (2015) and ECLAC (2015). The base year for this variable is 2000 and it is measured in U.S. dollars. Similarly, capital is the amount of fixed capital in the economy and is also measured in 2000 year dollars, and taken from ECLAC (2015). Despite the criticism of using this variable, including investment rather than capital is not free of drawbacks as well. Trade is the level of trade openness in the economy or imports plus exports by GDP, and its source is also World Bank (2015) and ECLAC (2015).
The data on corruption is taken from Transparency International (2015). This index or the corruption perception index is measured in a 0 to 10 scale where a higher value represents a lower level of corruption or more transparency. Transparency International defines corruption as "the abuse of entrusted power for private gain." Yet the level of disparities and asymmetries of power are captured through income inequality. The data is taken from the United Nations University-World Institute for Development Economics Research, UNU-WIDER (2014), data base on income inequality.
However, the possibility of social movements, provision of public services and political participation are more effective in urban areas. This paper uses the percentage of urban population taken from World Bank (2015) and ECLAC (2015) to measure the percentage of people living in urban areas.
All variables are available for the 19 Latin American countries in the data set and for the period 1995-2008. The following are the countries included in this study: Argentina, Bolivia, Brazil, Costa Rica, Chile, Colombia, Dominican Republic, Ecuador, El Salvador, Guatemala, Honduras, Jamaica, Mexico, Nicaragua, Panama, Paraguay, Peru, Uruguay and Venezuela. Only for the case of Jamaica, data on capital was imputed using historical data on capital and balance of payments. Imputed data was compared to actual data for the other countries in the region and, in general, both sets were correlated and without significant statistical difference. Furthermore, all estimations were consistent and robust to eliminating Jamaica from the data set.
4.2. Data Reliability and sample selection
This study intends to include as many Latin American countries as possible. Yet data is only complete and available for 19 countries in the region. This sample is representative of Latin America considering it embodies 94% of the population, 98% of GDP and 94% of CO2 emissions for the entire region, according to ECLAC statistics. These three indicators are directly connected to the issue at hand in this paper.
The 1995-2008 time frame for this sample of countries is particularly adequate. First, data is complete, available and statistically sound for the selected sample of countries. This is expressly important for the data on pollution-emissions-, inequality and democracy. Since these three indicators are tricky to measure, their estimates tend to change over time, due to improvements in their measurement methodology. The data, for this period, has been validated and forgoes any future changes, making it reliable and accurate.
Second, this period of time presents sufficient variability in democratic, environmental and economic indicators in order to perform the suggested econometric estimations in this study. Since data for previous years is inexistent for several variables, and later values are tainted by less variability and reliability, this time frame turns out to be adequate. Capital estimates are troublesome but reliable for the selected time period.
Third, the 2008 economic crisis created recessions in 9 out of the 19 countries in the sample. However, only 4 suffered from a contraction in the second or third quarter of 2008. This is particularly important because changes in political preferences, social demands and social unrest began late in 2008 in a minority of countries, and especially ignited in 2009. The relative stability of the previous period minimizes the risk of economic turmoil affecting political preferences.
In consequence, these three reasons justify using the data available for the 1995-2008 time window. By capturing consistent estimates, minimizing any possible volatile structural changes, having reliable estimates of economic, environmental and democratic indicators, and sufficient data for a representative sample of the region, the empirical exercise of this study reduces doubts on its results.
4.3. Estimation strategy
Latin America is an interesting case to analyze because of its unique characteristics in terms of democracy and economic development. Data is available for a variety of countries and several years enabling a panel data approach.
The use of panel data increases degrees of freedom combining crosssection and time series data simultaneously. The fixed effects approach allows controlling for unobservable confounding factors that may otherwise skew and invalidate the estimates and statistical inference.
The system of equations to be estimated has as dependent variables the logarithm of CO2 Emissions per capita and the logarithm of GDP per capita. The following is the system to be estimated:
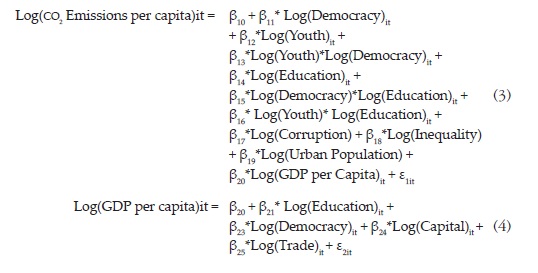
Nevertheless, equation 3 is estimated first and separately in order to confirm the robust nature of the estimates. This study acknowledges that estimating only equation 3 would provide an incomplete assessment and overestimating the effect of the independent variables on environmental quality (CO2 Emissions per capita). Since democracy influences the level of GDP per capita and through it the level of environmental quality, any estimation should control for that effect if estimates are to be accurate.
Notice that education is proxied with tertiary education. Tertiary education is the most effective level of academic formation in encouraging civic engagement and political participation (Hoskins et al., 2008; World Bank, 2002, p. 32). However, the extent to which civic and political engagement affects policy is magnified by the participation of youth, thus an interaction term for education and youth is included. Similarly, the level of democracy limits the possibility of civic engagement to influence policy and environmental regulations. Moreover, education may foster civic engagement, but this is only possible if it is democratically feasible. In other words, higher levels of education in a dictatorship restrict the possibilities for civic engagement. Consequently, this requires for interaction terms between democracy, youth and education.
In this case, Ordinary Least Squares (OLS) may prove an inefficient estimation method. Notice that equations 3 and 4 are affected by exogenous shocks that have incidence on the value of all variables. Specifically, the Mexican peso crisis that began in December of 1994 affected commerce throughout the region; the 1997 Asian Financial Crisis and the 1998 Russian Financial Crisis that ignited the 1998 Brazilian Financial Crisis altered the financial stability of Latin Ame-rica. These exogenous effects act in each equation through the error terms suggesting that both equations are related. Thus, the most efficient strategy is estimating this system of equations by Seeming Unrelated Regression (Zellner, 1962 and 1963). This method will provide consistent estimates with more accuracy than OLS.
4.4. Findings and Estimates
Table 1 provides the estimates for a one-equation panel data model. The dependent variable is CO2 Emissions per capita-proxy for environmental quality. All estimates are significant-for models 1 through 3-suggesting a negative relationship between democracy, youth and education, evaluated at sample means-due to interaction effects; a consistent result with this study's conceptual framework. Also, GDP per capita has a positive relationship with emissions, as expected (§ II). In contrast, corruption, inequality and urban population are insignificant.
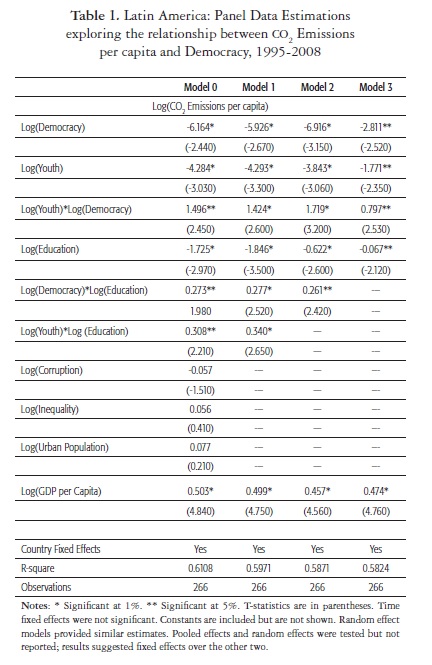
The estimates from model 1 in Table 1 imply that democracy, education and youth matter in determining the impact of these variables on environmental quality, providing evidence for H1 and H2. This means that increasing democracy as a way of improving environmental quality is ineffective in countries with high levels of education (evidence in favor of H1). Hence, education provides an alternative conduit for channeling environmental demands of the population and improving environmental quality.
Similarly, the results also suggest that democracy may prove ineffective in reducing emissions in countries with a high percentage of youth. Indeed, youth are also a natural alternative for increasing environmental quality. In part, this is because youth tend to participate more of social movements than any other age group. Also, a higher percentage of youth ignites altruistic behaviors among older age groups of the population indented to protect the environment for future generations.
Also, GDP per capita is positive and significant, suggesting that more development leads to less environmental quality (evidence in favor of H3). Although the Kuznets hypothesis suggests that this relationship is non-linear and, after a threshold, higher levels of development imply more environmental quality, this first set of estimations reject this notion.
In order to estimate the indirect effects of democracy on environmental quality through GDP per capita, Table 2 uses a panel data system of equations. Thus, Table 2 has two equations with the following dependent variables: CO2 Emissions per capita and GDP per capita. In Table 2 all estimates are significant at a 5% level and have the expected signs.
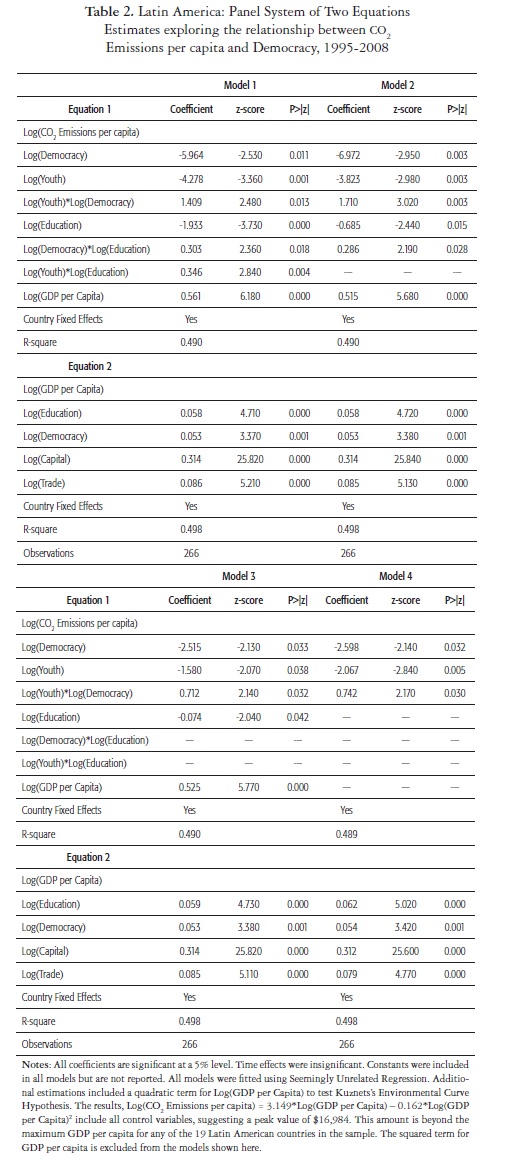
The results in Table 2 are consistent with those in Table 1. However, the indirect effect of democracy is now contemplated in the estimation. GDP per capita has a positive and linear relationship favoring H3. A squared term for GDP per capita was included but it suggested a peak value of $16,984, ignoring that the highest GDP per capita in the data set is $9,917. The squared term for GDP per capita was excluded from all estimations.
The direct and indirect effects of democracy and education on environmental quality-negatively correlated to CO2 Emissions per Capita-from Table 2 are summarized in Table 3.
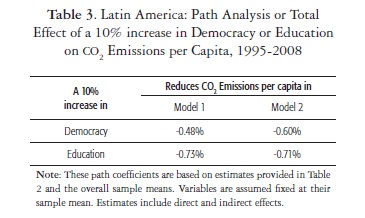
Table 3 suggests that at sample mean values, a 10% increase in democracy and education reduces CO2 Emissions per Capita up to 0.60% and 0.73%, respectively, implying a positive relationship between democracy, education and environmental quality. However, as suggested in Tables 1 and 2, these effects are conditioned by the level of education or democracy (evidence in favor of H1 and H2). In other words, countries with high levels of education may find that democracy has a negligible effect in reducing environmental quality. Similarly, countries with high levels of democracy may find that increasing education does not necessarily increase environmental quality. This emphasizes the fact that public policies targeted to improve environmental quality cannot be replaced by simply increasing the levels of education or democracy.
5. LIMITATIONS OF THIS STUDY
This paper uses CO2 emissions as and indicator of environmental quality; however this requires several words of caution. First, several studies have shown that results may vary by environmental indicator. Thus, the evidence presented in this paper is only suggestive of the impact of democracy and other factors on CO2 emissions and not environmental quality. Furthermore, environmental quality encompasses much more than CO2 emissions. These estimates should be interpreted with caution when addressing environmental quality directly. Second, the coefficients may be driven by recent concerns about climate change that indicate CO2 as its main cause. Consequently, policies in the period 1995-2008 may have targeted mostly CO2 emissions, overestimating the benefits.
Also, results should be interpreted with caution because such a short period (1995-2008) does not capture the long-term relation ship between democracy and environmental quality. Furthermore, I have omitted important variables such as political participation, social movements, environmental agreements and regulations. This should not alter the results substantially because of the fixed effects approach; however, this method impedes determining the empirical importance of these variables, already highlighted in the literature.
Finally, this paper has taken a positive view of the impact of democracy on environmental quality, a controversial stand. In fact, the literature provides compelling arguments regarding the possible detrimental effects of democracy on society-the tyranny of the majority. This may be consistent with a narrow definition of democracy (decisions based on a majority rule), but democracy nonetheless.
6. CONCLUSIONS
Democracy has a positive effect on environmental quality. The theory suggests that democracy sustains and encourages freedom of speech, freedom of press, political participation and social awareness. These elements provide a conduit for social demands. As the urban population and income grow, citizens increase their demands for higher environmental standards and quality. The enactment of new policies and regulations that incentive individuals and firms lead to a reduction in pollution; therefore, leading to a higher level of environmental quality.
In fact, democratic societies are prone to have a higher rule of law. Thus, social demands for a cleaner environment transform into bills and laws that are applied effectively. If demands are unmet, governments may be removed from office by using its system of checks and balances and public accountability. The theoretical model in this paper argues that citizens will be empowered to change the law and remove politicians from government the higher their levels of education, wealth and political engagement.
Moreover, societies with a higher percentage of youth, urban population and a lesser level of inequality and corruption, encourage pro-environmental behavior, civic engagement and political participation. Specifically, this study explores three hypotheses: An increase in democracy improves environmental quality, in countries with low levels of education; higher levels of education increase environmental quality, in nations with low levels of democracy; and, an increase in GDP per capita reduces environmental quality.
In order to verify these hypotheses, this study uses data for 19 Latin American countries from 1995 and 2008, in a panel data multiple equations approach. In doing so, this study controls from any feedback effects between economic prosperity and environmental quality. And the selected time frame and sample provide indicators and variables with sufficient reliability, accuracy, variability and stability to obtain robust inferences and conclusions. Thus, all three hypotheses are confirmed through conclusive and robust statistical evidence.
Furthermore, this study suggests that a 10% increase in democracy reduces CO2 emissions per capita in 0.48% or 0.60%. Similarly, a 10% increase in education decreases emissions in 0.71% or 0.73%. These results advocate that democracy and education have a positive effect on environmental quality, acting as substitutes. Although multiple factors promote clean habitats, voting for the environment by promoting more education and democracy seems a promising starting point.
REFERENCES
Aklin, M.; Bayer, P.; Harish, S.P. & Urpelainen, J. (2014). Who blames corruption for the poor enforcement of environmental laws? Survey evidence from Brazil. Environmental Economics and Policy Studies, 16 (3), pp. 241-262. [ Links ]
Barro, Robert J. (1991), Economic Growth in a Cross Section of Countries. Quarterly Journal of Economics, 106 (2), pp. 407-443. [ Links ]
Barro, Robert J. (1996), Democracy and Growth. Journal of Economic Growth, 1 (1), pp. 1-27. [ Links ]
Becker, G. S.; Murphy, K.M. & Tamura, R.F. (1990), Human capital, fertility, and economic growth. Journal of Political Economy, 98 (5), pp. S12-S37. [ Links ]
Bernard, S.; Hotte, L. & Winer, S.L. (2014), Democracy, inequality and the environment when citizens can mitigate health consequences of pollution privately or act collectively", European Journal of Political Economy, Vol. 34, pp. 142-156. [ Links ]
Bernauer, T. & Koubi, V. (2004), On the Political Determinants of Environmental Quality. CIS Working Paper, No. 2, Center for Comparative and International Studies, University of Zurich. Available at: http://e-collection.ethbib.ethz.ch/eserv.php?pid=eth:27672&dsID=eth-27672-01.pdf. [ Links ]
Bernauer, T. & Koubi, V. (2013). Are bigger governments better providers of public goods? Evidence from air pollution. Public Choice, 156 (3-4), pp. 593-609. [ Links ]
Buitenzorgy, M. & Mol, A. (2011), Does Democracy Lead to a Better Environment? Deforestation and the Democratic Transition Peak. Environmental and Resource Economics, 48 (1), pp. 59-70. [ Links ]
Carbon Dioxide Information Analysis Center-CDIAC-(2015), "Global, Regional, and National Fossil-Fuel CO2 Emissions," Global Change Data and Information Products. Available at: http://cdiac.ornl.gov/trends/emis/overview.html. [ Links ]
Carlsson, F. & Lundström, S. (2000), Political and Economic Freedom and the Environment: The Case of CO2 Emissions. Working Papers in Economics, No. 29, Department of Economics, Gothenburg University. [ Links ]
Congleton, R. D. (1992), Political Institutions and Pollution Control. Review of Economics and Statistics, 74 (3), pp. 412-421. [ Links ]
Das, J. & DiRienzo, C. E. (2010), Is Ethnic Diversity Good for the Environment? A Cross-Country Analysis. The Journal of Environment Development, 19 (1), pp. 91-113. [ Links ]
Didia, D. O. (1997), Democracy, political instability and tropical deforestation. Global Environmental Change, 7 (1), pp. 63-76. [ Links ]
Duit, A.; Hall, O.; Mikusinski, G. & Angelstam, P. (2009), Saving the Woodpeckers: Social Capital, Governance, and Policy Performance. The Journal of Environment Development, 18 (1), pp. 42-61. [ Links ]
Economic Commission for Latin America and the Caribbean-ECLAC- (2015), "Statistical Information; Statistics and Indicators," ECLAC. Available at: http://estadisticas.cepal.org/cepalstat/web_cepalstat/Portada.asp?idioma=i. [ Links ]
Farzin, Y. H. & Bond, C. A. (2006), Democracy and Environmental Quality. Journal of Development Economics, 81 (1), pp. 213-235. [ Links ]
Feng, Yi (1997), Democracy, Political Stability and Economic Growth. British Journal of Political Science, 27, pp. 391-418. [ Links ]
France, A. (2000), Towards a Sociological Understanding of Youth and their Risk-taking. Journal of Youth Studies, 3 (3), pp. 317-331. [ Links ]
Fredriksson, P.G.; Neumayer, E.; Damania, R. & Gates, S. (2005), Environmentalism, democracy, and pollution control. Journal of Environmental Economics and Management, 49 (2), pp. 343-365. [ Links ]
Fredriksson, P.G. & Wollscheid, J.R. (2007), Democratic institutions versus autocratic regimes: The case of environmental policy. Public Choice, 130 (3-4), pp. 381-393. [ Links ]
Fredriksson, P.G. & Neumayer, E. (2013), Democracy and climate change policies: Is history important? Ecological Economics, 95, pp. 11-19. [ Links ]
Gallagher, K.P. & Thacker, S. (2008), "Democracy, Income, and Environmental Quality," Working Paper, Boston University, available at: http://www.bu.edu/sthacker/demoenviro080321.pdf. [ Links ]
Garmann, S. (2014), Do government ideology and fragmentation matter for reducing CO2-emissions? Empirical evidence from OECD countries. Ecological Economics, 105, pp. 1-10. [ Links ]
Goldsmith, A.A. (1995), Democracy, property rights and economic growth. Journal of Development Studies, 32 (2), pp. 157-174. [ Links ]
Grafton, R. Q. & Knowles, S. (2004), Social Capital and National Environmental Performance: A Cross-Sectional Analysis. The Journal of Environment Development, 13 (4), pp. 336-370. [ Links ]
Grossman, G.M. & Helpman, E. (1990), Trade, Innovation, and Growth. American Economic Review, 80 (2), pp. 86-91. [ Links ]
Hager, S.; Straka, T. & Irwin, H. (2007), What Do Teenagers Think of Environmental Issues and Natural Resources Management Careers? Journal of Forestry, 105 (2), pp. 95-98. [ Links ]
Halkos, G.E. & Tzeremes, N.G. (2013), Carbon dioxide emissions and governance: A nonparametric analysis for the G-20. Energy Economics, 40, pp. 110-118. [ Links ]
Hoskins, B.; D'hombres, B. & Campbell, J. (2008), Does Formal Education Have an Impact on Active Citizenship Behaviour? European Educational Research Journal, 7 (3), pp. 386-402. [ Links ]
Kuznets, S. (1955), Economic Growth and Income Inequality. American Economic Review, 45 (1), pp. 1-28. [ Links ]
Li, Q. & Reuveny, R. (2006), Democracy and Environmental Degradation. International Studies Quarterly, 50, pp. 935-956. [ Links ]
Mak Arvin, M. & Lew, B. (2009). Does democracy affect environmental quality in developing countries? Applied Economics, 43 (9), pp. 1151-1160 [ Links ]
Marshall, M.G. & Jaggers, K. (2015), Polity IV Project: Political Regime Characteristics and Transitions, 1800-2013. Center for Systemic Peace and George Mason University and Colorado State University. Available at: http://www.systemicpeace.org/polity/polity4.htm. [ Links ]
Martinez, E.; Tazdaït, T. & Tovar, E. (2008). Participative democracy and local environmental issues. Ecological Economics, 68 (1-2), pp. 68-79. [ Links ]
Mayer, A. (2013), Education and the environment: an international study. International Journal of Sustainable Development & World Ecology, 20 (6), pp. 512-519. [ Links ]
Midlarsky, M. I. (1998), Democracy and the Environment: An Empirical Assessment. Journal of Peace Research, 35 (3), pp. 341-361. [ Links ]
Neumayer, E. (2002), Do Democracies Exhibit Stronger International Environmental Commitment? A Cross-country Analysis. Journal of Peace Research, 39 (2), pp. 139-164. [ Links ]
Payne, R. A. (1995), Freedom and the Environment. Journal of Democracy, 6 (3), pp. 41-55. [ Links ]
Pellegrini, L. & Gerlagh, R. (2006), Corruption, Democracy, and Environmental Policy: An Empirical Contribution to the Debate. The Journal of Environment Development, 15 (3), pp. 332-354. [ Links ]
Rivera-Batiz, F. L. (2002), Democracy, Governance and Economic Growth: Theory and Evidence. Review of Development Economics, 6 (2), pp. 225-247. [ Links ]
Sala-i-Martin, X. (1997), I just ran Two Million Regressions. American Economic Review, 87 (2), pp. 178-183. [ Links ]
Schultz, C. B., & Crockett, T.M. (1990), Economic Development, Democratization, and Environmental Protection in Eastern Europe. Boston College Environmental Affairs Law Review, 18, pp. 53-84. [ Links ]
Shafik, N. (1994), Economic Development and Environmental Quality: An Econometric Analysis. Oxford Economic Papers, 46, Special Issue on Environmental Economics, pp. 757-773. [ Links ]
Solow, R.M. (1956), A Contribution to the Theory of Economic Growth. Quarterly Journal of Economics, 70 (1), pp. 65-94. [ Links ]
Strandbu, Å. & Krange, O. (2003), Youth and the environmental movementsymbolic inclusions and exclusions. The Sociological Review, 51 (2), pp. 177-198. [ Links ]
Transparency International (2015), "Corruption by country", available at: https://www.transparency.org/country/. [ Links ]
United Nations University-World Institute for Development Economics Research-UNU-WIDER-(2014), "UNU-WIDER, 'World Income Inequality Database (WIID3.0b)', September 2014", available at: http://www.wider.unu.edu/research/WIID3-0B/en_GB/database/. [ Links ]
Walker, P. A. (1999), Democracy and environment: congruencies and contradictions in southern Africa. Political Geography, 18 (3), pp. 257-284. [ Links ]
Winslow, M. (2005), Is Democracy Good for the Environment? Journal of Environmental Planning and Management, 48 (5), pp. 771-783. [ Links ]
World Bank (2002), Constructing knowledge societies: new challenges for tertiary education, World Bank Publications, Washington D.C. World Bank (2015), World Development Indicators, World Bank Data, World Bank, Washington D.C. [ Links ]
You, W-H.; Zhu, H-M; Yu, K. & Peng, C. (2015), Democracy, Financial Openness, and Global Carbon Dioxide Emissions: Heterogeneity Across Existing Emission Levels. World Development, 66, pp. 189-207. [ Links ]
Youniss, J.; Bales, S.; Christmas-Best, V.; Diversi, M.; McLaughlin, M. & Silbereisen, R. (2002), Youth Civic Engagement in the Twenty-First Century. Journal of Research on Adolescence, 12 (1), pp. 121-148. [ Links ]
Zavestoski, S.; Shulman, S. & Schlosberg, D. (2006), Democracy and the Environment on the Internet. Science, Technology & Human Values, 31 (4), pp. 383-408. [ Links ]
Zellner, A. (1962), An Efficient Method of Estimating Seemingly Unrelated Regression Equations and Tests of Aggregation Bias. Journal of the American Statistical Association, 57 (298), pp. 500-509. [ Links ]
Zellner, A. (1963), Estimators for Seemingly Unrelated Regression Equations: Some Finite Sample Results. Journal of the American Statistical Association, 58 (304), pp. 977-992. [ Links ]
