


Services on Demand
Journal
Article
 English (pdf)
 Article in xml format
 Article references
 Send this article by e-mail
Indicators
-
 Cited by SciELO
 -
 Access statistics
Related links
-
 Cited by Google
 -
 Similars in
SciELO
Similars in
SciELO -
 Similars in Google
Share

 Permalink
Revista de Economía del Caribe
Print version ISSN 2011-2106
rev. econ. Caribe no.18 Barranquilla July/Dec. 2016
The spatial and long term evolution of land prices in a latin american metropolis: the case of bogotá, colombia
La evolución espacial y de largo plazo de los precios de la tierra en una metropolis latinoamericana: el caso de Bogotá, Colombia
Néstor Garza*
* IEEC – URBANUM. Universidad del Norte, Barranquilla, Colombia.
Se agradece el apoyo prestado por el convenio BID-KRIHS que permitió trabajar en este artículo como parte de una estancia de investigación en Korean Research Institute on Human Settlements (Seúl), en particular al Dr. Joon Park. Se agradecen también los comentarios ofrecidos por el examinador anónimo de la revista.
Fecha de recepción: julio 2016
Fecha de aceptación: septiembre 2016
ABSTRACT
We perform a time series analysis of the intra-urban spatial distribution and the long-term dynamics of land prices in Bogotá. We build a tractable database from a public information source, by spatially and non-spatially clustering zones into general components following their own statistical distribution. The method tries to diminish the effect of the Unit Areal Selection Problem. We compare the performance of the corrected and non-corrected time-series in different estimation exercises. The time-series exercises detect the effect of macroeconomic policy and planning conditions on the land prices during the period 1960-2010. Granger causality results suggest that the Colombian GDP is a strong determinant of the prices, while the real exchange rate is weakly related. Three sub-periods were used to perform alternative estimation exercises: developmental period (1960-1973), developmental with incentive to construction industry (UPAC) (1974-1990), and the neoliberal period (1991-2010).
Keywords: Land Price, Land Market, Time Series, Bogotá, Spatial Analysis.
Clasificación JEL: R14, R52, R30
RESUMEN
Se realiza un análisis de series temporales de la distribución espacial intraurbana y la dinámica a largo plazo de los precios de la tierra en Bogotá. Se usa una base de datos manejable a partir de una fuente de información pública, por medio de un agrupamiento espacial y no-espacial por zonas, siguiendo su propia distribución estadística. El método intenta disminuir el efecto del problema de Selección de Unidades de Área. Comparamos el desempeño de las series temporales corregidas y no corregidas en diferentes ejercicios de estimación. Los ejercicios de series de tiempo detectan el efecto de la política macroeconómica y las condiciones de planificación sobre los precios de la tierra durante el periodo 1960-2010. Los resultados de causalidad de Granger sugieren que el PIB colombiano es un fuerte determinante de los precios, mientras que el tipo de cambio real está débilmente relacionado. Se utilizaron tres sub-períodos para realizar ejercicios de estimación alternativos: período desarrollista (1960-1973), desarrollista con incentivo a la industria de la construcción (UPAC) (1974-1990) y período neoliberal (1991-2010).
Keywords: Precios de la tierra, Mercado de la tierra, Series de tiempo, Bogotá, Análisis espacial.
Clasificación JEL: R14, R52, R30
1. INTRODUCCIÓN
Land supply is perfectly inelastic, which causes land rents to have a long term land prices growth trend (Needham, 2000). Long term time series analysis offers a valuable tool to detect the impact on such prices of macroeconomic conditions, policy options and planning regimes.
Long term series analyses of land prices are scarce in the academic literature, being more common the analyses about housing and sometimes commercial built environment, prices and rentals. For example, the Case-Shiller (Case, 2006) repeated sales monthly index of housing prices.
Davis and Heathcote (2007) produced a long term residential land prices series for the USA. These authors use the series to assess the impact of urban regulation on prices and conclude that regulation increased land prices, while suburban expansion has decreased them. Unfortunately, this type of analysis ignores the Unit Areal Problem, because of not weighting the fact that recent suburban areas have in fact increased the price while making the rural to urban transition (Wong, 2009).
In developing countries, land prices research has prioritized cross-section analyses because of lack of available historical information1 . However, these are fast growing cities with a rapidly evolving urban periphery, consequently, the Unit Area Problem can be severe in long term analyses.
This paper focuses on the long-term spatial evolution (1960-2010) of land prices in Bogotá, the largest Colombian city and an important Latin American metropolis. The main research objective of the present paper is to produce spatially and not spatially controlled land prices time series, which are then used to assess the temporal evolution of the prices. We propose a correction strategy where a “core” zone collects neighbouring zones prices through a time-series chaining process that maintains the distribution of its errors.
We use three time-series to perform analysis of the impact of macroeconomic and policy variables on the prices: median, fitted and spatially fitted. The policies range from being developmental (1960-1973), to a still developmental but focused on incentives to the construction industry (1974-1990); and finally, a neoliberal period (1991-2010), which surprisingly has increased the use and enforcement of urban planning (Alfonso, 2012; Garza, 2016).
The results show that prices growth was beyond what predicted by GDP and Real Exchange Rate during the UPAC period 1974-1990, most likely because of being a macroeconomic policy that incentivised housing tenure via an inflation-indexed financial mechanism. The effect of the neoliberal period 1991-2010 is not clear; it had two urban master plans, and during the master plan 1989-1999 there was higher price growth, but slower during 2000-2010.
The paper detects a theoretically predicted long-term land prices growth as a function of economic development, a benchmark relationship that has not been addressed with a long term perspective in the literature about urban markets and planning in developing countries. The benchmark relationship allows us to consider the effect of policy changes, beyond the currently predominant cross-section or short period analyses on land prices and policy (McLaughlin, 2012).
The paper is divided in five sections, the first one being this introduction. Section two presents the methodology to produce comparable land prices series using a spatial and non-spatial component grouping procedure. In the third section, the methodology is exemplified by using the land use type: Commercial Central Zones. The fourth section introduces the case of Bogotá and the general land prices source of information. In the fifth section we perform time-series tests to determine the macroeconomic benchmark model, which is used to test the impact of period dummies for both macroeconomic regimes and master plans. Conclusions are in the sixth section.
2. METHODOLOGY
We use the Lonja de Propiedad Raiz (Real Estate Association of the City) reports, published in 1988, 1994, and yearly from there onwards. These show information for 114 zones in 2010, an increase from 68 in 1960. These zones have been added to the reports, according to changing urban development patterns during the entire period, but we will try to correct the implicit Spatial Unit Areal Problem (SUAP) of this information source.
The SUAP can be defined as the relative price change in an average (or median) land price series due to incorporation of new areas into urban use, but not to the price growth of the individual zones. For example, the incorporation of formerly rural hinterlands into the average land price series for a large city can moderate the average resulting of its fully consolidated central zones. However, the actual price might (most likely) have grown in all of the suburban and central zones alike, and the simple average price series would be a misleading source of information about the real estate dynamics.
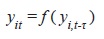
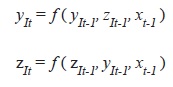
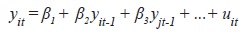
We intend to correct the SUAP using a spatial chain selection method, which improves the accuracy of the assembled time series when including new zones into the analysis. Formally speaking, if we consider each zone i in each year t as a function of its own past τ realizations:
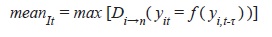
Mean values for zones per uses, large spatial sections, or for the entire city will be the maximum of their corresponding empirically determined distribution functions of the final realizations:
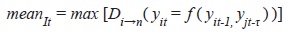
When a new zone j is included in the analysis, its realization values will be chained to the existing calculated means of all the i zones in a group I. If the effect on the mean values is significant, both the distribution and maximum per year will be changed. If it is not changed, the existing distribution remains and we just recalculate its maximum with the new information:
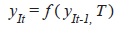
This way we smooth the means per groups I after the inclusion of new zones, while not losing the variation that these may produce on the series behaviour. On these fitted series per groups we can perform structural change analyses for periods T:
The (xt) variables to be used as time-series determinants of the prices will be: currency exchange, interest rate, inflation, national and metropolitan GPD per capita. With these variables we can perform fully determined Vector Auto-Regressive (VAR) time series models for the land prices, including dummies for the periods T or the master plans (zt):
Up to what we know, no analysis of this type has been done in a developing country metropolis. That is, a blend of long-term time series and spatial analysis techniques for the relationships between spatially and non-spatially corrected land prices time series, macroeconomic variables, and national and urban policy periods as determinants.
3. DATA AND STUDY CASE
The database source are the books published by the local Real Estate Association Lonja de Propiedad Raíz de Bogotá. These books are based on appraisals performed by Lonja associates and have been published since 1988. They cover spatially increasing sections of the metropolitan built environment since 1960. This information has been already used for research purposes (Garza, 2005; Jaramillo, 2004), but surprisingly, it has never been used in long-term analyses with a spatial perspective. The Lonja information remains however a sophisticated urban history source for a developing country.
Lonja classifies its observations per zones, which include the land use types: Elite Commercial, Central Commercial, Popular Commercial, Elite Residential, Upper-Middle Residential, Middle Residential, Lower-Middle Residential, Popular Residential and Industrial and warehouses. According to Lonja, these types summarize land use and values in the city. The information does not cover all the built environment but it summarizes city-wide appraisals in the corresponding year. Consequently, it approaches the true (intrinsic) land prices in both, developed and undeveloped properties (Lizieri et al., 2012). These characteristics cause the information to report a more up-to-date price when compared to cadastral records, while focusing on the potential market value.
Bogotá is located on a plateau 2,600 metres above sea level, historically it has had a north-south orientation along the axis of the Eastern Andes Mountains. The construction of the airport by the west and expansion highways by the north displaced development potential in these directions, increasing its built environment from 5,000 to 36,000 hectares during the study period. (Salazar, 2011). During these years the population grew from 1.7 to 7.3 million inhabitants, and the per capita income (PPP) in the country increased from US$ 2,949 to US$ 7,798 (Feenstra, Inklar and Timmer, 2015).
The urban form of Bogotá and the location of the Lonja zones, are represented in Map 1. The most highly valued residential and commercial uses are located in direction north – northeast, and the traditional centre is located towards the centre-southeast. The development of the city along this axis reflects its degree of adjustment to a Latin American city model (Griffin and Ford, 1981; Ford, 1996). Map 1 shows that middle income residential is located progressively distant from both the elite residential and commercial zones, also in the northern zone, while popular residential uses locate at the south-southwest, in proximity to industrial uses.
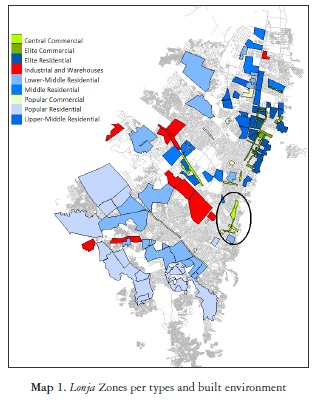
The number of Lonja zones reporting information has grown during the period of analysis, because of both growth of the built environment and increased spatial specialization of land uses. This characteristic is useful for analysis because it allows us to follow the real estate market evolution in a long term perspective, but simultaneously, it makes it difficult to produce average land prices series not affected by the SUAP. Maps 2 and 3 present the spatial distribution of land prices per Lonja zone and the number of zones with information in 1960 and 1990. It also presents the 117 Spatial Planning Units (UPZs) that comprise the city, as stated by the Master Plan 2000.
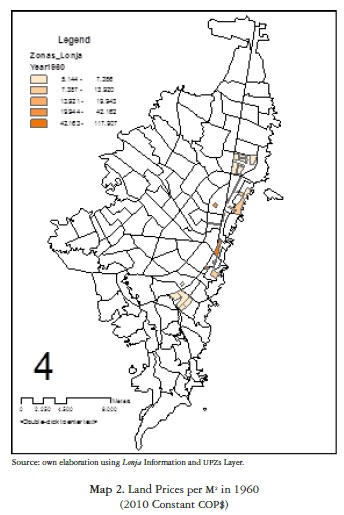
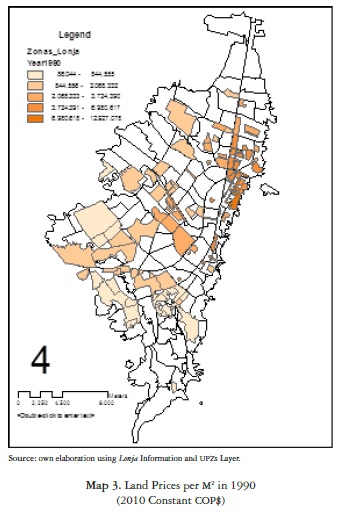
In the maps 2 and 3 we can appreciate that central commercial zones originally had higher land prices per M2 than elite northern commercial zones, a situation that had changed by 1990. In recent years the differences are less marked, possibly due to bad congestion problems in both central and northern zones (Delaunay & Dureau, 2004)
The larger number of zones reporting information in peripheral low price residential developments in south and south-western zones. This reflects their access into formal market mechanisms and the detection of such a trend by Lonja appraisers (Gilbert, 1998).
The maps 2 and 3 also depict a story of dramatic land price increase in the long term, not only during construction peaks associated to neoliberal reforms as detected by Garza (2005) and Jaramillo (2004), but during the 1960s and 1970s, when the city had its highest population and economic growth.
4. PRODUCING RELEVANT LAND PRICE SERIES
4.1. Time series (non-spatial control)
As explained above not all the Lonja zones had available information in all the years. The simple average and median of the land prices per zones is depicted in Graph 1, where we can see that the prices have had a sustained price increase during the entire period, and not just during the neoliberal transition 1991-1995, as detected by previous research (Garza & Montaña, 2001; Garza, 2005).
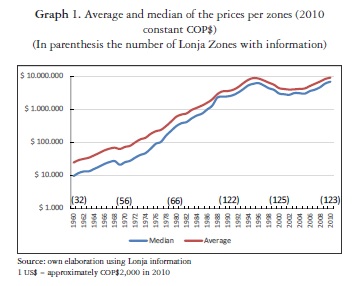
The information reported in Graph 1 is biased due to the number of zones under analysis, and because of having SUAP. This is evident when there are changes in land use, its intensity of occupation, or the transition from rural-to-urban. These modifications cannot be accounted for in mean land price series, but we can try to moderate their impact by detecting their shared spatial and time behaviour as time-series of common components.
In order to understand the procedure, in this section we make an example with the Central Commercial land use in the database: There are 9 Central Commercial zones in the Lonja information, 7 of them have information for the entire period 1960-2010, while Calle 19 Tramo 1, and Ciudad Salitre Comercial have information only for the period 1988-2010. They are coloured pink in Map 5.
According to map 4, five of the nine zones are geographically close, basically around traditional downtown, two of them (Bavaria and Ecopetrol) are a bit north of that location, three have disperse locations at the north Chapinero and Galerias, and one (Ciudad Salitre Comercial) at the northwest. All of the zones have developed around main streets and have elongated polynomic shapes2.
The first step is to produce all the possible regressions of each one of the zones against their own and the other zones one-period-lag (AR(-1))realizations: yit-1; yjt-1
In the second step, the regression results are then classified according to their goodness of fit, choosing the ones with the highest goodness as “cores” around which to create components by sequentially adding the other zones. The procedure continues until all the zones have been added to one single core, and that is the corrected land price series. The estimation procedure assumes different functional forms in ascending degree of complexity: Normal then Poisson then Gamma then Weibull3. The reason for this selection mechanism is to increase the likelihood of finding relationships between the land prices per zones, while aggregating them in a single component. Results of these procedures are reported in Table 1.
The models presented in Table 1 are the corresponding to zones 2, 6 and 8 as cores, and all of their component series have positive and significant AR(-1) parameters. In these three cases the normal distribution was just enough according to the Kolmogorov-Smirnov test. These are the estimated models:
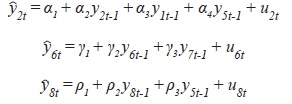
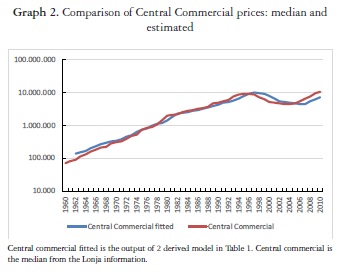
In the third step, we choose model 2 as the main core because of having the best Akaike and Schwartz criteria in Table 1, and proceed to sequentially incorporate the estimated values of models 6 and 8 in the Final Model of Table 1:
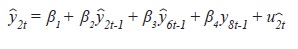
As it can be seen in Table 1, the final model is a short time-series 1988-2010 because the zone 9 Ciudad Salitre Comercial reports information only in that period. In model 2 Derived, that includes estimated values of models 2 and 6, information covers the entire period, but the AR(-1) components cause it to be a 1961-2010 series. The estimated values of model 2 Derived and the median of the prices of the 9 zones are reported in Graph 2, where we can appreciate their similarity. We will use both the fitted and the median series in the empirical section below, where we will relate them to macroeconomic variables, policies and city master plans.
4.2. Time series (spatial control)
Table 1 presents results of using spatial controls when connecting the components of the common estimated series of prices for the Central Commercial zones. In these cases, the grouping includes a standardized direct distance matrix between the zones that report information for all the years. The search for appropriate regressors in every component now changes to:

And the intermediate components construction changes to:

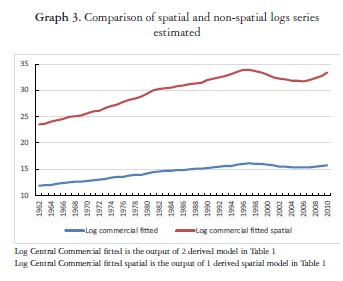
Where T O Wijis the spatial matrix that relates the standardized distances between each i and j zone, increased (Kronecker multiplied) in the T total number of periods, so that all the cross-sections that report land prices are spatially weighted. According to the results presented in Table 1, the search process determined that the best fit regression and the only one with significant parameters was model 1 Spatial, where zone 1 is dependent upon zones 7 and 8 (Chapinero and Galerias), once we have found the best fit function by using a gamma distribution (according to Kolmogorov-Smirnov), we now add the estimated AR(-1) and spatially lagged time series of the other zones, producing the model 1 Spatial Derived that is equivalent to 2 Derived. These time series are reported in the Graph 3.
The procedures presented in this example have been applied to all the Lonja zones, so that we have land prices series as a single component, including all the land uses. There are three land prices series: median, fitted and spatially fitted, used in the next section to perform time-series analysis.
5. TIME SERIES ANALYSES: POPULATION, THE ECONOMY AND POLICY
5.3. Benchmark and test models
In this section we search for long term determinants of the three land price series. The first set of determinants are macroeconomic variables: GDP of the country, population of the city, real interest rate and real exchange rate, that summarize trends and cycles determinants of the land prices (Cesa-Bianchi et al., 2015). We use them in Unrestricted VAR (Vector Auto-Regressive) system estimations.
We use a two lags selection Unrestricted VAR system where each variable is dependent upon itself and the other variables, and allows us to perform predictability Granger Tests. The tests are used to exclude variables and produce a benchmark model of macroeconomic determinants of the land prices. We will sequentially add policy and planning period dummies to this benchmark model.
A summary of the Granger causality tests on the prices and the macroeconomic variables is reported in Table 2. We are using two lags Granger tests on the unrestricted VAR estimations. The variables included in the analysis of Table 2 are the median and fitted land prices. We also use the first difference of the median, because of being de-trended and having the same cointegration order as Real Exchange Rate and Real Interest Rate.
The analysis in Table 2 reveals that Colombia GDP is the best predictor of both the median and fitted land prices. Bogotá population has been rejected as a determinant and will not be used in further analyses. We can also see that the Real Exchange Rate was a stronger predictor than the Real Interest Rate, variable that will also be excluded from further exploration.
The benchmark model thus defined, including Colombia GDP and Real Exchange Rate as explanatory variables, is now used to compare macroeconomic policies and master plans impacts on the prices. The results are reported in Table 3, for the median, fitted, and fitted spatial land prices.
The policies are represented by dummy variables per periods in Table 3, following the next classification:
- Developmental period (1960-1974): in the context of import substitution, protectionist trade policy increased manufacturing activity in the economy. Inefficiency problems and lack of internal demand growth, caused a policy change (Ocampo, 1998).
- UPAC period (1974-1990): this period was characterized by stagnating import substitution, and the creation of UPAC (Constant Purchasing Power Unit), a system of incentives to construction industry and financial intermediation. It consisted of specialized housing banks that guaranteed inflation-protected (but not so profitable) savings accounts, while guaranteeing relatively high but not volatile mortgage loans to home buyers. The system worked relatively well during the 1970s but it had seemingly reached demand saturation by the 1980s (Jaramillo, 1992)
- Neoliberal period (1991-present): in accordance to markets liberalization, the inflation-indexed and specialized banking system UPAC was replaced by traditional finance mechanisms for housing consumption. Demand side subsidies replaced public housing provision as a mechanism to increase housing tenure (Jaramillo and Cuervo, 2010).
There were two Master Plans during the analysis period, also represented by dummy variables in the estimations of Table 3:
- 1989-1999: first modern planning scheme for the city, it was developed under the umbrella of the National Law 9 of 1989 (The Urban Reform). The plan determined the urban perimeter.
- 2000-2010: this master plan was enacted in the context of the National Law 388 of 1997, and in addition to traditional zoning and incentives to development per areas, included economic tools of land use management (value-capture).
In models 1 to 6 of Table 3 we can observe that the three policies had a significant impact on the Median land prices, negative in the developmental and neoliberal periods, but positive in the UPAC period. Models 5 and 6 show that master plans had no effect on prices. We cannot ascertain that the plans were not determinants of land price changes, but we can guess that their impact was marginal when compared to the policies. After all, the policies are national scale initiatives with financial and macroeconomic ramifications.
In the second set of models (7 to 12) we are using the Fitted prices of the common component as explained above. In these models, the impact of the developmental period is still negative, and the impact of the UPAC period remains positive. The neoliberal period does not have any significant effect, while the two master plans are significant, positive for the plan 1989-1999, and negative for the plan 2000-2010.
Models 13 to 18 use the Spatially Fitted land prices as dependent variable. In this case, the Developmental and Neoliberal periods had negative and significant parameters, while the impact of the UPAC period was positive. At the same time, the dummy for the master plan 1989-1999 was positive and significant, but negative and significant for 2000-2010.
The results thus far presented for the Median, Fitted and Spatially Fitted land price series suggest that during the developmental period, once discounted the effect of the GDP and exchange rate, land prices grew slower when compared to the other two periods. During the UPAC period, land prices grew faster. The evidence on land prices growth during the neoliberal period is not consistent between the different time series estimation, however it seems to be slower. The evidence on land prices growth during the Master Plans is non consistent between the different time series, however it seems it was higher during 1989-1999 but lower during 2000-2010.
From the above we infer that during the developmental period, and in spite of having high economic and population growth, land prices did not grow excessively. We might guess that as the city had not occupied all of its urban area, the land supply was less constrained. In contrast, during the UPAC period there was acceleration of the land prices in a context with less economic and population growth, this macroeconomic policy must have had an impact on land prices through its increasing effect on payment capability.
Table 3 shows that during the neoliberal period prices growth was slower for the median and spatially fitted series. This period can also be divided in two sub-periods, the corresponding to the master plans 1989-1999 and 2000-2010. The dummies for these sub-periods did not have an effect on the Median prices in Table 3, but positive for the first sub-period and negative for the second one in the case of the Fitted and Spatially Fitted series. We consider that this result might be due to the implementation of a land value-capture strategy during 2000-2010, a land policy that moderates land prices (Garza & Lizieri, 2016).
5.4. Neoliberalism, planning and the prices
In this section we produce further explorations to the relationships between the master plans 1989-1999 and 2000-2010, with neoliberalism as the macroeconomic policy during both of those periods. This is a relevant analysis from a policy point of view, in particular because this period of economic liberalization coincided with a contrasting path towards formalizing and enforcing urban regulation in the country and its cities (Alfonso, 2012; Garza, 2016).
We use the Fitted and Spatially Fitted series in all the test specifications of this section, emphasising the interactions between the two master plans and the neoliberal policy dummies, and the interaction of this last one with the regressors Colombia GDP and Real Exchange Rate. The regression results are reported in Table 4.
In the models 1 and 4 of the table, we are adding an interaction term between the GDP and the neoliberal period dummy. These specifications capture the idea that the period not only directly affects the prices, but the parameter that positively associates them with the GDP (income to land price elasticity). As observed in Table 4, the dummy parameter is positive, but the interaction term is negative, although not significant in model 4. Consequently, the evidence in favour that neoliberal period has coincided with relatively low land prices weakens.
Models 2, 3, 5 and 6 of Table 4, include neoliberal period and Master plans dummies simultaneously. We can observe that: a) the dummy for the master plan 1989-1999 was always positive, but negative for the dummy of master plan 2000-2010; and b) the dummy of neoliberal period was always negative and significant, evidence of stability of the results. The good results for the Master plan 2000-2010 reinforce our perception that the use of value capture has slowed down speculative pressures in the land market.
6. CONCLUSIONS
We have presented a statistical chain process that allows us to produce spatially and non-spatially corrected land prices series in contexts of fast urban growth and scarcity of information. The process consists of a time-series component method, where we add information to core zones, chaining them according to the best fit distribution of their residuals in AR(-1) regressions. The procedure is spatially corrected by using Kronecker-expanded spatial weights on the AR(-1) series.
The paper presents an example of this procedures in the Central Commercial zones of the city, and then applies them to all the 123 available zones with information of the Lonja de Propiedad Raiz for the period 1960-2010. We built three land prices time-series: Median, Fitted and Spatially Fitted. Their performance was tested in VAR exercises, where the Colombian GPD per capita and Real Exchange Rate were selected as the better predictors in a benchmark time-series model.
The benchmark model was used to determine the effect of dummy variables for three periods: developmental 1960-1974, UPAC 1975-1990, and neoliberal 1991-2010. There is evidence that the land prices growth was higher during the UPAC period than during the developmental period, in spite of having slower economic and population growth. This result is congruent with the UPAC being a macroeconomic strategy that increased housing payment capability via an inflation-indexed financial mechanism. The effect of the neoliberal period on prices is not clear.
Using the benchmark model and emphasizing the neoliberal period, we have detected two sub-periods: master plans 1989-1999 and 2000-2010. There is some evidence that during the first period land prices growth was higher, during the second they were lower. This result might be due to the Master plan 2000-2010 having used value-capture, a policy that moderates land price speculation.
Notas
1 Remarkable exceptions have been Cesa-bianchi et al. (2015) who use a 1990-2015 time series analysis for both emerging and developed economies; Hossein, M. & M. Helbich (2013) for Mumbai in the period 1970-2013; and Navarro (2013), who uses housing market 1997-2008 panel per cities in Colombia and Bolivia.
2 This will be an important observation when performing a spatial weighting of our time series construction methodology.
3 In our gamma function we use traditional k as √(s/2) , with the skeweness of the distribution. Our parameter is one.
7. REFERENCES
Alfonso, O (2012). Bogotá Segmentada: Reconstrucción Histórico-Social de la Estructuración Residencial de una Metrópoli Latinoamericana. Serie de Economía Institucional Urbana 6 - Universidad Externado de Colombia, Bogotá [ Links ].
Case, B. (2006). Housing Price Indexes. In: Arnot R. and D. McMillen (eds), A Companion to Urban Economics. Blackwell Publishing [ Links ]
Cesa-bianchi, A; L. Cespedes & A. Rebucci (2015). Global Liquidity, House Prices, and the Macroeconomy: Evidence from Advanced and Emerging Economies. Journal of Money, Credit and Banking, 47: 301-335. [ Links ]
Davis, M. and J. Heathcote (2007). The price and quantity of residential land in the United States. En: Journal of Monetary Economics 54. [ Links ]
Delaunay, D. & Dureau, F. (2004). Componentes sociales y espaciales de la movilidad residencial en Bogotá. Estudios Demográficos y Urbanos 55, 77-113. [ Links ]
Fedelonjas (1988). El Valor del Suelo en Bogotá 1959-1988 y sus implicaciones en el desarrollo de la ciudad. [ Links ]
Feenstra, R; R. Inklaar and M. Timmer (2015). The next generation of the Penn World Table. [Forthcoming] American Economic Review. [ Links ]
Ford, L. (1996). A new and improved model of Latin American city structure. Geographical Review 86 - 3, 437-440. [ Links ]
Garza, N. (2005). Precios del suelo en Bogotá: crecimiento versus especulación. Territorios 13, 133-154 [ Links ]
Garza, N. (2016). Primate Cities in Latin America: a theoretical framework based upon intra-urban driving forces. International Journal of Urban Sciences 20(2), 241-259. [ Links ]
Garza, N. & C. Lizieri (2016). A spatial-temporal assessment of the land value development tax. Land Use Policy 50, 449-460. [ Links ]
Garza, N & J. Montaña (2001). Distribución espacial de los valores y usos del suelo en Bogotá. Cuadernos de Economía 33, 153-169 [ Links ]
Gilbert, A. (1998). The Latin American City. Monthly Review Press. London. [ Links ]
Griffin, E. and L. Ford (1980). A model of Latin American city structure. Geographical Review 7 - 4, 397-422. [ Links ]
Hossein, M. & M. Helbich (2013). Spatiotemporal urbanization processes in the megacity of Mumbai, India: A Markov chains-cellular automata urban growth model. Applied Geography 40, 140-149 [ Links ]
Jaramillo, S. (1992). Bajo el signo del UPAC: estructura de producción y política de vivienda en Colombia 1972-1990. En: Sarmiento, E. (ed), Cambio Estructural y Crecimiento. Tercer Mundo Editores, Bogotá [ Links ].
Jaramillo, S. (2004). Precios inmobiliarios en el mercado de vivienda en Bogotá 1970-2004. Documentos CEDE 10 - Universidad de los Andes. [ Links ]
Jaramillo, S. and N. Cuervo (2010). Dos décadas de política de vivienda apostando por el mercado. Jaramillo, S. (ed), Bogotá en el Cambio de Siglo: Promesas y Realidades. OLACHI - Instituto de Estudios Urbanos. Quito, Ecuador. [ Links ]
Lizieri, C.; S. Satchell & W. Wongwachara (2012). Unsmoothing real estate returns: a regime-switching approach. Real Estate Economics 40 (4), 775-807. [ Links ]
Lonja de Propiedad Raíz de Bogotá (1998). El Valor del Suelo en Bogotá 1990-1998. [ Links ]
Lonja de Propiedad Raíz de Bogotá (2010). Estudio del Valor del Suelo Urbano en Bogotá. Sello Editorial Lonja, Bogotá [ Links ].
McLaughlin, R. (2012). Land use regulation: where have we been, where are we going? Cities 29 - 1, S50-S5. [ Links ]
Navarro, I. (2013). Housing Markets on Cocaine: Explaining the Relationship between Cocaine Exports and Local Housing Markets in the Andes. Journal of Housing Research 22(1), 59-74 [ Links ]
Needham, B. (2000). Journal of Property Research 17 - 3, 241-257. [ Links ]
Ocampo, J. (1998). Historia Economica de Colombia. Tercer Mundo Editores, Bogotá [ Links ].
Salazar, F. (2011). Bogota's recovery process. Sorensen, J & J. Okata (Eds), Megacities: Urban Form, Governance, and Sustainability. Springer-Verlag. [ Links ]
Wong, D. (2009), The modifiable unit areal problem (MAUP). Stewart, A. & P. Rogerson (eds), The SAGE Handbook of Spatial Analysis, pp. 105-124. SAGE Publications Ltd, London. [ Links ]

