


 English (pdf)
 Article in xml format
 Article references
 Send this article by e-mail
 Cited by SciELO
  Cited by Google
  Similars in
SciELO
Similars in
SciELO  Similars in Google
 Permalink
INTRODUCTION
The banana (Musa sp.) is considered one of the more important crops for diets worldwide, including the Colombian population (Muñoz, 2014). The planted area of bananas and plantains in Colombia is close to 380,000 ha (Danies, 2005), of which more than 48,000 ha corresponded to bananas for export (Quesada, 2013; AUGURA, 2014). At the global level, Colombia in 2016 was ranked 7th as a banana producer with 2,000,000 t of banana production (FAOSTAT, 2017). The export banana industry created around 40,000 direct and indirect jobs in 2004 and surpassed 60,000 jobs after 2012 (Espinal et al., 2005; Quesada, 2013).
Fertilization practices are an important issue in the management of banana production. Espinosa and Mite (2002), when analyzing achievements in banana fertilization practices from 1960 to 2002, indicated that, since 1992, most studies in the area were focused on adjusting the universal characteristics of banana fertilization to specific conditions of each region based on data from soil analyses. López and Espinosa (1995) proposed fertilizer ranges for N, P, K, Ca, and Mg based on nutrient contents in soil for banana producing countries in Central and South America. These authors raised the need to use soil analyses and reference values as a basis for regional adjustments of fertilizer doses (López and Espinosa, 1995).
Currently, the Uraba region faces certain challenges with productivity and fruit quality in the banana (Sánchez and Mira, 2013; Penagos, 2017); these problems originate in an inadequate balance of fertilizer use and affect investments in fertilizers, a cost that can amount to more than 40% of total production costs in bananas. Fertilizer rates in the region are traditionally lower than those suggested by Cenibanano (Colombia) for banana varieties cultivated in the area. A consequence of the management is the manifestation of nutrient disorders in the plants, such as a N deficiency, as reflected in shorter plants, smaller leaf area, generalized leaf chlorosis, and low yields. "Maturity spots" on the fruit surface generate losses in fruit quality in Uraba and are considered a physiological disorder attributed to a low availability of Ca in soils, which produces losses between 3 and 5% for a low incidence (rainy periods) and up to 18% for a high incidence (dry periods) (Sánchez and Mira, 2013). Nutrient problems in banana cultivation have made Cenibanano and various banana companies start research projects on banana nutrition in order to define optimal fertilization rates for cultivating and the area, reconciling technical, agronomic, and economic parameters.
Important morphological variables that describe the growth of banana plants include pseudostem height, number of leaves, and leaf area, which, among other factors, depend on the level of fertilization of the crop. Low levels of fertilization with N, Ca, or Zn frequently result in a reduced leaf area in bananas (Lahav and Turner, 1992), while excess (Moreira, 1999) or deficit (Freitas et al., 2015) N could result in a higher incidence of Sigatoka on the leaves. Adequate fertilization with N also affects plant height and leaf number in bananas (Lahav and Turner, 1992; Mustaffa and Kumar, 2012). At the same time, leaf number in Musa sp. serves as an important indicator of meristem changes from the vegetative to the reproductive development (Karamura and Karamura, 1995). Additionally, a minimum number of leaves, such as 12 in banana cv. Gran Nain at flowering, is required to produce fruits without problems in fruit quality or postharvest ripening (Rodríguez et al., 2012), while Lima et al. (2017) indicated that an increased number of leaves at flowering corresponded to an increased fruit length and mass in the 4th hand, as well as an increased bunch mass and extended postharvest period in cv. Nanica. Studies carried out on banana cultivars in different regions of the world have related the effects of mineral nutrition, especially with N, on these growth variables (Melo et al., 2010; Mustaffa and Kumar, 2012). On the other hand, in Colombia, such as in the banana producing region of Uraba, no studies have been reported on the subject, which is why it is necessary to evaluate the effect of fertilizer rates on height, number of leaves, and leaf area of the crop as part of the soil-plant relationship.
Studies in this area are important to the economic aspects of banana production in the Uraba region. The aspect that substantially affects banana production in Uraba is the excessive cost of fertilizers (Sánchez and Mira, 2013), which obliged the growers to search for alternatives that would reduce their expenses. Therefore, there is a need to improve fertilization practices and improve their efficiency, which includes adequate fertilizer doses and soil analysis as a tool to generate fertilizer recommendations. In this sense, plant growth responses to fertilizer rates could serve as an indicator of deficient or excessive applications of mineral nutrients. This research sought to evaluate the effect of fertilization with N on height, number of leaves, and leaf area in banana cv. Williams in two production cycles in Uraba, Antioquia.
MATERIALS AND METHODS
This study was carried out in the tropical humid region of Uraba-Antioquia (Colombia) in the experimental and demonstrative field of the Augura Company (Carepa, Antioquia), located at 7°46'46" N latitude and 76°40'20" W longitude at 20 m a.s.l. The soils were described as fine Fluventic Eutrudepts, clay loam over clay Fluvaquentic Eutrudept, and fine loam Vertic Endoaquept according to the USDA soil taxonomy (IGAC, 2007).
The climatic conditions at the study site included 87% average relative air humidity, maximum air temperature of 32.3°C, minimum air temperature of 23.2°C, and average air temperature of 26.7°C (the regional average was 27°C). The average solar brightness was 5 h d-1 for a total of 1,700 h year-1. The average annual precipitation was 845 mm during the first production cycle (from August, 2011 to April, 2012) and 2,088 mm for the second production cycle (from February to December, 2012). Each production cycle lasted 10 months.
A banana crop (Musa AAA Simmonds cv. Williams) giant Cavendish subgroup, Williams clone was used. This plant has an average height of 3.5 m and is one of the two primary clones employed for export in different tropical regions of the world (Soto, 2001; Robinson and Galán, 2012). A banana plantation in the 6th productive cycle was used.
The fertilization plans recommended by Cenibanano for Uraba were used to establish the doses of fertilizers in accordance with the soil analysis (Sánchez and Mira, 2013). The nitrogen doses were (kg ha-1): 1) absolute control without fertilization; 2) 0; 3) 161; 4) 321.8, and 5) 483. All treatments, except the absolute control, received the following fertilization (kg ha-1): 87.1 P2O5, 678.8 K2O; 50.5 CaO; 117.5 MgO; 64.2 S; 1.4 B; and 9.3 Zn. The sources of the mineral fertilizers were: Urea (46% of N), KMag (22% K2O, 18% MgO, and 22 % S), fertiboro (10% B), solufos (30% P2O5, 36% Ca, 5% S, and 8% Si), ZnO (80% Zn), potassium sulphate (50% K2O and 18% S), and KCl (60% K2O).
Four replicates (blocks) per treatment were established, in which the treatments were randomized. Each of these replicates (blocks) was distributed based on the soil types in the experiment area. Each treatment was matched to the area units, called "botalones". Each "botalon" had an area of 1,563 m2 and 250 banana plants, from which 15 plants were selected, with a height between 1.0 and 1.50 m. These plants formed an experiment unit and were evaluated according to the number of weeks and growth phases (Tab. 1). The agronomic management in the area was similar to that applied to the commercial banana crop in the Uraba region, except for the fertilizer doses. The fertilizer doses were split within each production cycle, for an average total of 17 applications of fertilizers per year, with approximately 3 weeks between the applications.
Table 1 Sampling times of the cv. Williams bananas according to the number of weeks and growth phases.
| Phase of growth | Sampling time | Weeks of growth since sucker emergence |
|---|---|---|
| Vegetative | Vegetative growth | 17-18 |
| Reproductive | Flower differentiation | 22-23 |
| Productive | Flowering | 39-40 |
| Productive | Bunch filling | 43-44 |
| Productive | Harvest | 50-51 |
The phases of fruit filling and harvest during the first cycle of production coincided with the vegetative and floral differentiation phases of the second cycle. The time between the phases floral differentiation and flowering in the first cycle was extended one week because of the climatic conditions. The sampling time was selected considering the phase and time of plant development, with at least two weeks after the application of the respective fertilizer dose; in most cases, the sampling was done before the fertilizer treatments.
Morphological variables
The following variables were measured in each growth phase:
Plant height (m), measured with tape from the union of the pseudostem with the corm to the last axilla of leaves;
Number of leaves. In each selected growth phase, the youngest fully expanded leaf was counted as the 1st leaf, then counting the number of leaves after it, considering the plant phyllotaxis;
Leaf area, measured on leaf number 3, using the length from the base of the leaf blade up to the apex and the width in the middle part of the leaf. The following mathematical equation from Turner (2003) was used:
AFT = (0.80) x (0.662) x L x A x N (1)
where AFT - total leaf area of the plant; L - length of the 3th leaf (m); A - width of the 3th leaf (m); 0.80 - proportionality factor; N - number of leaves; 0.662 - coefficient defined by the relationship between the total and the estimated leaf area.
A complete randomized block design was employed with five treatments and four replicates. The multi-variate approach was used for the analysis of variance of the repeated measures design, with two factors between the subjects (fertilization and repetitions) and one intra-subject factor associated with the production cycle. The linear models were adjusted according to the phenological stage and the vegetative structures, simultaneously evaluating the responses in plant height, number of leaves, and leaf area. The data were processed using software programs SAS 9.3 (SAS Institute, Inc.), R, and Stat-graphics Centurio XV (Statpoint Technologies, Inc.).
Plant height, leaf area, and number of leaves were evaluated jointly to adjust three models. One of these models described the vegetative, differentiation and flowering phenological stages, for which a repeated means design was proposed using the treatment as a factor between subjects, the cycle as an intra-subject factor and the blocks associated with the spatial variability of the soils, which facilitated adjusting the model. The other two models were defined for the phenological stages of fruit filling and harvesting; these models were performed independently; for this, the same design was used, with the same factors and blocks, to adjust the multivariate models. Additionally, since there was no interaction between the factors, contrast tests of variances between the control and other treatments were used to search for the effect of the treatments; this test was more robust than the one used in the multivariate model. A descriptive analysis was performed on the averages per treatment and phenological stage for each variable, as presented in the tables.
RESULTS AND DISCUSSION
Statistical results
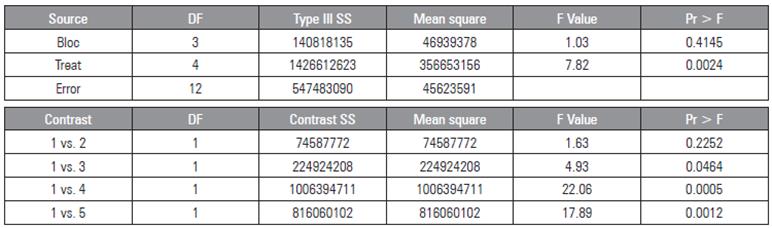
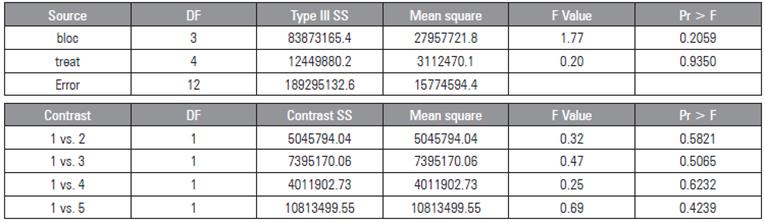
The analysis of repeated measures for plant height, number of leaves and foliar area showed significant differences (F<0.0001) for the phenological stages between the vegetative stage and flowering (Tab. 2); no differences were found for the treatments or for the interaction phenological stage x treatment. In the fruit filling stage (Tab. 3), no statistical differences were found in the interaction block x treatment, but differences were found for the treatment. The contrasts between the control and the other treatments showed significant differences between the control and the treatments with N doses exceeding 321.8 and 483 kg ha-1. At harvest, no significant differences were found for the factors, including the blocks, or their interactions; in addition, there were no differences observed in the control variances with other the treatments (Tab. 4). The physical soil variables (data not shown) did not affect any of the responses of the variables evaluated in the present study.
Table 2 Analysis of variance for plant height, number of leaves, and leaf area from the vegetative stage to flowering of the banana cv. Williams.
| Source | Type III SS | Mean square | F Value | Pr > F | |
|---|---|---|---|---|---|
| Phenological stages (ef) | 2 | 140602517925 | 70301258962 | 788.98 | <.0001 |
| Treatments (treat) | 4 | 520400645.53 | 130100161.38 | 1.46 | 0.2302 |
| ef*treat | 8 | 830414365.73 | 103801795.72 | 1.16 | 0.3409 |
| Error | 45 | 4009663041.4 | 89103623.142 |
Table 3 Analysis of variance for plant height, number of leaves, and leaf area at fruit filling of the banana cv. Williams with contrasts of variances between absolute control without fertilization (1) and the nitrogen doses (kg ha-1): 0 (2); 161 (3); 321.8 (4) and 483 (5).
Plant height
The height of banana plants is an important parameter in crop management because it is related to plant vigor and affects bunch harvesting (Nomura et al., 2017). The descriptive analysis with the averages of this variable (Tab. 5) showed an increase between the phenological stages for the two cycles as a response to plant development, with a tendency to stabilize plant height after flowering. For the first cycle, the N doses of 321.8 and 483 kg ha-1 resulted in the highest plant height until flowering and harvest, but, for fruit filling, this response was not so clear. For the second cycle, the effect of the N doses did not show a definite trend in most phenological stages, except at flowering and harvest, where the doses of 321 and 483 kg ha-1 resulted in the tallest plants. When comparing the responses of the phenological stages between cycles (Tab. 5), in the vegetative stage, the plants were taller for the first cycle than for the second; in flowering, the opposite trend occurred, when the plants were shorter in the first cycle and taller in the second one. These differences could be attributed to the changes in precipitation levels for those stages in the two cycles, when the second production cycle was characterized with very high rates of precipitation.
Table 5 Influence of the N dose on average plant height (m) of the banana cv. Williams.
| Cycle | Dose of N | Growth stage | ||||
|---|---|---|---|---|---|---|
| (kg ha-¹) | Vegetative | Flower differentiation | Flowering | Fruit filling | Harvest | |
| Control | 1.5 | 2.1 | 2.8 | 2.8 | 3.3 | |
| 0 | 1.6 | 2.0 | 2.5 | 3.1 | 2.9 | |
| 1 | 161 | 1.8 | 2.1 | 2.8 | 3.2 | 3.2 |
| 321.8 | 1.8 | 2.1 | 2.9 | 3.1 | 3.1 | |
| 483 | 1.7 | 2.2 | 2.9 | 3.1 | 3.0 | |
| Control | 1.3 | 2.2 | 3.1 | 2.6 | 2.7 | |
| 0 | 1.3 | 2.2 | 3.1 | 3.3 | 2.9 | |
| 2 | 161 | 1.2 | 2.0 | 3.0 | 3.1 | 2.9 |
| 321.8 | 1.4 | 2.1 | 3.3 | 3.3 | 3.3 | |
| 483 | 1.2 | 1.8 | 3.5 | 3.3 | 3.1 | |
Mostafa (2005), while working with the cv. Williams for two cycles and N doses of 500 g/plant, reported plant heights at harvest between 2.72 and 3.08 m for the first cycle and 2.77 to 3.18 m for the second cycle, values similar to those reported (Tab. 5). Patel and Tandel (2013) found the largest height (1.62 m) with a nitrogen dose 100 g /plant, applied with drip irrigation, in banana Musa paradisiaca cv. Basrai. Kumar et al. (2003), for different cultivars of banana, achieved the highest average height (3.81 m) with doses of 480 kg ha-1, while Patil and Shinde (2013) obtained the tallest plants with a nitrogen dose of 100 g/plant, supplemented with organic matter from manure and phosphorus solubilizing organisms, which resulted in the largest height (2.90 m) at harvest in banana cv. Ardhapuri.
Although Kumar et al. (2003) and Mostafa (2005) indicated that the higher the N dose the greater the height, this was not totally evident in the present study, where the doses of 321 and 483 kg ha-1 at harvest for the first cycle resulted in lower values than control (Tab. 5). This result could be attributed to the effect of nutrient recycling, such as of residual N in the soil, to the mother-sucker dependency (Bhende and Kurien, 2015), and to the climatic conditions for this period (Soto, 2001; Robinson and Galán, 2012). For the second cycle, our data were similar to that reported by other authors, when higher N doses resulted in the tallest plants (Tab. 5).
Number of leaves
The number of leaves during flowering serves as an important parameter for bunch development in bananas since these leaves are related to the plant photosynthetic rate and reflect the potential yield (Nomura et al., 2017). The number of leaves in the current study, according to the descriptive analysis, increased until flowering and subsequently decreased until harvest (Tab. 6), typical for this crop development (Soto, 2001). When comparing the cycles, variations between the phenological stages were observed, for example, in vegetative stage, the highest leaf number was observed in the first cycle, while at flower differentiation, the highest leaf numbers were in the second cycle (Tab. 6). These differences can be explained by the variations in the precipitation per cycle, when the second cycle had a precipitation rate exceeding 2,000 mm. In particular, cv. Williams is characterized by sensitivity in the stomata to vapor pressure deficits (Turner et al., 2007), which might be regarded as part of a water saving mechanism during low rainfall and, thus, contributed to a slower rate of leaf emission in the periods of low precipitation. When observing the behavior of the treatments per cycle, the application 321.8 kg ha-1 resulted in the highest number of leaves until flowering, while, for the second cycle, there was no predominance of any treatment for this variable.
Table 6 Influence of N dose on the average number of leaves per plant in the banana cv. Williams.
| Growth stage | ||||||
|---|---|---|---|---|---|---|
| Cycle | Dose of N (kg ha-¹) | Vegetative | Flower differentiation | Flowering | Fruit filling | Harvest |
| Number of leaves per plant | ||||||
| Control | 5.0 | 7.5 | 12.0 | 8.3 | 7.3 | |
| 0 | 4.8 | 7.8 | 12.3 | 8.8 | 7.5 | |
| 161 | 5.3 | 7.3 | 13.5 | 8.5 | 6.8 | |
| 321.8 | 5.3 | 7.3 | 14.0 | 9.8 | 6.8 | |
| 483 | 4.5 | 7.8 | 12.8 | 9.8 | 7.5 | |
| Control | 4.8 | 8.5 | 12.3 | 10.8 | 4.8 | |
| 0 | 3.3 | 8.0 | 12.5 | 8.5 | 5.0 | |
| 2 | 161 | 3.5 | 8.0 | 11.8 | 10.8 | 4.8 |
| 321.8 | 3.3 | 8.0 | 12.5 | 9.8 | 5.8 | |
| 483 | 4.5 | 7.0 | 12.8 | 10.3 | 5.0 | |
Soto (2001) indicated that the average number of leaves at flowering for 10 banana clones, including the clone Dwarf Cavendish and the Great Dwarf, is between 10 and 15; these values (between 12 and 15), compared with the values for both cycles (Tab. 6) and for the same stage of development, could be considered typical. When our data were compared with the results of Patil and Shinde (2013), who worked with different clones, the values of the present research were low since these authors reported higher values for the stages before flowering.
Mostafa (2005), while working with Williams banana for two seasons and evaluating the effect of the N dose 784 kg ha-1 annual, found that the number of leaves to harvest varied between 11.6 and 13.9, different from what was found in the current research for the two cycles in the same growth stage (Tab. 6), between 4.8 and 7.5. This difference could be attributed to the practices of sanitary management, such as "leaf surgery", and the agronomic management used in the Uraba area (elimination of old leaves and those affected by Sigatoka), but there was sufficient leaf area to complete the production cycles.
Leaf area
Because leaf area is a variable that is dependent on the number of leaves, it behaved in a similar way, that is, increased in value until flowering and subsequently decreased at harvest (Tab. 7). In the stages vegetative, flower differentiation, and harvest, the leaf area was higher for the first cycle. For the other two stages (flower differentiation and fruit filling), the situation was the opposite, that is, lower values of leaf area were obtained in the first cycle, with the same explanation for these variations as seen for the number of leaves.
Table 7 Influence of N dose on the average leaf area (m2) in the banana cv. Williams.
| Cycle | Dose N | Vegetative | Flower differentiation | Flowering | Fruit filling | Harvest |
|---|---|---|---|---|---|---|
| Leaf area (m2) | ||||||
| Control | 0.41 | 3.25 | 13.85 | 7.83 | 7.76 | |
| 0 | 0.50 | 2.69 | 12.28 | 9.14 | 6.92 | |
| 1 | 161 | 0.78 | 2.93 | 14.61 | 8.72 | 8.59 |
| 321.8 | 0.72 | 3.25 | 15.63 | 11.74 | 7.78 | |
| 483 | 0.54 | 4.28 | 12.77 | 11.30 | 8.32 | |
| Control | 0.46 | 4.31 | 13.76 | 8.84 | 5.20 | |
| 0 | 0.16 | 3.78 | 14.69 | 9.45 | 6.67 | |
| 2 | 161 | 0.24 | 2.47 | 11.58 | 11.30 | 5.13 |
| 321.8 | 0.13 | 2.99 | 15.47 | 12.01 | 5.74 | |
| 483 | 0.73 | 2.33 | 17.30 | 11.75 | 5.56 | |
Kuttimani et al. (2013), in the banana cv. Gran Nain at pre-flowering, found that different combinations of synthetic and organic fertilizers contributed to variation in the leaf area, between 12 and 18 m2, a range which included the values of this variable in the current research at the flowering stage (Tab. 7) for the two production cycles (12.28 to 15.63 m2 for the first cycle and 11.58 to 17.30 m2 for the second one).
Kumar et al. (2003), Keshavan et al. (2014), Patil and Shinde (2013), when evaluating leaf area in different banana cultivars at harvest, found significant differences. The best responses in this variable were found by these authors when working with high N doses and included phosphorus solubilizing microorganisms and/or involved organic fertilization, results that show a better morphological response of the plants to high N doses. These results agree with the present research, with the treatments of 321.8 kg ha-1 for the two cycles and 483 kg ha-1 for the second cycle (Tab. 7), which presented the highest leaf area even though there were no statistical differences between the treatments, except for the one for the contrasts of variances.
In general, the research indicated a positive effect when increasing the N doses on plant height, number of leaves, and leaf area in the banana cv. Williams under the conditions of Uraba. Based on the results, a low-cost organic material is suggested for use in the banana crops, covering the difference between 321.8 and 483 kg ha-1 and applied in a regulated manner in order to achieve similar levels of growth. Additionally, in future research with different fertilization doses of one or several nutrients, the effect of the mother-sucker dependency on the studied variables should be investigated.
CONCLUSIONS
The effect of the nitrogen doses on banana growth per production cycle for the variables plant height, higher leaf number and leaf area was evaluated by stage of development, showing the doses of 321.8 and 483 kg ha-1 as the doses with the best performance. The highest rates of leaf growth were reported for various periods of crop development, such as flowering and fruit filling, except for the harvest. The dose of 483 kg ha-1 had the highest effect because it resulted in the greatest plant height and increased leaf number and leaf area in two production cycles


