


 English (pdf)
 Article in xml format
 Article references
 Send this article by e-mail
 Cited by SciELO
  Cited by Google
  Similars in
SciELO
Similars in
SciELO  Similars in Google
 Permalink
INTRODUCTION
Pisum sativum, known as pea or sweet pea, is a self-pollinated legume, with a genome made up of seven chromosomes (2n = 14) (Smýkal et al., 2008). It is one of the staple foods of the basic market basket of the Colombian family because of its high content of protein and micronutrients, such as zinc and iron (Amarakoon et al., 2012; Peralta et al., 2013).
It is possible to find shrub-type peas, semi shrub-type peas and snowy-peas within P. sativum. Shrub peas are low-bearing, and their growth ends in flower, semi-shrubs are medium-sized peas that end in leaf lets and snowy peas are high, require a tutor and end in leaflets. Two types of planting are used: with tu tor and crawling planting without tutor or broadcast planting. Planting with a tutor generates high yields and a higher fresh pod quality; however, one of the limiting factors in this production system is the cost of the tutoring because the structure of the plants does not have enough tendrils to be left on the tu tors without the plants falling on the ground; a high usage of polypropylene threads is necessary for their mooring (Checa-Coral and Rodriguez, 2015).
In Colombia, the pea is the second most important legume, after the bean, with a cultivated area of 35,211 ha and a green pod yield of 4.1 t ha-1. Its pro duction is concentrated in six departments: Nariño, Cundinamarca, Boyacá, Tolima, Huila, and Nariño, the latter being the main producer with 15,816 ha (Checa-Coral and Rodriguez, 2015). This department has suitable areas for producing shrub peas, a suit able alternative for diversification in the cereal zone of Nariño because of its capacity for adaptation, high yield potential and possibility of harvesting green pods or dry-grained sheaths, depending on market conditions. However, in Nariño, the varieties of peas include snowy peas, which require tutoring systems to help the plant stay off the ground, allowing an in crease in potential yield. According to Checa-Coral et al. (2017), employing a tutoring system represents 52% of total crop costs, which has led farmers with limited finances to not use tutored systems for the cultivation of peas, significantly increasing the in cidence of foliar diseases such as mildew (Erysiphe polygoni) and Ascochyta (Ascochyta pisi), reducing yield and deteriorating quality of the final product. Because of technification difficulties in snowy pea tutoring systems, studies on shrub peas are vital, within which genotypes with the Afila gene (aF) are found, which, in the homozygote condition, trans forms leaves into tendrils (Mike, 2008; Smýkal et al., 2013), reducing tipping and preventing the sheaths from coming into contact with the ground, avoiding pod rotting under high relative humidity conditions (Checa-Coral et al., 2017). This type of pea with a shrub growth habit tends to obtain low-bearing and early genotypes, with sheath qualities for fresh consumption and for the agroindustry (Checa-Coral et al., 2017). This material is adapted to the cereal zone and, with an adequate harvest time, could be an alternative to partially cover the national demand for dry peas and for producers to obtain good profit ability because of the low cost of implementation of this crop.
Given the importance of shrub peas as a crop in the Department of Nariño-Colombia, it is necessary to initiate genetic improvement programs for genotypes with this growth habit. It is advisable to carry out molecular characterization of collections that allow breeders to identify genes of interest to associate them with agronomic characteristics and thus gener ate results that express genetic diversity. Knowledge on genetic diversity fosters the efficient use of germ-plasm, identifying and eliminating duplicates, and helps the establishment of nucleus collections (Ghafoor et al., 2005). Genetic diversity is the main input for the genetic improvement of a cultivated species. Local and wild varieties are kept in germplasm banks as genetic resources; however, their use in genetic performance improvement has been limited (Ali et al., 2007).
One of the most used molecular methods for charac terization and genetic diversity studies are molecu lar markers. Microsatellites have become the most used markers because of their high polymorphism and easy handling in the laboratory; these markers have the ability to differentiate homozygous and heterozygote individuals. These markers consist of DNA fragments with a few nucleotides in length, between 2 and 6 base pairs, which are randomly repeated several times (Vieira et al., 2016). In 2005, a research group established sets of specific SSR microsatellites for P. sativum (Loridon et al., 2005), which have been used in several studies to observe the genetic diversity of the pea; for example, 21 SSR markers were used in a collection of more than 1,000 introductions. Zong et al. (2009) found that the genetic diversity of the Chinese collection has several differences that were detected in the global gene pool, such as the presence of rare alleles. These markers have been used in various studies over the years thanks to their high polymorphic information content, codominance and reproducibility (Smýkal et al., 2008; Cieslarová et al., 2011; Rana et al., 2017).
SSRs have also been used for studies of disease re sistance; for instance, it has been found that resis tance to Aphanomyces euteiches (cause of rotten root) is moderately heritable (Hamon et al., 2011).
Having specific pea genotypes of determined growth or shrubs adapted to the region, for which an adequate cultivation technology is established, improves the income of farming families in munici palities that used to be wheat producers in Nariño and allows farmers to return to agricultural activi ties by generating new work opportunities (Checa-Coral et al., 2017).
The aim of this work was to carry out the molecu lar characterization of 50 shrub pea genotypes from the collection of the GRICAND Research Group of the Universidad de Nariño, using SSR microsatellite molecular markers to serve as a starting point for the establishment of breeding programs for the species.
MATERIALS AND METHODS
Plant material
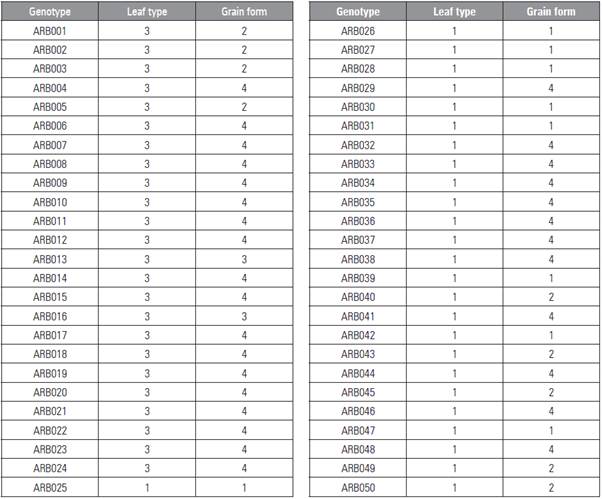
The study population was formed by 50 genotypes of P. sativum with a shrub-like growth habit, which are part of the Pisum sativum L. collection of the GRICAN Research Group on Andean Crops of the Universidad de Nariño. Sowing and germination of the plant material was carried out during the last three weeks of September, 2018 in the green house of the Universidad Nacional de Colombia, Palmira Campus. Three plants of each genetic ma terial were sown, and the sowing was carried out in germinators used for seedlings. When the plants were approximately 10 cm high, young leaflets were extracted, collecting approximately 5 g of foliar tis sue which was stored in ultra-freezers at 80°C. Si multaneously and in order to renew the seed in the Servicio Nacional de Aprendizaje of Colombia - SENA, 50 pea genotypes were multiplied in the field, using furrows 2 m in length with a distance between fur rows of 60 cm, depositing one seed per site. The lot was used to register the characteristics of leaf type and grain form based on UPOV descriptors (UPOV, 2009) (Tab. 1).
DNA extraction
The SPIN Plant Mini Kit® (STRATEC Biomedical AG, Birkenfeld, Germany) with its respective procedure was used for the DNA extraction. The quantification of the genetic material was carried out with a Colibri Spectrophotometer® (Titertek-Berthold, Pforzheim, Germany) to obtain more precise measurements. The DNA dilutions were carried out for the normal ization and homogenization of DNA concentration, with values of 30 ng /xL-1, for the subsequent molecu lar evaluations with PCR reactions.
Genotyping
The genotyping used 16 molecular microsatellite fluorescent markers (SSR), described by Loridon et al. (2005) (Tab. 2). These markers were subjected to a process of standardization to determine what was the best hybridization temperature of each one. Sub sequently, the amplification of the samples was done with the PCR technique.
Table 2 SSR markers employed in research with their sequence forward and backward, hybridization temperature and molecu lar weight.
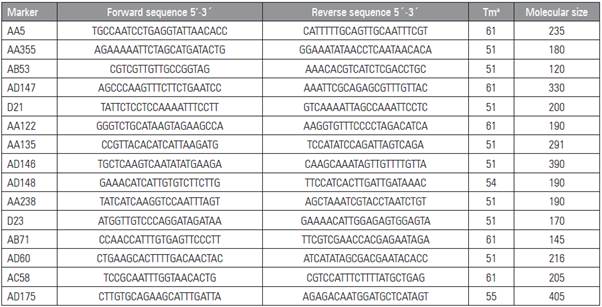
Tma: hybridization temperature.
Once products of amplification were obtained, the markers were mixed in plates with 96 wells where PCR products were combined; each well contained a maximum of three markers, which could not be the same color (PET, VIC, FAM, NED) and had to have distant molecular weights. These plates were sent to the laboratories of Macrogen (Seoul) for the analysis of the fragments of the SSR microsatellites.
SSR microsatellites statistical analysis
The size of the alleles in base pairs, was estimated using standard lane size ROX-500 (Applied Biosys tems, Foster City, CA) with GENEIOUS Software® v 11.1 (http://www.geneious.com) (Kearse et al., 2012). The number of polymorphic alleles observed, expected heterozygosity, and genetic diversity of Nei (1973), were observed using Arlequin Program v 3.5.2.2 (Excoffier and Lischer, 2010). Likewise, the Polymorphic Information Content was calculated (Botstein et al., 1980).
For a distance or similarity analysis, two meth odologies may be used: a Principal Coordinates Analysis (PCoA) or a dendrogram (tree diagrams). A PCoA generates a scattering graph that can have two or three dimensions, where the distances be tween the samples shown in the graph reflect the genetic distances between them. On the other hand, a dendrogram performs a grouping of the samples that are genetically similar (Nisar et al., 2017). The PCoA was carried out using GenAlex v 6.5 program (Peakall and Smouse, 2012). On the other hand, the dendrogram was performed considering the created matrix and the similarity method of UPGMA/DICE using the Simqual programs of the NTSYS-PC pack age (Rohlf, 2006).
To assess the genetic structure of the genotypes, Structure v 2.3.4 was used (Falush et al., 2007). The criteria recommended by Porras-Hurtado et al. (2013) were used: the number of subpopulations (K-value) was 1-10, with 10 runs, for a Burn-in pe riod of 100,000 steps and 200,000 interactions of the Monte Carlo Markov Chain (MCMC). To determine the best K, the method of Evanno et al. (2005) was considered. The Structure Selector Program was used (http://lmme.qdio.ac.cn/StructureSelector/). These steps were repeated the necessary times until the structural behavior of the samples was clearly de fined. In order to determine a significant genetic differentiation between the possible groups created in Structure, an analysis of molecular variance was carried out (AMOVA), along with determination of using Arlequin v 3.5.2.2 (Excoffier and Lischer, 2010).
RESULTS AND DISCUSSION
Analysis of SSR microsatellites
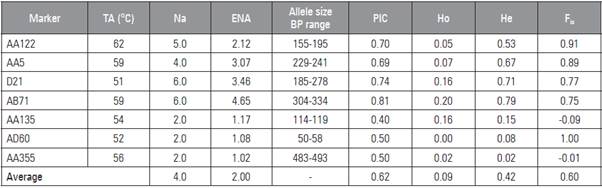
Seven out of the 16 markers showed polymorphisms, and 27 alleles were found within the 50 genotypes (Tab. 3). Loci with a greater allelic richness includ ed AB71 and AD21, with 6 alleles each. The aver age number of alleles was 4, with a range of 2 to 6 alleles per locus (Tab. 3); this result is greater than that reported by Ahmad et al. (2012) but similar in other studies on the Pisum genus (Cupic et al., 2009; Ponnaiah et al., 2011) and less than that reported by Hagenblad et al. (2014), where a range of 5 to 12 alleles was found, as was recently reported by Rana et al. (2017). The size of the alleles had a range of 50 493 base pairs. The polymorphic information content (PIC) had an average of 0.62; according to Botstein et al. (1980), this value indicated that the markers were highly informative since they were above 0.50 and in dicated that there could be an allelic variation within the samples. Similar values were reported in other pea research (Nasiri et al., 2009; Ahmad et al., 2012). Studies that have evaluated a larger number of Pisum accessions have observed a larger allele, indicating that some markers may become more polymorphic depending on the number of accessions that have been implemented (Ahmad et al., 2012). The inbreed ing coefficient (Fis) was 0.60 which indicated that there was a level of inbreeding, which explained that the observed heterozygosity (Ho) was less than the expected heterozygosity (He) (0.09 and 0.42, respec tively). This indicated that there was a high homozygosity normal behavior in the P. sativum individuals because of its pollinated nature (self-fertilization).
Table 3 SSR markers with annealing temperature (Ta), number of alleles (Na), effective number of alleles (ENA), allele size range, polymorphic information content (PIC), observed heterozygosity (Ho) and expected heterozygosity (He), in breeding coefficient (Fis).
The low observed heterozygosity has been report ed in other research on P. sativum:Handerson et al. (2014) obtained a Ho of 0.031, Smýkal et al. (2008) obtained a Ho of 0.069 with a collection from the Czech Republic and Teshome et al. (2015) used a col lection of P. sativum from Ethiopia, finding a Ho of 0.05, which confirms that P. sativum is a species that tends towards homozygosis (Teshome et al., 2015). On the other hand, according to Vallejo and Estrada (2002), in autogamous plants (such as Pisum sativum), inbreeding is expected to give a value equal or very close to one (1). Likewise, loci AB71 and AA135 had Ho values of 0.20 and 0.16, respectively. The inbreed ing values and Ho values could be explained by the fact that the seeds were obtained through open field sowing, which increased the probability that polli nating insects visited the flowers. Some research has suggested that the main pollinators of Pisum belong to the order of diptera, hymenopteros and lepidoptera (Naeem et al., 2018). In addition, in some cases, Pisum pistil may remain in a suitable state after anthesis (Kosterin and Bogdanova, 2014). These factors could suggest that the inbreeding and Ho resulted from the existence of some cases of allogamy or cross-pollination in the collection.
Genetic diversity
In the dendrogram (Fig. 1A), two main groups were observed with a similarity coefficient (DICE) of ap proximately 0.74 (Group I and Group II). With an approximate coefficient of similarity of 0.93, most of the sub-groups (15 subgroupings) were formed, which were highly related to the groups formed with the PcoA (Fig. 1B). In Group 1 of the dendro gram, sub-groups of genotypes with a high coefficient of similarity (<0.98) are observed, such as ARB 004 with 024; ARB 006 with 007, 008, 017 and 021; and ARB 022 with 023, among others. These high simi larities could have been the product of the genotypes used in this study, with a very small population, a shrub growth and a particular area: Department of Nariño, along with sharing the same morphological characteristics.
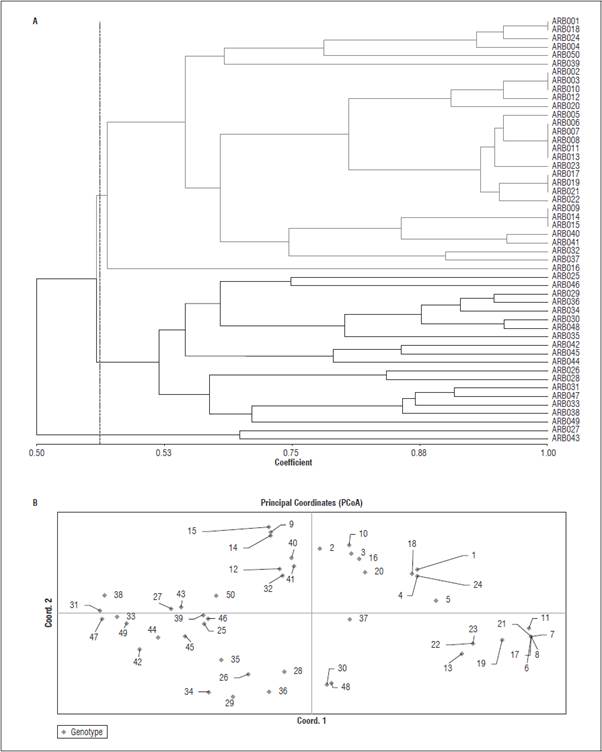
Figure 1 Similarity analysis for 50 genotypes of P. sativum with SSR markers: A) Dendrogram using the DICE/UPGMA method. B) Analysis of main coordinates (PCoA).
The graph of main coordinates analysis (Fig. 1B) was carried out with the first two coordinates, which explained 51.20% of the total variation within the samples. Coordinate one explained 29.32%, and co ordinate two explained 21.88%. By observing the groupings formed in the dendrogram (Fig. 1A) and in the PCoA analysis (Fig. 1B), it was observed that they were highly associated.
The analysis of the structure of the 50 P. sativum accessions showed a K = 2 with the higher hierar chical level of the genetic structure, which was sup ported by the Bayesian analysis (Fig. 2A). These two groupings (Group I and Group II) formed by the STRUCTURE analysis were highly associated with the groups found in the dendrogram. The accessions separated in two groups by STRUCTURE, in the same way as groups I and II of the dendrogram. On the other hand, the AMOVA analysis showed a FST value of 21.92% (P<0.00001), indicating that there was significant genetic differentiation between the two large groupings. Because the structure analysis was performed for each of the two groups separate ly, each group threw a hierarchy level K = 2, which indicated that each group has two subgroups (Fig. 2B and 2C).
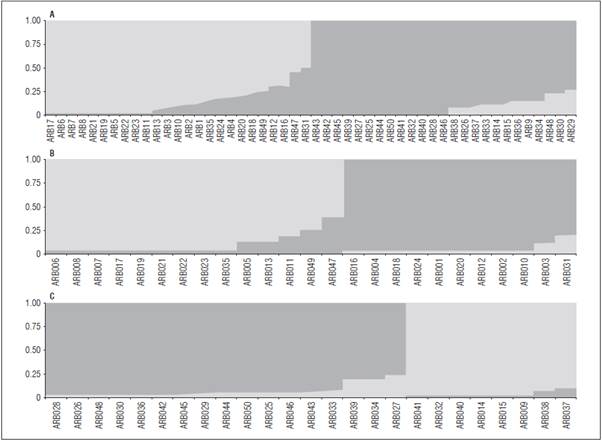
Figure 2 A) Bayesian analysis of the genetic structure (K = 2) in the 50 shrub pea genotypes based on seven microsatellite loci. B) Bayesian analysis of the genetic structure (K = 2) in group I (Group I) of the shrub pea genotypes. C) Bayesian analysis of the genetic structure (K = 2) in group II (Group II) of the shrub pea genotypes. Each bar equals an individual genotype.
These K values have been demonstrated by Nasiri et al. (2009) and Ahmad et al. (2012), where a K = 2 were obtained. Other authors have reported some not very distant groups with K = 3 (Jing et al., 2012; Rana et al., 2017). The high similarity between the groups found in both the dendrogram, PCoA and STRUCTURE may have been due to the fact that the genotypes in the same group may share similar morphological features. According to the morpholog ical traits (Tab. 1), it was observed that most geno types belonging to group I had a sharp blade form (without leaves), with tendrils only and a rectangu lar grain form in several forms. It was observed that the genotypes of grouping II had a normal leaf form with lateral leaflets that finished in tendrils and, like Group I, a rectangular grain form in various forms. Morphological level differences were not found for the subgroups.
Finally, this is the first study that employed SSR mi crosatellite markers for the study of genetic diversity in the Pisum sativum Collection of the Department of Nariño (Colombia). Understanding the collection of P. sativum with the Afila gene is of great importance for the horticultural sector since it prevents the de terioration of product quality by reducing foliar diseases.
Although the use of SSR can be an effective tool for characterizing germplasm, for future research, it is recommended to have information at the geographic level on the origin of the genotypes, which will al low a much more complete system for the analysis of diversity and the possible development of new growths.
CONCLUSION
This study demonstrated the usefulness of molecular markers for molecularly characterizing P. sativum pea accessions. Understanding the richness of alleles is a priority and a significant help in different breeding and replanting programs since they are a pillar for better development of this crop. The morphological traits used in this study, along with the molecular points, explained the differences found within and between the accessions. The results of the diversity and genetic structure are useful for identifying con trasting groups to guide the selection of parents. The genetic variability between the accessions was suffi ciently high, suggesting that the genetic diversity of the pea is sufficient for the possible combination of favorable genes.
Using these results as a first step, a self-pollination process of several generations shall follow in order to obtain pure lines. Hence, it is necessary to inte grate genetic, morphological, disease resistance and production results to establish a possible relationship with the data obtained and, thus, be able to propose improvement programs. Research is currently under way to adjust planting distances, densities and eco nomic analyses to exploit the productive potential of these genotypes.
In the future, the release of the first volatile variety with the Afila gene for the country is expected. These new varieties reduce the costs of tutoring (52%) by half or more


