


 English (pdf)
 Article in xml format
 Article references
 Send this article by e-mail
 Cited by SciELO
  Cited by Google
  Similars in
SciELO
Similars in
SciELO  Similars in Google
 Permalink
INTRODUCTION
The demand for sweeteners for dietary and pharmacological purposes is growing. Stevia (Stevia rebaudiana Bert.) contributes to the supply of natural and non-carcinogenic sweeteners (Anton et al., 2010). Stevia (Asteraceae), native to Brazil and Paraguay, has been used for its medicinal and dietary properties, derived from its glycosides stevioside and rebaudioside A, both of which are 300 times sweeter than sucrose (Espita et al., 2009).
The relationship between stevioside and rebaudioside A is an important variable for analysis in new stevia genotypes. According to Mota et al. (2015), the industry prefers genotypes that have a ratio close to 1 g g-1 because stevioside has a low water solubility and bitter residual taste, while rebaudioside A is more soluble and has no residual taste.
Stevioside and rebaudioside A are more concentrated in leaves and are diterpene glycosides that are synthesized in the same mevalonate pathway as gibberellic acid (Jarma et al., 2010).
The cultivation of stevia in Brazil is incipient and does not meet the growing domestic demand.
Brazil imported more than US$8 million and exported US$2.7 million in stevia in 2013 (MDIC, 2019).
Stevia has potential for cultivation in the Alto Vale do Itajaí region, Santa Catarina. The increasing demand for glycosides warrants studies for the selection of new genotypes with productive potential, local adaptation, and stevioside and rebaudioside A ratios required by the industry (Mota et al., 2015).
In southern Brazil, studies by the Universidade Federal do Parana (UFPR) with unevaluated genotypes provided by EMBRAPA - CENARGEN collected in different regions of Brazil, showed that stevia can be grown in the Curitiba region, State of Parana (Francisco, 2015), justifying exploratory research on the genotypes provided by EMBRAPA - CENARGEN in areas with different soils and climates, such as those in the Alto Vale do Itajaí region (SC).
Because of the lack of agronomic information and genotypes adapted to the Alto Vale do Itajaí region (SC), this study aimed to evaluate four different stevia genotypes provided by EMBRAPA - CENARGEN in terms of dry weight yield, glycoside content and yield, and rebaudioside A: stevioside ratio.
MATERIAL AND METHODS
This study was carried out at Sítio São Miguel, located in the city of Lontras (SC), Brazil (27° 9' 58" S, 49° 32' 31" W altitude of 475 m). The climate was Cfa according to the Köppen classification; climate data during the experiment were determined (Tab. 1).
Table 1 Temperature, humidity and photoperiod during the experiment. Rio do Sul (2014/2015).
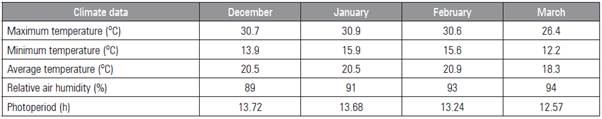
Source: IFC (2015).
The soil in the experiment area was classified as Argissolo Amarelo distrófico típico (EMBRAPA, 2006). Soil analysis data were collected (Tab. 2).
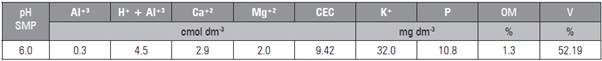
The soil was corrected according to laboratory analysis results. The corrections were based on the Fertilization and Liming Manual for the states of Santa Catarina and Rio Grande do Sul (SBCS and CQFS, 2016). The soil was corrected with phosphorus and potassium fertilization when preparing the beds, 15 d prior to transplanting the seedlings. A rotary tiller was used to prepare the soil of the experiment area.
The fertilization was carried out with doses (kg ha-1): 90 N, 68 P2O5 and 110 K2O, supplied by urea, superphosphate and potassium chloride, respectively. A split application of urea was done at transplanting and 30 d after transplanting, according to Lima Fiho (2004). The genotypes used in this study were supplied by EMBRAPA - CENARGEN (Brasilia, DF). The genotypes have distinct morphological and productive characteristics, as evidenced by previous studies at UFPR (Francisco, 2015).
The seedlings were obtained from branches of mother plants located at Fazenda Canguiri - UFPR - Pinhais (PR), Brazil, based on the methodology of Carvalho and Zaidan (1995) and using IBA (Indol butyric acid) at a concentration of 2000 mg L-1. The seedlings were produced in commercial substrate (Macrofértil®) on the premises of the Instituto Federal Catarinense (IFC) - Rio do Sul (SC) campus. At transplanting, the seedlings were subjected to apical bud breaking, according to EMBRAPA (2004), which consisted of cutting the seedlings at a height of 5 cm from the soil.
The seedlings were transplanted in beds prepared with a raised bed planter. The experiment was installed on December 12, 2014. The spacing used was 0.25 x 0.50 m - 80,000 plants/ha (SBCS and CQFS, 2016).
The treatments consisted of Genotype 4 (G4), Genotype 8 (G8), Genotype 9 (G9) and Genotype 12 (G12). A randomized complete block design with four treatments (stevia genotypes) and four replicates was used. Each plot consisted of 21 plants, with 5 plants per useful area. Plants were harvested when they were at 5% flowering (Lima Fiho, 2004), which occurred at different times for each genotype.
The following characteristics were evaluated: leaf dry weight (LDW), stem dry weight (SDW), branch dry weight (BDW), total dry weight (TDW), main branch length, number of secondary branches, number of tertiary branches, leaf area (LA), leaf area index (LAI), specific leaf area (SLA), leaf area ratio (LAR), leaf weight ratio (LWR), stevioside and rebaudioside A yield, stevioside and rebaudioside A contents, and rebaudioside A: stevioside- ratio. The plants of the useful plot were cut 5 cm from the ground (Lima Fiho, 2004) and taken to the Plant Physiology Laboratory of IFC (Rio do Sul campus), where the leaves were separated from the stems. The LDW and SDW were determined on a digital scale after drying the leaves and stems at 50 °C until constant weight was reached (Espita et al., 2009). A tape measure was used to determine the height of the main branch. The number of secondary and tertiary branches was counted.
The leaf area (LA), leaf area index (LAI), specific leaf area (SLA), leaf area ratio (LAR) and leaf weight ratio (LWR) were determined using the methodologies described by Cunha et al. (2010) using an artisanal leaf disc cutter with an area of 10 mm, precision electronic scale (Gehaka® AG 220S) and air circulation oven (ACB Labor®).
To quantify the stevioside and rebaudioside A yield, samples of 1 g of leaf tissue were collected from plants in the useful area of each treatment. A leaf tissue sample was randomly collected from the LDW of the plants that made up the useful area of the plot. We used the extraction and quantification methodology described by Kolb et al. (2001), with modifications. The modification consisted of using 0.3 mL of the sample extracted from the leaves of each treatment, adding 0.7 mL of HPLC grade acetonitrile. Dry leaf tissue samples were placed in 250 mL Erlenmeyer flasks with 100 mL of 70% ethanol. The solution was heated to 70 °C and stirred for 30 min. After cooling, a 10 mL aliquot was filtered (quantitative filter paper and a 0.22 µm nylon syringe filter). We used 0.3 mL of the sample extracted from the leaves of each treatment by adding 0.7 mL of HPLC grade acetonitrile. From this dilution, 20 µL were injected for further analysis in a High Performance Liquid Chromatograph (Shimadzu CBM-10A) containing a Phenomenex Luna® 5 µm NH2 100 Å, 250 x 4.6 mm column. Elution was at room temperature in isocratic mode using a mixture of acetonitrile-distilled water (80:20, v/v) as a solvent and a flow rate of 2 mL min-1. Detection was done by UV at 210 nm with sensitivity adjusted to 0.04 AUFS. Readings were taken in triplicate. The quantification of each metabolite was obtained by converting the area of the curve corresponding to retention time using a previously established calibration curve. The standard solution for obtaining the calibration curve was 1.0 g L-1 stevioside and rebaudioside A in methanol (Kolb et al., 2001). The conversion was expressed in mg g-1.
The results were subjected to analysis of variance using Assistat 7.7 beta (Silva and Azevedo, 2009). Treatment variances were initially assessed for homogeneity with Bartlett's test. All variables showed homogeneous variances, and the effects of the treatments were tested with the F test. Means were compared with the Tukey test at 5%.
RESULTS AND DISCUSSION
Plant growth
G12 and G4 had the highest LDW of all the genotypes (Tab. 3). G12, G8 and G4 were equal for TDW all of which were higher than G9. There were no statistical differences among the genotypes in terms of SDW yield (Tab. 3). G12, G8 and G4 were equal for main stem length, all of which were greater than G9 (Tab. 3). G8 had the highest number of secondary branches and tertiary branches of all the genotypes.
Table 3 Total dry weight (TDW), stem dry weight (SDW), leaf dry weight (LDW), secondary branches (number of secondary branches), tertiary branches (number tertiary branches) and length of main branch (main stem length) of stevia genotypes grown in the Alto Vale do Itajaí region. Rio do Sul (2016).
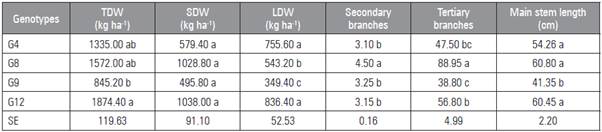
Means followed by different letters indicate significant statistical differences according to the Tukey test at (P≤0.05) (n=4). SE, standard error.
LDW yield becomes more relevant as glycosides are found in greater amounts in leaves (Jarma et al., 2010). LDW yields ranged from 349.40 kg ha-1 (G9) to 836.40 kg ha-1 (G12) with an overall mean of 621.15 kg ha-1. These yields were lower than those found by Hastoy et al. (2019), Parris et al. (2016), Serfaty et al. (2013) and Espita et al. (2009).
In evaluating the same genotypes used in this study, Francisco (2015) found LDW yields of 4031.8 (G9) and 3733.1 kg ha-1 (G12) in two harvests in the first year of cultivation. The lower yields found in this study could be explained by the genotype-environment interaction, where the photoperiod conditions observed by Francisco (2015) were favorable to genotype growth. Reduced yield is associated with the reduction of the vegetative cycle, which is caused by differences in seedling transplantation time (carried out in early December). The vegetative cycle in our study was 43 d shorter than the cycles of other studies, which affected the yields of the genotypes.
The seedlings of the stevia genotypes used in this study were produced by rooting branches. Stevia seedlings are typically produced from seeds (Lima Fiho, 2004). This enables the production and early transplanting of seedlings, which are more conducive to good crop growth (Ceunen and Geuns, 2013; Yoneda et al., 2017).
Late planting in this study reduced the crop growth period as a result of decreased photoperiod. As stevia is a short-day crop, it prematurely enters the reproductive phase, reducing the productive capacity of the plant (Ceunen and Geuns, 2013).
The variable LDW can also be influenced by planting density (Munz et al., 2018). The higher yields found by Daza et al. (2015), >3,500 kg ha-1 and Espita et al. (2009), 1378 kg ha-1, were a result of the use of more adapted genotypes and plant populations. The highest LDW yield found in G12 was associated with the highest LAI (Tab. 4), and there was a positive correlation between the variables (Tab. 5). A higher LAI increases the interception of photosynthetically active radiation and stimulates crop growth and photo-assimilate production (Kumar et al., 2014).
Table 4 Total leaf area (TLA), leaf area index (LAI), leaf area ratio (LAR), specific leaf area (SLA) and leaf weight ratio (LWR) of stevia genotypes grown in the Alto Vale do Itajaí region. Rio do Sul, 2016.
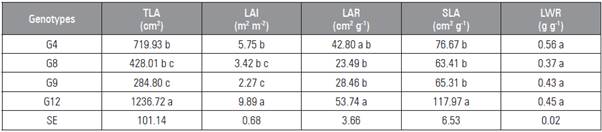
Means followed by different letters indicate significant statistical differences according to the Tukey test at (P≤0.05) (n=4). SE, standard error.
Table 5 Correlations between dry weight yield and growth of stevia genotypes.

NS = not significant; ** significant correlation at 1%.
Leaf dry weight (LDW), number secondary branches (secondary branches), number tertiary branches (tertiary branches), total leaf area (TLA), leaf area index (LAI), leaf area ratio (LAR), specific leaf area (SLA), rebaudioside A content (Reb A).
The TDW was influenced by LDW yield, with a positive but not significant correlation between the variables (Tab 5). G9 had a TDW yield of 845.20 kg ha-1, which was equal to G8 and G4, but lower than G12 (Tab. 3). These values are explained by the reduced TLA and LAI of the genotypes (Tab. 4).
There was a low correlation between the LDW yield and number of branches, with a negative, non-significant correlation between the LDW and number of secondary branches (Tab. 5). G8 had the highest number of lateral branches of all the genotypes (Tab. 3). According to Pal et al. (2015), the number of branches is associated with a longer growth period of the root system, where cytokines produced at the root apices and radicles stimulate lateral branches.
G8 had a longer production cycle than the other genotypes, and the harvest time occurred at 85 d after transplanting, which was also observed by Francisco (2015). G8, grown in the region of Curitiba, showed harvest conditions 121 d after transplanting (Francisco, 2015).
G12 (Tab. 4) showed the highest TLA, LAI and SLA of all the genotypes and an LAR equal to that of G4, and no differences for LWR were found among genotypes in the means separation test; a similar behavior was found by Francisco (2015). The highest TLA value in G12 was due to the highest LDW value, and there was a high correlation between LDW yield and TLA (Tab. 5).
According to Ceunen and Geuns (2013), LDW yield is directly influenced by the duration of the photo-period. Longer photoperiods promote greater leaf expansion. An increase in leaf expansion favors total photosynthetic potential, promotes increased production of photoassimilates, and facilitates the partitioning of dry weight to other plant organs.
The genotypes assessed in this study were subjected to the same photoperiod. There was a decreasing photoperiod during the experiment period (Tab. 1), which, according to Francisco (2015) and Ceunen and Geuns (2013), is not favorable for the growth of stevia.
LAI is important for assessing plant response to different environmental conditions. According to Watson (1947), LAI is the unilateral total area of leaf tissue per unit surface area of soil. The genotypes presented distinct LAI values, ranging from 2.27 to 9.89 (m2 m-2). These values are close to those found by Francisco (2015), which ranged from 3.51 to 7.01 (m2 m-2). A high LAI is desirable and shows a higher trend in leaf production, soil coverage and capacity to compete for light with weeds (Francisco, 2015). The LAI showed a high correlation with the LDW, which was also observed by Francisco (2015). G12 presented a higher LDW and TLA yield, and consequently a higher LAI.
According to Magalhães (1979), LAR is a measure of the size of the photoassimilatory apparatus and serves as a variable to assess the effects of genotype, climate and management. G12 and G4 need a larger leaf area to synthesize 1 g of DW (Tab. 4). Francisco (2015) reported that genotypes with a low LAR may be associated with genotypes with a higher potential for stevioside and rebaudioside A yield. Thus, G9 and G8 showed a higher photosynthetic efficiency compared to other genotypes (Tab. 4). The high LAR values in G12 and G4 are explained by the high TLA, which influences SLA, and increased SDW yield, showing a high correlation with TDW (Tab. 4).
SLA is the ratio of leaf area to LDW. According to Poorter and Garnier (1999), it is an important physiological index representing leaf biomass allocation per unit of area. SLA is important for evaluating stevia genotypes because it represents the efficiency in synthesizing LDW, and the leaves present a higher concentrations of stevioside and rebaudioside A (Jarma et al., 2010). G12 had the highest SLA value of all the genotypes (Tab. 4), which demonstrates that G12 had an increase in the expansion of the surface of the leaf blade, providing the development of thinner and more slender leaves. In our study, the SLA values were lower than those found by Francisco (2015), where values ranged from 10.82 to 17.37 m2 kg-1. These values are explained by the longer growth period in Francisco's study (2015).
G12 had a higher TLA. Plants with a higher TLA tend to promote shading of the lower canopy leaves. Under conditions of low solar radiation, plants use photoassimilates and other nutrients to increase leaf area, resulting in an increased SLA (Lambers et al., 2008).
According to Magalhães (1979), LWR is important to studying the performance of a cultivar. At the beginning of vegetative growth, plants consist of a large part of leaves, and LWR values are high. However, this ratio decreases over time as the plant develops, and other parts grow at the expense of material imported from plant leaves. There were no differences in the LWR among the genotypes (Tab. 4).
Stevioside and rebaudioside A yield
G12 showed the highest stevioside content and yield (Tab. 6). In terms of rebaudioside A, G8 was equal to G9, both of which were higher than the other genotypes (Tab. 6). G8 had the highest Reb A: St ratio and rebaudioside A yield (Reb A kg ha-1).
Table 6 Result of the comparison of means for the variables associated with the accumulation of glycosides stevioside and rebaudioside A contents.
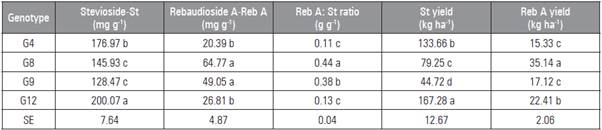
Means followed by different letters indicate significant statistical differences according to the Tukey test at (P≤0.05) (n=4). SE: Standard error. The results of the stevioside content (Tab. 6) ranged from 128.47 mg g-1 (12.8%) in G9 to 200.07 mg g-1 (20%) in G12. These values were consistent with Francisco (2015) (stevioside content of 12% in G9 and 14.2% in G12). The stevioside content and yield were highly correlated with LDW (Tab. 7). According to Francisco (2015), genotypes that present a high LDW yield also present a high stevioside yield.
LDW is influenced by the photoperiod (Ceunen and Geuns, 2013). Under increasing photoperiod conditions, stevia exhibits an increased LDW accumulation (Ceunen and Geuns, 2013). The genotypes in this study were exposed to a decreasing photoperiod, which indicates that the differences were associated with genetic differences.
The rebaudioside A content in G8 and G9 was equal and higher than those found in the other genotypes (Tab. 6). The values ranged from 20.39 mg g-1 (2.03%) in G4 to 64.77 mg g-1 (6.47 %) in G8, which were lower than those of Francisco (2015).
The differences between our results and those of Francisco (2015) regarding rebaudioside A content are explained by the reduction of the crop cycle. Francisco (2015) reported that the genotypes showed a 27.9% reduction in stevioside accumulation and a 36.6% reduction in rebaudioside A accumulation under decreasing photoperiod conditions.
The correlation analysis between the morphophysiological characteristics and yield components of stevioside and rebaudioside A showed that the morphophysiological variables showed a high correlation with the stevioside content and yield, while the rebaudioside A content, Reb A: St ratio and rebaudioside A yield were negatively correlated with the LDW TLA, LAI, SLA and LAR (Tab. 7).
Table 7 Correlations between growth variables with stevioside and rebaudioside A yield and content.
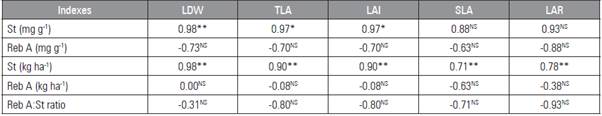
** Significant correlation at 1%, * significant correlation at 5%, NS not significant.
Leaf dry weight (LDW), total leaf area (TLA), leaf area index (LAI), specific leaf area (SLA), leaf area ratio (LAR), stevioside content (St mg g-1), rebaudioside A content (Reb A mg g-1), stevioside yield (St kg ha-1), rebaudioside A yield (Reb A kg ha-1), rebaudioside A: stevioside ratio (Reb A: St ratio).
The low rebaudioside A yield had a negative correlation with the LDW and TLA, LAI, SLA and LAR (Tab. 7). This negative correlation may explain the lower production of rebaudioside A in genotypes with higher growth rates. According to Bondarev et al. (2010), the smaller leaves in stevia present an increased density of glandular trichomes and, consequently, a higher rebaudioside A content.
The reb A: St ratio is important for selecting stevia genotypes. According to Mota et al. (2011), the ideal Reb A: St ratio for industrial use is 1. The genotypes did not show the desired Reb A: St ratio. G8 had the best Reb A: St ratio of all the genotypes (Tab. 6). The ratios found in this study were lower than those observed by Francisco (2015), Tavarini et al. (2015) and Mandal et al. (2013).
G12 showed the highest stevioside yield (Tab. 6). Genotypes with a higher LDW yield and higher secondary metabolite concentration (Tavarini et al., 2015; Vasilakoglou et al., 2016) tend to have better stevioside yield. There is a strong correlation between LDW yield and TLA, LAI, SLA and LAR (Tab. 7) for stevioside yield.
CONCLUSIONS
The G8 genotype had the highest rebaudioside A content, the highest rebaudioside A yield and the best rebaudioside A: stevioside ratio under the productive conditions with a decreasing photoperiod in the Alto Vale do Itajaí region (SC).
The G12 genotype showed the best growth rate, morphophysiological indexes, stevioside content and yield.
No genotype evaluated in this study had a rebaudioside A: stevioside ratio that was suitable for industry requirements.


