


 English (pdf)
 Article in xml format
 Article references
 Send this article by e-mail
 Cited by SciELO
  Cited by Google
  Similars in
SciELO
Similars in
SciELO  Similars in Google
 Permalink
INTRODUCTION
Lettuce is a leafy green vegetable in the Asteraceae family, consumed as raw salads, broths, and soups, that has high vitamin and mineral contents and few calories (Ntsoane et al., 2016). In Brazil, lettuce production has economic and social importance, generating jobs and income for family agriculture (Andriolo, 2017).
Since lettuce originated from a temperate climate, temperatures above 30°C induce flowering, reducing the vegetative phase and number of leaves and affecting the formation of compact heads. The optimum temperature for this crop varies between 15.5 and 18.3°C, with a minimum of 7.2°C and a maximum of 23.9°C (Maynard and Hochmuth, 2007). Genetic improvement techniques have developed cultivars that are tolerant to early bolting with extended cultivation in other seasons and sites.
Lettuce cultivars are classified into groups according to the morphological characteristics of the leaves, head shape, and color, such as iceberg, looseleaf (lollo and oakleaf), butterhead, romaine, and others (Sala and Costa, 2012). The selection of cultivars adapted to the climatic conditions and the crop growing system are determining factors for production success. In addition, in protected environments, during the summer (December to March) in Rio Grande do Sul, high temperatures still affect the quality and palatability of lettuce leaves.
Nonlinear models are widely used in agricultural research (Archontoulis and Miguez, 2015). To describe the growth of plants and fruits, the accumulation of matter over time must be measured. Nonlinear models are important for the proper management and improvement of research methodologies related to lettuce (Terra et al., 2010). These tools evaluate the growth rate, stabilization, and reduction of production at the end of the cycle (Mischan and Pinho, 2014).
Empirical models are often used to estimate plant growth and their components, including the logistic model. These model have already been applied to describe the dry matter accumulation in Allium sativum (Reis et al., 2014), production of strawberry cultivars (Diel et al., 2018), production of tomato genotypes (Sari et al., 2019), production of Cucurbita pepo and Capiscum annuum (Lúcio et al., 2015), growth of coffee cultivar Rubi MG 1192 (Pereira et al., 2014), morphological characters of Crotalaria juncea (Bem et al., 2017), and growth of green dwarf coconut (Prado et al., 2013), cacao (Muniz et al., 2017), and Asian pear (Ribeiro et al., 2018).
For lettuce, the Gompertz, logistic, and Expolinear models were fit to the leaf dry matter of cultivars Grand Rapids, Regina, and Great Lakes in a hydroponic system in summer (Lyra et al., 2003). Studies were also carried out to analyze the growth of lettuce, variety Batavia, in saline soils, using the logistic model (Carranza et al., 2009). However, studies that describe growth using nonlinear models for other cultivars, traits, and goodness-of-fit measures were not found.
The objectives of this study were to adjust the logistic model to fit the leaf and shoot fresh and dry matter of four lettuce cultivars (Crocantela, Elisa, Rubinela, and Vera) and to describe the growth of these cultivars in summer.
MATERIALS AND METHODS
Two experiments on the lettuce crop were carried out, one in the summer of 2017 (experiment 1) and the other in the summer of 2018 (experiment 2) in Santa Maria-RS (Brazil) (29º42' S, 53º49' W and 95 m altitude) in a protected environment, of the rain shelter type. The climate of the region is humid subtropical Cfa, with hot summers and an undefined dry season, according to the Köppen classification (Alvares et al., 2013).
The evaluated cultivars were: Crocantela (iceberg - green leaves, consistent, crisp, loose, prominent ribs, non-heading); Elisa (butterhead - delicate leaves - loosely-formed head); Rubinela (lollo, loose purple leaves, non-heading), and Vera (lollo - green crisp - consistent, loose leaves, and non-heading). The selection of the genetic material was based on the meteorological characteristics of the cultivation site during the crop cycle and the seed companies' recommendations. Seedlings were produced in 200-cell expanded polystyrene trays filled with commercial Plantmax® substrate in a floating system. Plants with four to five leaves were transplanted on 01/27/2017 (experiment 1) and 09/02/2018 (experiment 2).
The plants were grown on six benches made of corrugated fiber cement sheets, 3.66 m long, 1.10 m wide, 6 mm thick, with six troughs with a depth of 5 cm. The culture channels were waterproofed with 100 μm-thick, clear plastic film and filled with number two washed gravel. The troughs were covered with clear, 100-μm-thick plastic film and filled with number two.washed gravel The benches were raised (0.85 m) on fixed masonry blocks at both ends with a 2% slope. This slope allowed the nutrient solution to return to the 500 L plastic storage tank. The solution was pumped by a low-power submersible motor pump (with a timer) to a PVC pipe (25 mm diameter). This pipe had four drip hoses with pots placed under the drippers at a distance of 30 cm between plants in a row, with a plant density of 11.11 m-2. Each bench had four rows, totaling 44, with 3 L volume pots (11 pots per row) filled with washed sieved coarse sand with 0 dS m-1 electrical conductivity.
The macronutrient composition of the nutrient solution was as follows (mmol L-1): 10.36 NO3 -; 1.0 H2PO4 -; 3.36 NH4 +; 1.0 SO4; 4.0 de K+; 2.0 Ca2+; and 1.0 Mg2+; and the micronutrients were (mg L-1): 1.0 Fe; 0.50 Mn; 0.22 Zn; 0.26 B; 0.06 Cu, and 0.03 Mo. The electrical conductivity (EC) was maintained at 1.33 dS m-1 , and the pH was between 5.5 and 6.5 in both experiments. The EC and pH were monitored during cultivation and corrected when they presented a variation of 20%, higher or lower, in relation to the standard EC and pH.
Seven days after transplantation, evaluations started with eight plants of each cultivar. Then, the evaluations took place every 4 d until the beginning of flowering. Ten evaluations were performed for the two experiments, totaling 80 plants of each cultivar, except for cultivar Elisa in experiment 1, which had 64 plants assessed in eight evaluations. There were 624 plants analyzed in the two experiments for the four cultivars. The fresh leaf matter (FLM, in g/plant), dry leaf matter (DLM, in g/plant), fresh shoot matter (FSM, in g/plant), and dry shoot matter (DSM, in g/plant) were determined in these plants. To obtain the dry matter, the material was packed into paper bags and incubated in a forced circulation oven (60ºC ±5ºC) to constant matter.
The data on the indoor air temperature were recorded every three hours with a digital data logger (0.1°C resolution and 0.5°C accuracy) installed in a weather-proof shelter. With the data, the daily thermal sum was calculated with the method of Gilmore and Rogers (1958) and Arnold (1959), using equations (1) and (2)

where, Tmax is maximum daily temperature, ºC; Tmin is the daily minimum temperature, ºC; and Tb is the lettuce base temperature = 10ºC (Brunini, 1976)

where ATS is accumulated thermal sum, and ∑ STd is the daily thermal sum.
The fitting of the logistic model to each trait (dependent variable), with the repetitions of each evaluation, as a function of the accumulated thermal sum (ATS) (independent variable) was performed using the least squares method and the iterative process of Gauss-Newton. The equation was:  where, yi is the i-th observation of the dependent variable with i = 1,2, ..., n; x
i
is the i-th observation of the independent variable; a is the asymptotic value; b is a location parameter important for maintaining the sigmoidal shape of the model; and c is associated with growth, indicating the growth rate.
where, yi is the i-th observation of the dependent variable with i = 1,2, ..., n; x
i
is the i-th observation of the independent variable; a is the asymptotic value; b is a location parameter important for maintaining the sigmoidal shape of the model; and c is associated with growth, indicating the growth rate.
The assumptions of normality, independence, and homogeneity of the errors were verified using the Shapiro-Wilk, Durbin-Watson, and Breusch-Pagan tests, respectively. Traits that did not meet the assumptions were Box-Cox transformed with the statistical software Action.
The lower and upper limits of the 95% confidence interval were calculated, and, using the criterion of overlapping of the confidence intervals, the estimates of the parameters (a, b and c) for each trait were compared between the experiments in each cultivar and between the cultivars in each experiment.
The goodness-of-fit of the model was assessed with an adjusted coefficient of determination (R 2 aj), in which the best fit is the one closest to 1, the Akaike Information Criterion (AIC) and the residual standard deviation (RSD), in which the best fit for both is the one closest to zero. The intrinsic nonlinearity (IN) and the parameter-effects nonlinearity (PE) were quantified based on the geometric concept of curvature (Bates and Watts, 1988). The inflection point (IP), the maximum acceleration point (MAP), and the maximum deceleration point (MDP) were calculated according to the equations described by Mischan and Pinho (2014). Inferences about plant growth were made from these critical points. The calculations were made using Microsoft Office Excel® applications and the software R (R Development Core Team, 2018).
RESULTS AND DISCUSSION
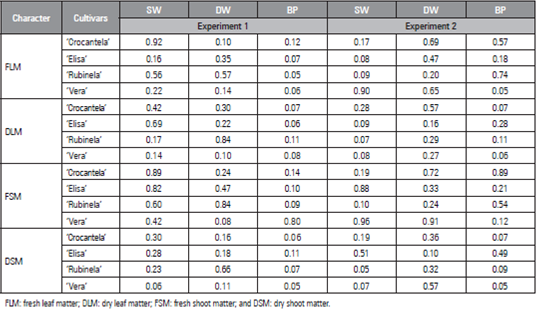
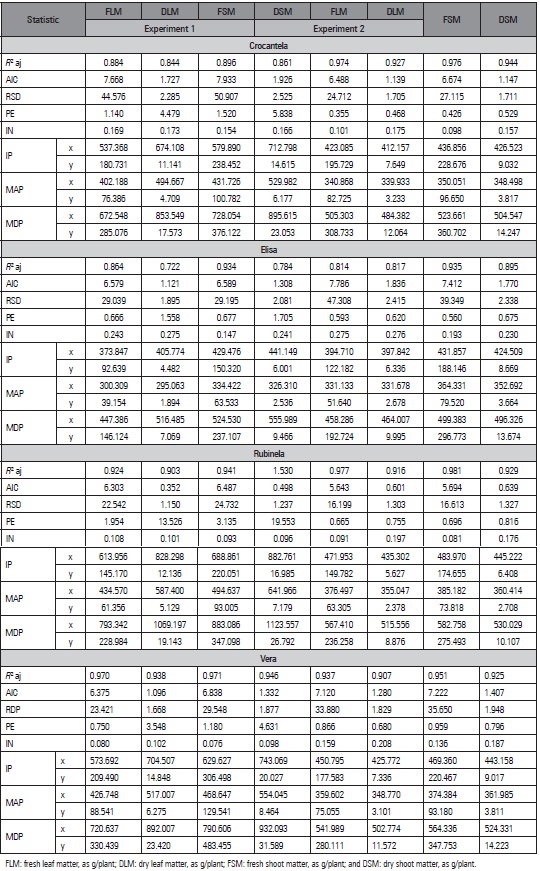
In both experiments, the Shapiro-Wilk, Durbin-Watson, and Breusch-Pagan tests had p-values greater than or equal to 0.05 (Tab. 1). Thus, the assumptions of normality, independence, and homogeneity of errors were met for the residuals of the model for the fresh and dry matter of the leaves and shoots of the lettuce cultivars. Similar results were found for a tomato crop, indicating that the estimation of the parameters with the method of ordinary least squares is adequate (Carini et al., 2019; Sari et al., 2019).
Table 1 P-value of the Shapiro-Wilk (SW), Durbin-Watson (DW), and Breusch-Pagan (BP) tests applied to Logistic residuals for characteristics as a function of cumulative thermal sum of four lettuce cultivars in two experiments.
For each trait of the logistic model, the estimates of the parameters (a, b, and c) were compared between the experiments (Tab. 2) and between the cultivars (Tab. 3) with the criterion of overlapping confidence intervals. As an illustration of the use of the criterion of overlapping 95% confidence intervals (CI), the DLM of cv. Crocantela was selected to compare the estimate of parameter a with the logistic model between experiments 1 and 2 (Tab. 2). The estimate of parameter a (361.4624) in experiment 1 was found to lie outside the confidence interval of the estimate of parameter a in experiment 2 (375.3193 to 407.5963). However, the estimate of parameter a (391.4578) in experiment 2 is within the confidence interval of the estimate of parameter a of experiment 1 (312.2015 to 410.7332). Thus when at least one of the estimates is within the CI of the other, the effect is non-significant. On the other hand, when two estimates lie outside the confidence interval, they differ between the experiments.
Table 2 Estimation of the parameters a, b, and c, lower limit (LL) and upper limit (UL) of the confidence interval (CI95%) of the logistic model for the traits as a function of accumulated thermal sum (in ºC) of lettuce cultivars (Crocantela, Elisa, Rubinela, and Vera) in two experiments in the summer.
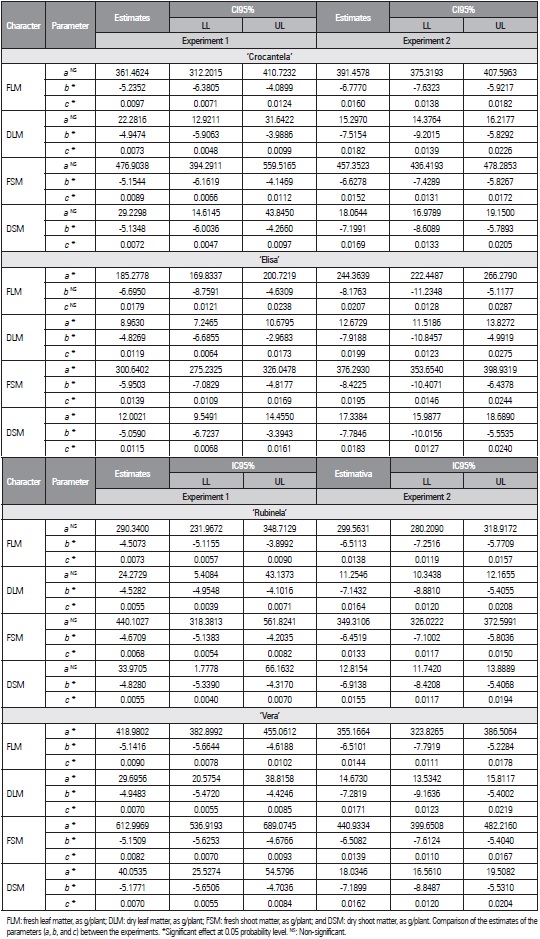
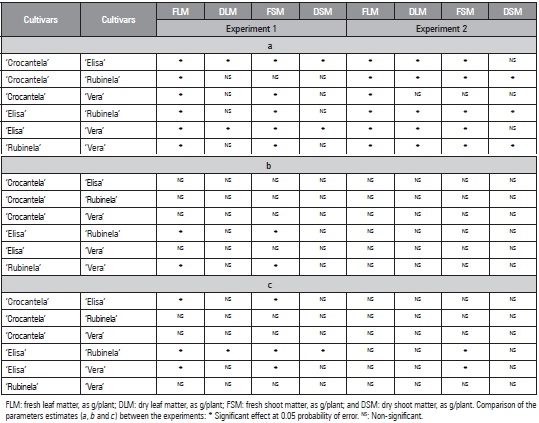
Table 3 Comparison of the estimates of the parameters (a, b, and c) of the logistic model for the traits as a function of the accumulated thermal sum, based on the confidence interval (CI95%) between lettuce cultivars (Crocantela, Elisa, Rubinela and Vera) in two experiments in the summer.
In the logistic model, the behavior of the estimates of parameter a of the cultivars Crocantela and Rubinela was the same, with asymptotic values that did not differ between all traits. The opposite behavior was found for parameters b and c, which were different between the experiments (Tab. 2). The traits DLM, FSM, and DSM of cv. Elisa showed differences for all parameters, and the asymptotic values in experiment 2 were higher than those in experiment 1, indicating that the plants had a greater fresh matter production in experiment 2. All traits of cv. Vera differed in relation to the parameters a, b, and c. These findings showed that the growth models were different between experiments 1 and 2. Different models were also selected for different experiments for the production of tomato genotypes (Sari et al., 2019).
The comparison between cultivars in each experiment showed that, for the logistic model, in experiment 1, the traits DLM, FSM and DSM did not differ between ‘Crocantela’ and ‘Rubinela’, and the traits DLM and DSM did not differ between ‘Crocantela’ and ‘Vera’ or between ‘Rubinela’ and ‘Vera’ (Tab. 3). In experiment 2, the estimates of DLM, FSM and DSM did not differ between ‘Crocantela’ and ‘Vera’, and DSM did not differ between ‘Crocantela’ and ‘Elisa’ or between ‘Elisa’ and ‘Vera’. The other comparisons showed a difference in at least one of the three parameters of the logistic model. Differences predominated for the logistic model, indicating the need for specific models for each trait and cultivar. Different models were also needed to describe production in Cucurbita pepo and Capsicum annuumm (Lúcio et al., 2015) and fruit production estimates in Lycopersicon esculentum var. cerasiforme (Lúcio et al., 2016).
Goodness-of-fit measures were used to determine the model that best fit the original data. The logistic model showed acceptable goodness-of-fit values (high R², low AIC, and intermediate RSD) that were close to each other (Tab. 4). Lyra et al. (2003) also reported high coefficients of determination but did not use other goodness-of-fit measures, which was seen as a limitation in the study.
Although the models showed satisfactory goodness-of-fit, a small overestimation occurred for the logistic model in ‘Rubinela’ in Experiment 1, with an asymptotic value of 440.1027 for FSM, and the maximum value of 368.30 g/plant was observed in the data set. The tendency for overestimations in the logistic model was also reported in the modeling of production during the formation of sugarcane (Batista et al., 2013). However the use of models to describe the accumulation of dry mass in garlic plant accessions did not present an overestimation of parameters for the Logistic model but did for the Brody, von Bertalanffy and Mitscherlich models (Puiatti et al., 2013).
Intrinsic nonlinearity (IN) and parameter-effects nonlinearity (PE) are used to help in the determination of the model. The logistic model presented reduced values of IN and PE for all traits, cultivars, and experiments (Tab. 4). The lower values of IN and PE indicated better suitability of the logistic model. These criteria were also adopted to indicate the most appropriate model to describe production in strawberries (Diel et al., 2018) and salad tomato genotypes (Sari et al., 2019).
Table 4 Coefficient of determination adjusted (R 2 aj), Akaike information criterion (AIC), residual standard deviation (RSD), intrinsic nonlinearity (IN), nonlinearity of the parameter effect (PE), inflection point (IP) , maximum acceleration point (MAP), and maximum deceleration point (MDP) of the Logistic model for characters as a function of the accumulated thermal sum (in °C) of lettuce cultivars (Crocantela, Elisa, Rubinela and Vera) in two experiments.
Analyzing the five goodness-of-fit measures (R 2, AIC, RSD, IN, and PE) showed that the logistic model was suitable for all traits and experiments for the cultivars Crocantela, Elisa, Rubinela, and Vera, and the most suitable for describing growth in lettuce cultivars. The cultivar Crocantela in experiment 2 served as example of the shape of the logistic growth curve and the respective critical points for each trait (Fig. 1).
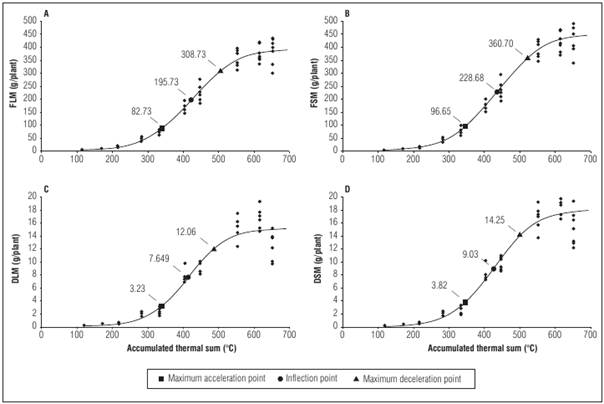
Figure 1 Logistic model plot for fresh leaf matter (FLM, as g/plant), dry leaf matter (DLM, as g/plant), fresh shoot matter (FSM, as g/plant), and dry shoot matter (DSM, as g/plant) as a function of the accumulated thermal sum (ATS, as °C) for the cultivar Crocantela in experiment 2
Critical points are used to describe crop growth (Tab. 4). The logistic model, for most of the cultivars in experiment 2, showed that the inflection point (IP) coincided with the plant stage closest to harvest, with the appearance of senescent outer leaves, which in practice is one of the criteria used for the commercial classification of the product. Also, the maximum acceleration point occurred at the beginning of the curve in experiment 2, with small plants still showing young leaves. In general, among the cultivars, cv. Elisa reached IP with the lowest ATS, independent of the experiment. However, ‘Rubinela’ required a greater accumulated thermal sum and showed lower values for the traits than the cultivars Vera (experiment 1) and Crocantela (experiment 2). These results indicate that the cultivars Vera and Crocantela were able to use the accumulated thermal sum efficiently. The maximum deceleration points (MDP) referred to the final growth stage of the cultivars, in which the crop was close to the beginning of flowering. Therefore, the inflection point is an alternative for future projections related to crop planning.
In this study, the logistic model described the growth of the lettuce satisfactorily in order to assist in the selection of promising cultivars. In addition, the logistic model was used to describe the growth curve of pruned coffee trees (Pereira et al., 2016), the accumulation of macronutrients in an onion crop (Pôrto et al., 2006), the production of strawberry cultivars from different seedling origins grown on organic substrates (Diel et al., 2018), the production of tomato genotypes (Sari et al., 2019), and the length, diameter, and matter of cocoa fruits (Muniz et al., 2017) and Asian pears (Ribeiro et al., 2018).
Simulation and prediction (parameters a, b, and c) can be used in the research or production of the cultivars Crocantela, Elisa, Rubinela, and Vera in summer. However, the thermal sum of the growing site should be used to achieve conditions close to the real ones. Therefore, these models are a reference for further research, and the obtained values should maintain the pattern of the growth curve.

