


 English (pdf)
 Article in xml format
 Article references
 Send this article by e-mail
 Cited by SciELO
  Cited by Google
  Similars in
SciELO
Similars in
SciELO  Similars in Google
 Permalink
INTRODUCTION
The cultivation of cape gooseberry (Physalis peruviana L.) is of great economic importance for Colombia since this species is the third most exported fruit, with a production of 16,109 t on 1,312 ha in 2018 (Agronet, 2020). This fruit is desirable because of its nutritional and medicinal characteristics, which make it an exotic fruit (Fischer and Melgarejo, 2020). Although most cape gooseberry crops belong to small farmers, export companies have decided to plant their own crops to obtain constant production to meet the market demands of this fruit (Fischer et al., 2014).
Fusarium oxysporum is the causal agent of vascular wilt in plants, and, in cape gooseberries, the incidence of this disease, caused by F. oxysporum f. sp. physali (Simbaqueba et al., 2018), generates great economic losses for farmers. Therefore, new pathogen-free areas are required (Villarreal-Navarrete et al., 2017). In 2014, F. oxysporum caused the greatest amount of economic damage to several agricultural crops when compared to other plant pathogens because of its large spatial distribution in Europe, the Middle East, North Africa (Shabani et al., 2014), the United States, Canada, Australia, Thailand, China, Colombia, Ecuador, Costa Rica, Panama, Brazil, Peru, and Argentina, especially in banana (Musa acuminata), tomato (Solanum lycopersicum) (McGovern, 2015), onion (Allium cepa) (Southwood et al., 2015) and ornamental crops (Gullino et al., 2015; Lecomte et al., 2016).
In Colombia, the planted area for cape gooseberry was 1,087 ha by 2009, with a yield of 17.78 t ha-1; however, in 2010, there was a decrease of 342.1 ha (Agronet, 2020) because of inadequate crop management, which generated a greater incidence and severity of vascular wilt caused by F. oxysporum f. sp. physali. F. oxysporum can survive up to 30 years under adverse conditions because of its particular survival structures known as chlamydospores. These structures germinate when in contact with the roots of plants, generating an appressorium that penetrates root cells and develops mycelium that reaches the vascular system (Cruz et al., 2012; Sharma et al., 2018; Zhang et al., 2018a). The mycelium spreads fast via xylem, producing microconidia that can rapidly invade the plant, generating vascular obstructions caused by hyphae that block the flow of water and nutrients (Ownley and Trigiano, 2016). In addition, the biotic stress caused by the pathogen infection impairs the plant physiology of diseased plants (Villarreal-Navarrete et al., 2017; Chaves-Gómez et al., 2020b). As a result, the visual alterations caused by the disease are chlorosis of the basal leaves, affecting later stages in the entire plant, followed by moderate to severe defoliation, and finally necrosis and death of the plant (Robles Carrión et al., 2014). Moreover, the relationship between inoculum density, early symptom appearance and disease severity has been found in other similar pathosystems (Hao et al., 2009; Caligiore et al., 2014).
Recent research has indicated that the use of optical sensors generates information for disease identification (Zhao et al., 2014; Sterling and Melgarejo, 2020), nutritional status of plants (Martínez and Ramos, 2015; Martínez, 2017) and specific site management of crops (Peng and Gitelson, 2011). Hyperspectral data can be used to identify stress symptoms at an early stage and can be correlated with plant characteristics to support timely decision-making processes in crop management (Lowe et al., 2017). Traditional methods to determine diseases require time to obtain results, which limits adequate decision-making in the field (Brizuela-Amador et al., 2007). On the other hand, spectroradiometric techniques are non-destructive and are based on the measurement of the spectral response of plants, which depends on factors such as phenological status, agronomic management and plant physiological parameters (Martínez, 2017; Thenkabail et al., 2000). A spectroradiometer measures reflectance at different wavelengths and provides information on the nutritional, health and water status of a crop, which can improve decision-making and management practices (Zarco-Tejada et al., 2004).
For plant diseases, mainly vascular wilts, the spectral responses of infected plants have been generated for only a low number of pathosystems, such as Capsicum annuum and Verticillium dahliae (Sanogo et al., 2008; Bauriegel and Herppich, 2014), Capsicum annuum - Fusarium spp. (Karadağ et al., 2019) and Solanum lycopersicum and F. oxysporum (Marín-Ortiz et al., 2020). Fusarium-diseased pepper (C. annuum) plants were detected with spectral reflections from leaves before symptoms became visible according to Karadağ et al. (2019). The potential to discriminate healthy from diseased plants before visible symptoms was also demonstrated in tomatoes by Marín-Ortiz et al. (2020), based on their spectral response at several wavelengths. Calderón et al. (2015) outlined an automatic procedure to classify plants infected by Verticillium dahliae in olive crops for large scale early detection. These studies contribute to the early detection of plant diseases caused by vascular pathogens. Nevertheless, crops, including the cape gooseberry, require new methods that adequately establish the presence of the pathogen that causes vascular wilt in the initial stages.
It was hypothesized that hyperspectral responses allow the detection of cape gooseberry plants affected by Fusarium vascular wilt independent of the inoculum density of the pathogen. Therefore, the objective of this study was to determine the hyperspectral responses of cape gooseberry plants inoculated with different F. oxysporum f. sp. physali propagule densities as the first step for evaluating the potential of non-invasive methods for the detection of disease under a variable inoculum pressure.
MATERIALS AND METHODS
Plant material and location
This experiment was carried out in 2016 with 2-month-old 'Colombia' ecotype cape gooseberry plants, which is the most cultivated plant material in the country (Álvarez-Herrera et al., 2019), acquired from the nursery at the Biosystems Center of the Jorge Tadeo Lozano University in Chia (Cundinamarca, Colombia). These plants were maintained in a nursery with daily drip irrigation and fertilization with a Hoagland solution.
The plants were moved to a plastic greenhouse in Bogota (2,556 m a.s.l., at 4°35'56'' N and 74°4'51'' W), with an average temperature of 18±8°C, relative humidity of 60-95% and a natural photoperiod of 12 h (with a light intensity of 66,694±10,981 Lux at full noon radiation); when the substrate moisture fell below field capacity, irrigation was applied approximately every 2 d for 3 weeks. Twenty-two days later, the plants were transplanted in 2.0-L pots that were previously disinfected with 2% NaClO, using a mixture of soil and rice husk at a 3:1 ratio (v/v) for the substrate. To ensure that the substrate was free of pathogens, it was autoclaved at a temperature of 121°C for 45 min based on the method proposed by Lagos et al. (2007). The plants were irrigated every 2 d with a nutrient solution at a concentration of 5 mL L-1 using the commercial product Nutriponic® (nitrogen 3.75% (nitric N 3.42%, ammoniacal N 0.34%); phosphorus 1.73%; potassium 4.29%; calcium 2.44%; magnesium 0.966%; sulfur 0.085%; iron 0.095%; manganese 0.009%; copper 0.001%; zinc 0.002%; boron 0.009%; molybdenum 0.0001%; cobalt 0.00003%; pH 5.8) (Walco S.A., Bogota, Colombia).
Experiment design and sampling
A completely randomized design with four replicates was used, where the treatments consisted of three F. oxysporum f. sp. physali inoculum densities (0, 1·103 and 1·106 conidia/mL). From each repetition, a plant was sampled by taking two leaves, one from the canopy and another from the lower part of the plant; the reflectance was measured at these two plant levels at 7, 14, 21 and 28 days after inoculation (DAI). On the same dates, samples were collected from four plants per treatment, in which the fresh weight was determined, and the leaf area was measured using a Li 3000A portable leaf area meter (LI-COR, Lincoln, NE).
Inoculation
For the inoculation of the cape gooseberry plants, the pathogenic isolate Map5 of Fusarium oxysporum f. sp. physali, which belongs to the fungal collection of the Molecular Microbiology Laboratory of Agrosavia (Mosquera, Colombia), was used as the source of inoculum. The Map5 isolate was cultured in 250 mL liquid medium of potato dextrose broth (Oxoid®) with constant agitation in an orbital shaker (Heidolph Instruments, Schwabach, Germany) at 125 rpm for 5 d at room temperature (25°C) under dark conditions. The plants were inoculated by root dipping (Gardner, 1989; Haglund, 1989) in 50 mL of the inoculum suspension for 10 min; the roots of the control plants were immersed in sterile distilled water.
Monitoring vascular wilt in cape gooseberry plants
To follow up on symptom development in each treatment, visual evaluations of plants were conducted at 0, 7, 10, 12, 14, 17, 19, 21, 24, 26, 28, 31, 33 and 35 DAI. The disease severity in the plants was assessed using the six-level scale proposed by Enciso-Rodríguez et al. (2013) that includes all possible disease expressions, ranging from level 0 for no symptoms to level 5 indicating plants with total turgor loss and dead plants. In addition, a scale was proposed to assess the disease in leaves (Fig. 1), taking into account the description of symptoms reported by Enciso-Rodríguez et al. (2013).
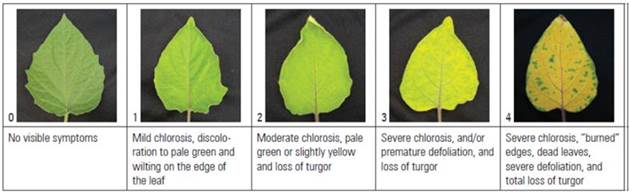
Figure 1. Proposed severity scale for the identification of leaf chlorosis caused by the vascular wilt produced by F. oxysporum f. sp. physali in cape gooseberry (P. peruviana) plants, adapted from16.
The intensity of the disease in each treatment was estimated by calculating the area under the disease progress curve (AUDPC) with the trapezoidal integration method (Campbell and Madden, 1990; Alves et al., 2017) using equation 1. In this study, the disease in the plants (AUDPC) and the leaves (AUDPCL) was determined considering the degree of severity that each plant and leaf showed during the evaluation time:
where, i = 1, T i = number of days between the inoculation and the sampling date, X i = the classification using the symptom scale and [T i + 1 - T i ] = time in days between two readings.
In addition, cross sections and isolates of the pathogen from the stems and root necks of the inoculated and control plants were performed at 7, 14, 21 and 28 DAI to confirm the presence or absence of the pathogen. Tissue samples were first washed with running water until all visible impurities were removed. Then, they were subjected to a disinfection process in 2% sodium hypochlorite for 45 s, immersion in 70% ethanol for 45 s, and finally washed three times in sterile distilled water. Subsequently, the samples were dried with sterile absorbent paper and cultured in potato dextrose agar medium (PDA) (Oxoid®) (Inoue et al., 2002; Leslie and Summerell, 2006). After incubation for 7 d at 25°C, the presence of mycelial growth and typical colonies of F. oxysporum f. sp. physali were evaluated to confirm the pathogen infection in each treatment.
Measurement of the hyperspectral response
In each replicate, two leaves per plant were sampled, one from the canopy and the other from the lower part of the plant. The reflectance of each leaf was measured with the leaf clip of the FieldSpec 4® spectroradiometer (Malvern Panalytical, Malvern, UK), which registers readings between 350 and 2,500 nm with spectral resolutions of 1.4 nm from 350 to 1,050 nm and 2 nm from 1,050 to 2,500 nm. The leaf clip was used with the plant probe to collect spectra on live vegetation; it has a gentle trigger lock/release gripping system for holding the target sample in position without removing the leaf or inflicting damage. It uses an internal broad-spectrum halogen light source. Before reading the reflectance, the spectroradiometer was standardized to a white reference standard (Spectralon, Labsphere, North Sutton, NH) (ASD, 2012). Four scans were averaged per reflectance spectrum.
Based on the reflectance measurements, the spectral indices shown in table 1 were calculated. These indices were selected because they have performed well in previous studies, showing correlation with plant physiological parameters.
The physiology data and spectral indices were analyzed transversely for each sampled date and tested for normality with the Shapiro-Wilk test; some hyperspectral indices were transformed with Ln to fit a normal distribution. An ANOVA was performed to evaluate the effects of the treatments, and a Tukey test with a significance level of 0.05 was carried out. Pearson's correlation analysis was used to establish the relationships between the physiological variables and spectral indices. Statistical analyses were carried out with IBM SPSS STATISTICS 23 (International Business Machines Corporation, Armonk, NY).
Table 1 Evaluated spectral indices and red edge positions caused by vascular wilt in the leaves, produced by F. oxysporum f. sp. physali, of cape gooseberry (P. peruviana) plants.
| Indices | Normalized Difference Vegetation Index (NDVI) | Chlorophyll Red-Edge (ChRE) | Modified Chlorophyll Absorption Ratio Index (MCARI) | Blue/Green Index (BGI) | Simple Ratio (SR) | Zarco and Miller (ZM) |
| Description | Good indicator of nitrogen content, chlorophyll, biomass, LAI and yield. Also provides a medium estimate of plant water content | A very sensitive indicator of the red edge position and directly related to foliar chlorophyll concentration. The established index for non-invasive in-vivo chlorophyll determination | Generally, reflectance of 705 and 750 nm is more suitable for a chlorophyll content estimation; developed for chlorophyll content variations. A better indicator of LAI, when LAI < 6 | This index has very good relationships with the chlorophyll a and b contents (Cab), which are an indicator of plant stress and growth | This index was developed for chlorophyll content (Chl) assessments because (R550)-1 is directly proportional to Chl and enable Chl estimations in dark-green to yellow leaves | Has linear relationships with chlorophyll a (Ca), chlorophyll b (Cb), and Cab (indicator of plant stress and growth) |
| Reference | Katsoulas et al. (2016) | Gitelson et al. (1996) | Wu et al. (2008) | Zarco-Tejada et al. (2005) | Gitelson and Merzlyak (1997) | Zarco-Tejada et al. (2005) |
RESULTS AND DISCUSSION
The results of this experiment were analyzed but only the data obtained in the evaluations done at 7, 14 and 21 DAI are shown because, after 18 DAI, the cape gooseberry plants had already expressed severe visual symptoms of the disease.
Monitoring vascular wilt in cape gooseberry plants inoculated with Fusarium oxysporum
At 7 DAI, there were no symptoms of the disease in any of the treatments (Fig. 2). The evaluation of the disease indicated that, with the high inoculum density (1·106 conidia/mL), wilt symptoms appeared faster than in the other treatments; at 14 DAI, the plants of this treatment had a higher degree of disease severity, grade 1, characterized by mild chlorosis, dark green to light green leaves, interveinal chlorosis of leaves, slight turgor loss and more than 10% damage in the plant.
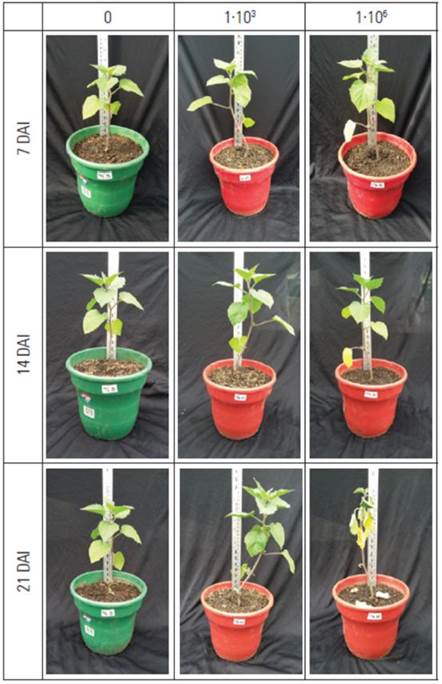
Figure 2. Development of vascular wilt severity in cape gooseberry (Physalis peruviana) 'Colombia' ecotype plants inoculated with three Fusarium oxysporum f. sp. physali densities: 0, 1·10 3 , 1·10 6 conidia/mL and kept under greenhouse conditions. DAI: days after inoculation.
The assessment of the pathogen colonization in stems and root necks of inoculated and control plants in PDA culture medium confirmed the presence of the pathogen in the sampled tissue of the inoculated plants. In this case, typical F. oxysporum colonies were obtained from the inoculated plants. No F. oxysporum colonies were isolated from the control plants at any of the conducted evaluations.
At 21 DAI, the treatment with 1·106 conidia/mL reached disease severity grade 4, and, at 26 DAI, mortality for most of the plants was observed. The inoculum density of 1·103 conidia/mL showed severity grade 1 starting at 17 DAI, and, at 21 DAI, the AUDPC value was 7.83 for the treatment under 1·103 conidia/mL. In contrast, the treatment with 1·106 conidia/mL had values of 29.16, which were significantly higher than the other treatments (Fig. 3A). Similar results were found by Villarreal-Navarrete et al. (2017) who reported that symptomatology was visually evident at 18 DAI in plants inoculated with F. oxysporum and subjected to a flood period.
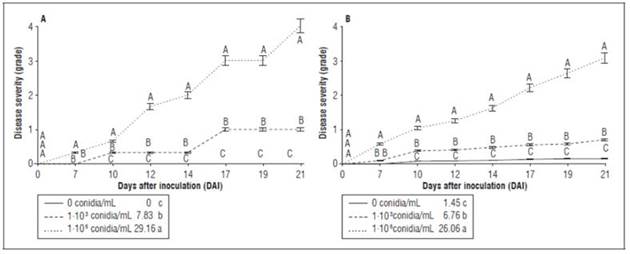
Figure 3. Disease severity of cape gooseberry (P. peruviana) plants inoculated with F. oxysporum f. sp. physali for a period of 21 DAI according to an adapted16severity scale. A, plants and B, leaves. The values next to the figure legend represent the area under the disease curve (A. AUDPC and B. AUDPCL) until 21 DAI for each treatment. Bars indicate the standard error. Means with different letters indicate significant differences according to the Tukey test (P≤0.05).
When evaluating the severity of each of the leaves, the degree of the disease was verified with the severity scale established for the experiment (Fig. 1). The 1·106 conidia/mL treatment showed significant differences from the other treatments starting at 7 DAI (Fig. 3B), with values of 26.06 for the AUDPCL at 21 DAI. Symptoms of the disease indicated a higher degree of the disease in the treatments with a high inoculum density, showing a severity grade of 2 at 17 DAI, which corresponded to mild chlorosis and loss of turgor. The treatments with a low conidial density had a AUDPCL value of 6.76 at 31 DAI. Although low chlorosis values were registered in the control plants (0.0 and 0.15) with the scale, this symptom was related to a greenery loss in lower leaves, due to the fact that no presence of F. oxysporum f. sp. physalis was confirmed in control plants in the laboratory test as mentioned before.
Spectral response in cape gooseberry plants inoculated with Fusarium oxysporum
The reflectance of the leaves at 14 and 21 DAI showed differences over a large part of the spectrum (Fig. 4A). At 14 DAI, in the visible spectrum (400-700 nm) (Fig. 4B), the reflectance had values between 0.1 for the treatments with a low pathogen density and without the pathogen and 0.32 for the treatment with 1·106 conidia/mL. This indicated that the energy that reaches the surface of leaves in this range of the spectrum is reflected in a higher proportion in plants inoculated with a high-density of inoculum. This effect is caused by physiological parameters that alter the absorption of light in cells (Taiz et al., 2015) as a result of pathogen infection in plants, which reduces the uptake of nutrients and water. Pathogens can induce physiological stresses and physical changes in plants, such as chlorosis, necrosis, abnormal growth, and dwarfism, among other alterations (Nutter and Gaunt, 1996; Ghaemi et al., 2011; Chávez-Arias et al., 2019; Cháves-Gómez et al., 2020a). These changes can alter the reflectance properties of plants (Qin et al., 2009; Mahlein et al., 2010; Karadağ et al., 2019; Marín-Ortiz et al., 2020). Naidu et al. (2009) found that grapevine cultivars affected by a leafroll-associated virus showed maximum difference in reflectance between healthy and diseased plants at 550 and 680 nm, and MacDonald et al. (2016) concluded that the use of hyperspectral imaging is useful for mapping diseased vines. Prabhakar et al. (2013) indicated that an increase in mosaic disease severity in black beans (Vigna mungo) caused a decrease in the relative chlorophyll content and the percentage of foliar nitrogen.
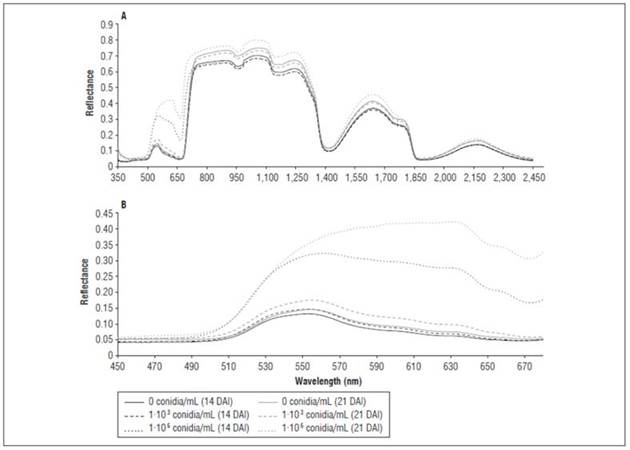
Figure 4 Average spectral response of cape gooseberry 'Colombia' ecotype plants inoculated with F. oxysporum f. sp. physali. A, range from 350 to 2,500 nm and B, range from 350 to 2,500 nm 14 and 21 DAI. n = 8 samples per treatment.
At 14 DAI, the plants inoculated with 1·106 conidia/mL had higher reflectance between 500 and 733 nm, with a peak at 551 nm, and a value of 0.31, while the other treatments had an average reflectance value of 0.14 (Fig. 4B). Bauriegel and Herppich (2014) found that, for a different disease, 550 to 560 nm is the optimal range for detecting fusariosis in spikes of Triticum sativum, while Bauriegel et al. (2011) indicated that this range lies between 665 and 675 nm. The reduction of the chlorophyll content in cells reduces the potential of the processes of remission and reabsorption of internal photons in the relevant wavelength range, causing photosynthetic processes that lead to a change in the red edge position (Zhang et al., 2018b).
The differences in the reflectance values, the near infrared (NIR), the visible range and the red edge at 14 DAI can be associated with stress caused by diseases in the plants between the control and the treatments that were inoculated with F. oxysporum f. sp. physali (Fig. 4A). Similar results have been reported in other soil plant pathogens, such as basal stipe rot, caused by the basidiomycete fungus Ganoderma boninense Pat in oil palm (Shafri et al., 2011; Ahmadi et al., 2017). Additionally, in a contrasting pathosystem, such as Fusarium culmorum infecting wheat spikes, Kang and Buchenauer (2000) stated that stress associated with the disease generates a rapid and irreversible degradation of chlorophyll as a result of the destruction of chloroplasts and gradual decomposition of organelles in plant cells.
At 21 DAI, the plants inoculated with 1·106 conidia/mL had higher reflectance than the other treatments between 500 and 1300 nm, and the effect of the 1·103 conidia/mL on reflectance was less intense (Fig. 4). The spectral indices were calculated with the reflectance data (Tab. 1). The indices that had a greater relationship with the AUDPC, for the follow-up of the vascular wilting and the growth of the plants, included SR, ZM, ChRE, NDVI and MCARI.
Although the SR and ZM indices showed a similar trend over time for all treatments (Fig. 5), significant differences were observed at 21 DAI, with values of 2.12 for SR and 1.09 for ZM in the high-density F. oxysporum f. sp. physali inoculum treatment (1·106 conidia/mL). These values were the lowest, followed by the low-density treatment of F. oxysporum f. sp. physali (1·103 conidia/mL), whose values were 4.07 and 2.01 for SR and ZM, respectively. On the other hand, the results of NDVI, ChRE and MCARI showed significant differences between the treatments, with values of 0.33, 1.99, 0.59, respectively, at 14 DAI (Fig. 5). These results confirmed that spectral vegetation indices are useful for the indirect detection of plant diseases, as reported by Mahlein et al. (2013) and Lu et al. (2017).
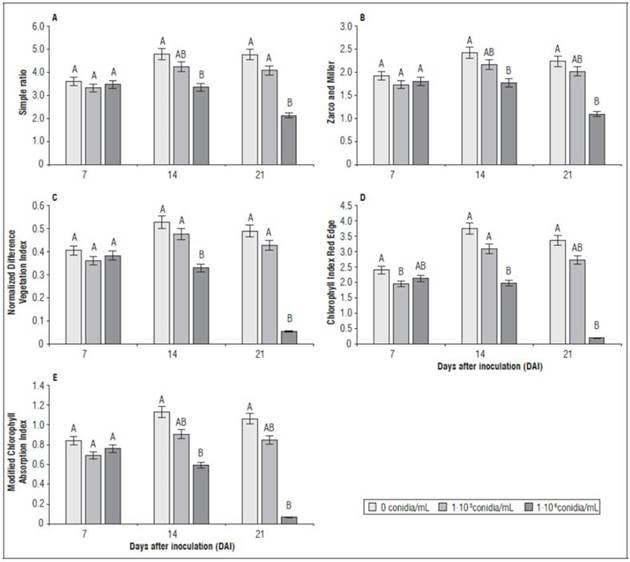
Figure 5. Spectral indices in cape gooseberry (P. peruviana) plants inoculated with different inoculum densities of F. oxysporum f. sp. physali 14 days after inoculation (DAI). A, simple ratio; B, Zarco and Miller; C, Normalized Difference Vegetation Index; D, Chlorophyll Index Red Edge and E, Modified Chlorophyll Absorption Index. Bars indicate the standard error. Means with different letters at each sampling point indicate significant differences according to the Tukey test (P≤0.05).
The indices described above were proposed to estimate the absorption of light by chlorophyll, which is most noticeable in the red spectrum (670 nm) (Lichtenthaler et al., 1996); in turn, Zhao et al. (2005) indicated that the nitrogen content in tissues is proportional to the reflectance in the near infrared region (NIR). Therefore, crops that are in better nutritional conditions, particularly nitrogen, will exhibit a higher content of this element in their leaves and will reflect higher values of the spectrum in this region.
Gitelson et al. (1996) found a strong relationship between the chlorophyll concentration of leaves and the reflectance coefficients (R750/R695 and R750/R700), which belong to the near infrared; this explains the behavior of this region of the spectrum during the development of the experiment because, the higher the radiation reflected in the NIR region, the higher the nitrogen contents in the plant are and the higher the index values are (Mistele and Schmidhalter, 2007). On the other hand, Sanogo et al. (2008) indicated that, in C. annuum plants affected by V. dahliae and subjected to flooding, an analysis of variance revealed significant main and interactive effects for the photochemical reactive index (PRI) and the AUDPC for plants under the two stresses. In this study, the spectral response of cape gooseberry plants 'Colombia' ecotype to vascular wilt caused by F. oxysporum f. sp. physali was obtained but additional studies are needed to characterize spectral responses to factors involved in water stress in order to differentiate pathogen-induced wilt from drought-induced wilt. Nevertheless, the indices calculated in the current study had a correlation >0.7 with the AUDPC and >0.8 with the AUDPCL, caused by F. oxysporum f. sp. physali (Tab. 2), indicating that indices evaluated from spectral responses can be used for the detection of this disease.
Table 2 Correlation coefficients established for spectral indices in cape gooseberry plants inoculated with F. oxysporum f. sp. physali 14 days after inoculation. * P≤0.05 ** P≤0.01.
| Variables | Leaf area | Fresh weight aerial part | AUDPC1 | AUDPCL2 |
|---|---|---|---|---|
| Leaf area | 1 | |||
| Fresh weight aerial part | 0.756 | 1 | ||
| AUDPC | -0.910* | -0.505 | 1 | |
| AUDPCL | -0.950** | -0.714 | 0.946** | 1 |
| NDVI | 0.860* | 0.982** | -0.624 | -0.798 |
| ChRE | 0.906* | 0.945** | -0.742 | -0.883* |
| MCARI | 0.900* | 0.942** | -0.737 | -0.882* |
| SR | 0.895* | 0.951** | -0.734 | -0.886* |
| ZM | 0.897* | 0.949** | -0.728 | -0.880* |
AUDPC, Area Under the Disease Progress Curve; AUDPCL, Area Under the Disease Progress Curve on Leaves; NDVI, Normalized Difference Vegetation Index; ChRE, Chlorophyll Index at the Edge of Red; MCARI, Modified Chlorophyll Absorption Index; SR, Simple ratio; ZM, Index of Zarco and Miller.
CONCLUSIONS
This research showed the potential of spectral responses in the study of the P. peruviana - F. oxysporum pathosystem and vascular wilt detection in cape gooseberry plants. The factor pathogen inoculum density showed significant differences between the treatments in the severity of the disease and the physiological and spectral response of the plants from the second sampling (14 DAI) as a result of the aggressiveness of the pathogen and susceptibility of the evaluated cape gooseberry ecotype. The spectral responses of the plants inoculated with F. oxysporum f. sp. physali registered significant differences from those in the control plants. These differences were mainly detected in the visible region of the spectrum, becoming more evident with time and according to the high inoculum densities to which the plants were exposed. The NDVI, ChRE, MCARI, SR and ZM spectral indices differentiated healthy plants from plants inoculated with the pathogen; in addition, they showed the highest correlation coefficients for the disease severity in the leaves and the physiological variables 14 days after inoculation.

