


 English (pdf)
 Article in xml format
 Article references
 Send this article by e-mail
 Cited by SciELO
  Cited by Google
  Similars in
SciELO
Similars in
SciELO  Similars in Google
 Permalink
INTRODUCTION
Plant growth is the result of interactions between photosynthesis, respiration, assimilated transport, hydric relationships, and mineral nutrition. It is defined as the irreversible increase in dry matter, volume, length, or area as a consequence of the division, differentiation, and expansion of cells. Development refers to the processes that determine changes in forms and behavior in individuals. Therefore, development involves processes of growth, differentiation and, morphogenesis (Fourcaud et al., 2008; Kutschera, 2019; Lambers et al., 1998; Larcher, 2003; Taiz et al., 2014). These processes are determined by genetics and external factors such as water availability, environmental temperature, and solar radiation (Marenco and Fernandes, 2009; Tekalign and Hammes, 2005).
Plant growth analysis has been widely used to study factors that influence plant growth, such as photo-assimilate accumulation over time (Gardner et al., 1985). This analysis uses a set of quantitative methods that describe and analyze the growth of plants and their organs. It uses data from direct measurements (weight, area, volume) that quantify and analyze growth with indexes based on models defined by mathematical functions (Hunt, 1982, 2003).
In the past, growth analyses used measurements taken over a long period of time using a large number of plants (Hendrik, 1989; Hunt, 1982). Then, the growth analysis approach was modified to use samples in a short period of time with a small number of plants; this approach is used to this day because the concept of growth has not changed (Oliveira et al., 2016). The functional analysis provides mathematical functions that describe plant growth (Hunt, 2003) using information obtained from dry weight and leaf area. Thus, these mathematical functions can be used to estimate the relative growth rate (RGR), crop growth rate (CGR), leaf area ratio (LAR), net assimilation rate (NAR), specific leaf area (SLA), leaf area index (LAI) and leaf area duration (LAD) (Hunt, 1982), which explain plant growth.
Some studies have described the growth and development of potato cultivars in Latin America. Santos (2010) evaluated diploid potato cultivars (Colombia, Latina, Guaneña, and Galeras) in two locations in Bogota. They found that ‘Guaneña’ reached the highest RGR at the beginning of the crop cycle and the highest NAR 35 days after emergence. Gaitán et al. (2013) studied tetraploid potato cultivars (Zipa, Única, Monserrate, and Morita). They found the maximum NAR values at 17 weeks after emergence, with an RGR that continuously decreased from planting until harvest, except for the Morita cultivar, which increased this physiological parameter until the 12th week, after which it decreased until harvest.
In Brazil, De Oliveira et al. (2000) studied a tetraploid cultivar (Aracy) with different irrigation levels. They found that RGR and NAR values decreased over time from planting to some days before harvest, when a small increase occurred. In Mexico, Aguilar et al. (2006) carried out a growth analysis of tetraploid cultivars (Milagros and Alpha) and adjusted the dry weights to polynomial models to mathematically describe the growth of the cultivars. Borrego et al. (2000) evaluated the tetraploid potato cultivars Snowden, Norteña, Mondial, Atlantic, Alpha, and Russett Burbank to determine differences between genotypes with growth analysis and reported that the NAR index is the most useful index for highlighting the advantages of a cultivar over others.
Condori et al. (2008) carried out an agrophysiological characterization of tuber-forming plants, including the tetraploid potato cultivars Luki, Alpha, and Waycha, and found no differences in the NAR and RGR values. They also noticed more efficient than other species, such as oca (Oxalis tuberosa), isaño (Tropaeolum tuberosum), and papalisa (Ullucus tuberosus).
The growth dynamic of diploid potato genotypes obtained with plant breeding has not been studied , so the present study was carried out. Because growth analysis is a useful tool for comparing cultivars in terms of physiological behavior, this study carried out a functional growth analysis of diploid potato cultivars in Colombia.
MATERIALS AND METHODS
Three consecutive growing seasons of the diploid potato cultivars Colombia, Latina, and Guaneña were evaluated in Medellin (Colombia). The experimental field was established in an area of 510 m2. The distance between plants was 0.30 m, and the distance between rows was 0.90 m. Thus, the plant density was 37,037 plants/ha. Detailed information about the experiment is given in table 1. According to the ecological conditions, the area was a lower tropical moist forest mountain life zone (Holdridge, 1967).
Diploid potato cultivars belong to the Phureja group. S. phureja cultivars are characterized by their short life cycle, short day adaptation, low or non-existent tuber dormancy, and diploid nature (2n = 2x = 24). S. phureja has a range of landraces widely grown in the Andes, from western Venezuela to central Bolivia, excellent culinary properties, and other traits, such as tolerance to Phytophthora infestans, making it very useful for developing modern cultivars (Machida-Hirano, 2015; Ovchinnikova et al., 2011).
Table 1 Detailed information about the experiments, location, treatments, measured growth variables, and weather variables.
| Parameter | Field experiments | ||
|---|---|---|---|
| 1 | 2 | 3 | |
| Location in Colombia | Medellin | Medellin | Medellin |
| Planting date | 2011-08-31 | 2012-01-05 | 2012-05-15 |
| Harvest date | 2011-12-18 | 2012-04-25 | 2012-09-01 |
| Latitude | 6.20810 | ||
| Longitude | -75.49950 | ||
| Altitude (m a.s.l.) | 2,575 | ||
| Cultivars | Colombia Latina Guaneña | ||
| Treatments | A. 778 kg ha-1 B. 260 kg ha-1 | ||
| Planting density (plants/ha) | 37,037 | ||
| Number of treatments | 6 | ||
| Repetitions | 5 | ||
| In-season sampling | 11 | 12 | 12 |
| Measured variablesa | RDW, TBDW, SDW, LDW, FLDW, FRDW | ||
| Soil textureb | LS | SL | LS |
| Cumulative rainfall during the growing season (mm) | 1,096 | 767 | 434 |
| Cumulative radiation during the growing season (MJ m-2) | 1,771 | 1,973 | 2,638 |
| Mean temperature during the growing season ((C) | 14.4 | 14.6 | 15.4 |
a RDW: root dry weight (kg ha-1). TBDW: tuber dry weight (kg ha-1). SDW: stem dry weight (kg ha-1). LDW: leaf dry weight (kg ha-1). FRDW: fruit dry weight (kg ha-1). FLDW: flower dry weight (kg ha-1).
bLM: loamy sand. SL: sandy loam.
Experiment design
A randomized block design with a factorial arrangement (3×2) was used during each growing season. The first factor corresponded to the three diploid potato cultivars, and the second factor was two fertilization levels: 7 and 21 g per planting site, representing 260 and 778 kg ha-1 of fertilizer. The fertilizer grade was 10-20-20-5 (N-P-K-S), and the high dose corresponded to the dose frequently used by farmers. The fertilizer was applied at sampling around the tuber seed and 20 d after emergence around the stem.
One plant was sampled weekly from each experiment unit. The evaluated variables included dry weights and total leaf area (TLA) with a Leaf Area Meter (LI-COR 3100). Each plant was dissected to measure the dry matter, separating each organ and packing them in paper bags. The plants were dried at 80(C until constant dry weight was obtained, and separated into leaves (DLW), stems (DSW), roots (DRW), stolons (DSTW), tubers (DTBW), flowers (DFW), fruits (DFRW) and total dry weight (TDW).
The developmental time was measured in terms of thermal time in accumulated degree-days (ADD). The methods followed to compute the thermal time were proposed by Rodríguez et al. (2012) with a threshold temperature of 2 and 29°C (Struik, 2007). The thermal time was computed based on information obtained with a WatchDog 2900ET weather station, which recorded the temperature every 15 min.
Statistical analysis
The Incomplete Gamma distribution model was used (Wood, 1967) (Eq. 1) because it is consistent with the modeling theory of crops based on models with delays (Gutierrez, 1996; Manetsch, 1976; Rodríguez, et al., 2011; Vansickle, 1977).
This model was linearized with Eq. 2:
A multilevel regression model with variable regression coefficients (Gelman and Hill, 2007) was considered from Wood's model for each treatment and trial to analyze the data, generating the following mixed model (Sorensen and Gianola, 2002) (Eq. 3):
where, (, (, and ( are the average regression coefficient vectors for each treatment; a, b and c are the deviation vectors for each trial of average regression coefficients; u is the vector of coefficients of error resulting from the effect of blocks within sampling and trial; ( is the vector of residual effects of the error;
Since the measurements of the variables were taken with the same individual, a multi-characteristic model was considered (Eq. 4):
It was assumed that vectors a, b, c, u and ( were normally distributed with zero mean and variance
where, I is an identity of a size, a is the number of variables to evaluate, n indicates the number of data of each variable i, also
The Bayesian estimation methodology for the previous model was used with the Gibbs algorithm, generating a Markov chain with a length of one million for each parameter. One sample was selected from each group of ten samples, and the first 10,000 were considered the burn-in period, which was removed. The MCMCglmm package (Hadfield 2010) from the R statistical environment (R Core Team, 2020) was used. To establish the existence of significant differences between the curves obtained for the leaf area and dry matter accumulation, a comparison of the Highest Posterior Density Interval was made of the fitted model for each cultivar at each level of fertilization. Each graph determined the statistical differences using 0.90 Highest Posterior Density Interval curves calculated with the CODA package (Plummer et al. 2006), and with the Bayes estimator the average marginal posterior distribution was obtained, this minimized the quadratic loss function.
The total dry weight (TDW) was determined (Eq. 6). Markov chain samples were used to obtain the original variables Eq. 7 (LA, DTW, DLW, DSW, DRW, DSTW, DTBW, DFW, DFRW) and the physiological parameters relative growth rate (RGR) (Eq. 8), net assimilation rate (NAR) (Eq. 9), leaf area ratio (LAR) (Eq. 10), specific leaf area (SLA) (Eq. 11) and fresh weight ratio (FWR) (Eq. 12).
RESULTS AND DISCUSSION
Leaf area accumulation
The ‘Guaneña’ cultivar had the greatest leaf area during the cycle with both fertilization doses. At 121.30 ADD in the low dose of fertilizer, it reached 4,827.69 cm2, and in high dose, at 947.83 ADD achieved the maximum value corresponding to 6,085.97 cm2. Most nutrition conditions allowed the plants to develop a higher number of leaves in a shorter time (Fig. 1).
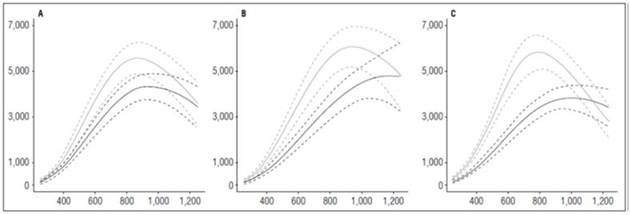
Figure 1 Leaf area growth curve in diploid potato cultivars (Solanum phureja Juz. et Buk.). The y-axis shows leaf area (LA) in cm 2 . The x-axis shows the thermal time in accumulated degree-days (ADD). The black line indicates the dose of 260 kg ha -1 , and the gray line indicates the dose of 778 kg ha -1 . The dotted lines of each color indicate the Highest Posterior Density Intervals of 0.90. A, ‘Colombia’; B. ‘Guaneña’; C, ‘Latina’.
The Latina and Colombia cultivars reached their highest leaf area values between 812.64 and 880.23 ADD with the highest fertilizer dose, with values of 5,838.80 and 5,567.65 cm2, respectively. Although these cultivars peaked before ‘Guaneña’, the values differ by almost 1,000 cm2, which, in terms of production, can generate differences in the ability of plants to capture the incident radiation and increase the production of assimilates that are reflected at the end of a cycle with increased yield.
The leaf area obtained in this study for the Colombia cultivar was lower than the value reported by Cabezas and Corchuelo (2005), who evaluated the same cultivar at three locations in Bogota, Colombia, under the effect of crop planting densities. At a 4.14 sites/m density, which is the density closest to the one used in this experiment, they obtained an average value for the three locations of 6,909.56 cm2 90 d after planting, when tuber maturation occurred. Santos (2010) found significant differences. The author reported maximum leaf area values at the end of the cycle that varied with the cultivar from 12,000 to 20,000 cm2/plant. These differences may have been due, in the first instance, to the highly contrasting ecological conditions under which the experiments were carried out and also the number of plants per unit area.
The curves that describe the leaf area behavior in this research showed an increase in the leaves to maximum formation. This condition decreased as the harvest approached and leaves were lost through natural causes because of the translocation of assimilates to the tubers and cultural practices (Montoya et al., 2016).
Dry matter accumulation
The accumulation of dry matter was notably influenced by biomass accumulation in the tubers, which, after 800 ADD, increased substantially until the end of the cycle, while the other organs stabilized their dry matter accumulation. The biomass accumulation in the leaves and flowers decreased when the tuber filling started (Fig. 2).
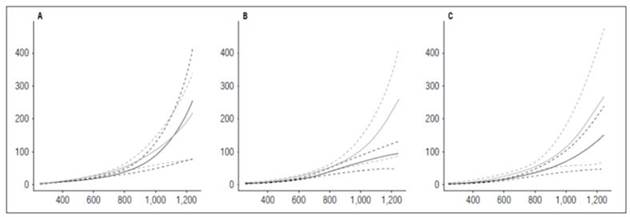
Figure 2 Total dry weight accumulated in diploid potato cultivars (Solanum phureja Juz. et Buk.). The y-axis shows the total dry weight (TDW) in g. The x-axis shows the thermal time in accumulated degree-days (ADD). The black line indicates the dose of 260 kg ha -1 , and the gray line indicates the dose of 778 kg ha -1 . The dotted lines of each color indicate the Highest Posterior Density Intervals of 0.90. A, ‘Colombia’; B ‘Guaneña’; C, ‘Latina’.
All cultivars reached the greatest accumulation of dry matter at 1,252 ADD, regardless of the fertilization dose. The maximum value was reached with ‘Latina’ (271.05 g), followed by ‘Guaneña’ (260.19 g) and ‘Colombia’ (221.07 g) with the highest fertilization dose.
The highest dry matter accumulation in the leaves was observed in ‘Guaneña’ (20.93 g) at 930.93 ADD with the highest fertilizer dose, followed by ‘Latina’ and ‘Colombia’, which reached a maximum of 19.21 g at 812.64 and 897.13 ADD, respectively. Guaneña was also the cultivar that accumulated the most dry matter in the leaves with the lowest fertilizer dose (16.77 g) at 1,116.81 ADD. When nutritional conditions are lower, the accumulation of dry matter is lower, and plants need more time to accumulate biomass. Less dry matter in leaves results in a smaller leaf area and lower production of photoassimilates for translocation to the organ of economic interest (Fig. 3).
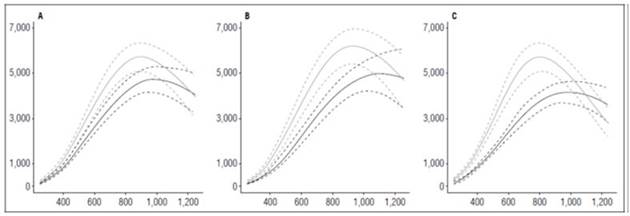
Figure 3 Leaf growth curves in diploid potato cultivars (Solanum phureja Juz. etBuk.) in terms of dry weight. The y-axis shows the leaf dry weight (LDW) in g. The x-axis shows the thermal time in accumulated degree-days (ADD). The black line indicates the dose of 260 kg ha -1 , and the gray line indicates the dose of 778 kg ha -1 . The dotted lines of each color indicate the Highest Posterior Density Intervals of 0.90. A, ‘Colombia’; B, ‘Guaneña’; C, ‘Latina’.
Unlike Solanum tuberosum L., which has a senescence period, diploid potato cultivars are kept alive until harvest. Therefore, at the end of the cycle, the accumulation curve increased and did not plateau like the results of Gaitán et al. (2013), who indicated that, at about 18 weeks after planting, the highest peak of total dry matter accumulation was reached in all four evaluated cultivars; afterwards, the buildup decreased until the end of the cycle and, in some cases, lost half the weight. Santos (2010) conducted a study at a lower altitude (2,572 m a.s.l.), and ‘Guaneña’ stood out because of its higher biomass accumulation in leaves. However, the maximum values obtained in this study were lower than the values obtained by this author, who obtained 53.8 g at 77 d after emergence.
As in the leaf dry matter accumulation curve, ‘Guaneña’ had the maximum value for stems (23.49 g) at 1218 ADD with the highest fertilization dose, followed by ‘Colombia’ and ‘Latina’, which reached their maximum dry matter accumulation in stems (19.51 and 17.16 g) at 1,133.71 and 1,015.42 ADD, respectively. The three cultivars with the lowest fertilization dose reached maximum dry matter accumulation in stems at 1,252 ADD; ‘Guaneña’ had the highest value (20.47 g), followed by ‘Colombia’ (20 g) and ‘Latina’ (17.16 g) (Fig. 4).
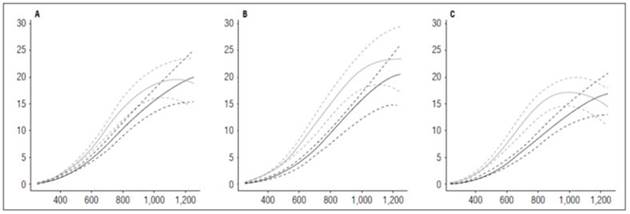
Figure 4 Stem growth curves of diploid potato cultivars (Solanum phureja Juz. et Buk.) in terms of dry weight. The y-axis shows the stem dry weight (SDW) in g. The x-axis shows the thermal time in accumulated degree-days (ADD). The black line indicates the dose of 260 kg ha -1 , and the gray line indicates the dose of 778 kg ha -1 . The dotted lines of each color indicate the Highest Posterior Density Intervals of 0.90. A, ‘Colombia’; B, ‘Guaneña’; C, ‘Latina’.
Santos (2010) reported higher values for the Guaneña cultivar than this study. This author reported a value of 72 g at 77 d after emergence, close to the peak for the cultivar Morita reported by Gaitán et al. (2013). Furthermore, Santos (2010) reported the highest dry matter accumulation in tubers for ‘Galeras’ (177.8 g) at 77 d after planting, followed by ‘Latina’ (153.3 g), ‘Guaneña’ (142.1 g), and ‘Colombia’ with 100 g.
The root system of potato plants is sparse and weak (Huamán, 1986), as evidenced in the dry matter accumulation in this organ by the cultivars in this study. The maximum accumulation achieved was 4.85 g in cultivar Guaneña. The maximum values accumulated in the Colombia and Latina cultivars were 4.53 and 3.92 g, respectively. All three materials reached these values at the end of the cycle at 1,252 ADD (Fig. 5).
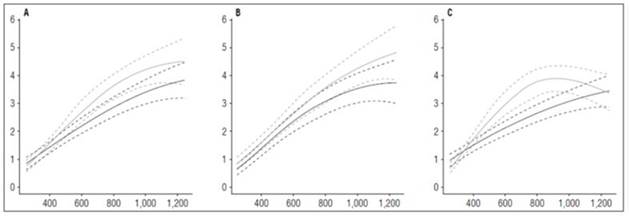
Figure 5 Root growth curves in diploid potato cultivars (Solanum phureja Juz. et Buk.) in terms of dry weight. The y-axis shows the root dry weight (RDW) in g. The x-axis shows the thermal time in accumulated degree-days (ADD). The black line indicates the dose of 260 kg ha -1 , and the gray line indicates the dose of 778 kg ha -1 . The dotted lines of each color indicate the Highest Posterior Density Intervals of 0.90. A, ‘Colombia’; B, ‘Guaneña’; C, ‘Latina’.
The stolon dry matter accumulation curve looked similar to the leaf curve, where it reached a peak of maximum accumulation and rate decreased to the end of the cycle because the tubers at that time have the largest filling capacity. The maximum dry matter accumulation was in ‘Colombia’ with 1.56 g at 964.72 ADD with the highest fertilizer dose per hectare, followed by ‘Latina’ and ‘Guaneña’ with 1.27 g and 0.94 g, respectively (Fig. 6).
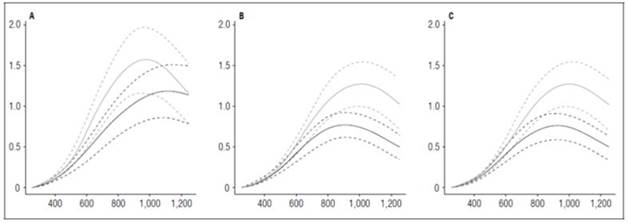
Figure 6 Stolon growth curves in diploid potato cultivars (Solanum phureja Juz. et Buk.) in terms of dry weight. The y-axis shows the stolon dry weight (STDW) in g. The x-axis shows the thermal time in accumulated degree-days ADD. The black line indicates the dose of 260 kg ha -1 , and the gray line indicates the dose of 778 kg ha -1 . The dotted lines of each color indicate the Highest Posterior Density Intervals of 0.90. A, ‘Colombia’; B, ‘Guaneña’; C, ‘Latina’.
Tubers are modified stems and are the storage organ in potato plants (Huamán, 1986). Therefore, the highest dry matter accumulation occurs in this organ, and it defines the final crop production. The three cultivars reached their highest dry matter accumulation in tubers at 1,252 ADD, where ‘Latina’ stood out with the highest value (237 g), followed by ‘Guaneña’ (201.22 g) and ‘Colombia’ (155.37 g) with the highest fertilizer dose. With the lowest fertilization dose, shallow maximum accumulation occurred in the Guaneña cultivar (35.21 g), which could mean that proper management of soil nutrients is required for this cultivar to achieve optimal tuber filling and good production (Fig. 7).
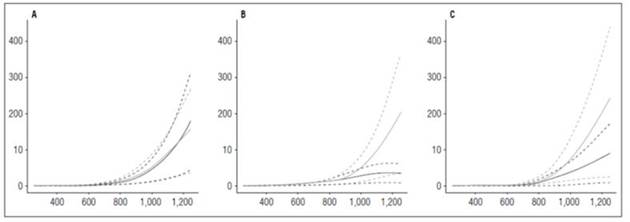
Figure 7 Tuber growth curves in potato cultivars (Solanum phureja Juz. et Buk.) in terms of dry weight. The y-axis shows tuber dry weight (TDW) in g. The x-axis shows the thermal time in accumulated degree-days (ADD). The black line indicates the dose of 260 kg ha -1 , and the gray line indicates the dose of 778 kg ha -1 . The dotted lines of each color indicate the Highest Posterior Density Intervals of 0.90. A, ‘Colombia’; B, ‘Guaneña’; C, ‘Latina’.
Relative growth rate and net assimilation rate
‘Latina’ presented a more accelerated development with the highest fertilization dose. Its RGR reached 0 value at 1,099.9 ADD, followed by ‘Colombia’ at 1,150.61 ADD. The cultivar Guaneña registered the lowest RGR value (0.00059 g g-1 ADD-1) at 1,252 ADD, at the end of the cycle. The fact that ‘Guaneña’ did not reach 0 during the crop cycle indicated that the plant would have continued growing if the crop had lasted longer. The cultivar ‘Guaneña’ showed greater precocity with the lowest fertilization, reaching the 0 value for RGR at 1,201.3 ADD. The cultivars Colombia and Latina reached minimum RGR values at 1,252 ADD, 0.000054 and 0.0033 g g-1 ADD-1, respectively, indicating that the plants were still growing at harvest (Fig. 8).
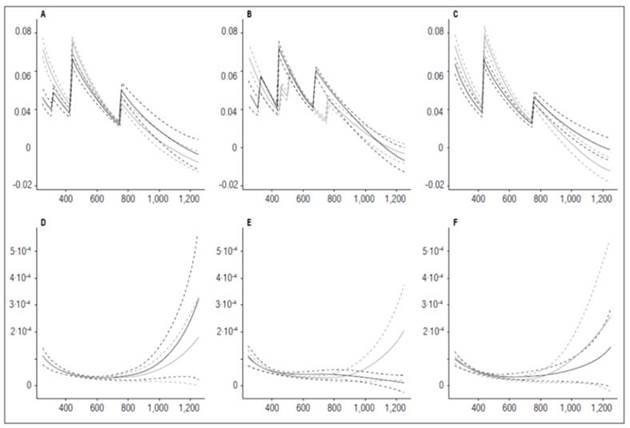
Figure 8 Relative Growth Rate (RGR) and Net Assimilation Rate (NAR) in potato cultivars (Solanum phureja Juz. et Buk.). The y-axis in figures A, B and C shows the RGR in g g -1 ADD -1 and in figures D, E and F shows the NAR in g cm -2 ADD -1 . The x-axis shows the thermal time in accumulated degree-days (ADD). The black line indicates the dose of 260 kg ha -1 , and the gray line indicates the dose of 778 kg ha -1 . The dotted lines of each color indicate the Highest Posterior Density Intervals of 0.90. A, RGR ‘Colombia’; B, RGR ‘Guaneña’; C, RGR ‘Latina’; D, NAR ‘Colombia’; E, NAR ‘Guaneña’; F, NAR ‘Latina’.
The behavior of RGR generally depends on the time of development of each organ. The peaks occurred at crucial moments, such as between 400 and 520 ADD, when the tuber initiation was recorded. Lower value peaks also take place later in the cycle, with fruit filling.
Hunt (2002) stated that RGR is a physiological parameter that can measure how fast plants grow. The Latina cultivar was more efficient with the highest fertilization dose at producing dry mass at 440.88 ADD, with a value of 0.078 g g-1 ADD-1. ‘Colombia’ had a rate of increase for dry weight that was close to the rate in ‘Latina’ (0.073 g g-1 ADD-1), while ‘Guaneña’ was faster at 255 ADD, with a dry matter increase of 0.063 g g-1 ADD-1. The Guaneña cultivar only reached its maximum RGR at the beginning of the growing season with the highest fertilization dose. However, this cultivar, with the lowest fertilization dose, reached the highest rate of increase in dry weight at 440.88 ADD, with a value of 0.069 g g-1 ADD-1, followed by ‘Colombia’ and ‘Latina’ (0.062 and 0.061 g g-1 ADD-1).
In all the cases, the RGR reached the lowest value when the NAR reached the highest values at 1,252 ADD, except for the Guaneña cultivar with the lowest fertilization dose, where the lowest RGR (-0.0034 g g-1 ADD-1) was achieved with the lowest NAR (0.000011 g cm-2 ADD-1) at 1,252 ADD.
With the lowest fertilizer dose, the Colombia cultivar had the highest NAR value (0.00032 g cm-2 ADD-1), followed by ‘Latina’ and ‘Guaneña’ with values of 0.00014 and 0.00010 g cm-2 ADD-1 , respectively. This behavior was different from the one with the highest fertilization dose, in which the Latina cultivar had the greatest NAR value (0.00025 g cm-2 ADD-1), followed by ‘Guaneña’ and ‘Latina’ (0.00020 and 0.00017 g cm-2 ADD-1), respectively.
‘Colombia’ and ‘Latina’ reached minimum NAR values under similar conditions. ‘Colombia’ obtained a NAR value of 0.000027 g cm-2 ADD-1 at 660.5 ADD with the lowest fertilizer dose, reaching the same value at 694.35 ADD with the highest dose. In the case of ‘Latina’, the maximum NAR values achieved are 0.00032 and 0.00017 g cm-2 ADD-1 under low and high dose, respectively.
‘Guaneña’ behaved like ‘Colombia’ and ‘Latina’ with the highest dose, i.e., it reached its minimum NAR value at 711.25 ADD (0.000026 g cm-2 ADD-1) and its maximum NAR value at 1,252 ADD (0.00020 g cm-2 ADD-1). However, at the lowest fertilization dose, the maximum NAR value (0.000010 g cm-2 ADD-1) occurred at 255 ADD. The photosynthetic capacity decreased until the end of the cycle, when it reached the minimum NAR value (0.000011 g cm-2 ADD-1). This behavior indicated that this cultivar defined production between 600 and 800 ADD. The falling NAR curve in the advanced stage of the crop indicated that the ability for photosynthesis was reduced.
The RGR results obtained in this study agree with Santos (2010), who reported that the highest RGR values were recorded in the early stages of the crop cycle, showing that the Colombia cultivar had the highest value, 0.85 g g-1 d-1, followed by Guaneña (0.27 g g-1 d-1) and Latina (0.12 g g-1 d-1), in the experiment located at a lower height above sea level. The behavior of this variable decreased until the end of the cycle, reporting minimum values of 0.0048, 0.017, 0.013 g g-1 d-1 for ‘Colombia’, ‘Latina’, and ‘Guaneña’, respectively. Gaitán et al. (2013), in a growth analysis of Monserrate, Unica, and Morita cultivars, reported that the RGR in the three cultivars reached high values in the early stages of development and that, over time, these values decreased until the end of the cycle, reaching values equal to 0 when NAR was maximum, coinciding with the results obtained in this analysis.
De Oliveira et al. (2000) also recorded high RGR values in cultivar Aracy at the start of the cycle, with a gradual decrease. In this cultivar, the maximum values fluctuated between 0.15 and 0.25 g g-1 d-1. In the growth analysis of Russet Burbank cultivar by Lynch and Rowberry (1977), similar results were obtained. The RGR decreased over time, becoming minimal when NAR was at its maximum.
The behavior of the NAR was similar in all three cultivars. It had a progressive decrease until about 600 ADD and continued its growth until the end of the cycle. The Guaneña cultivar had a decreased curve with the highest fertilization dose until 600 ADD, with a slight increase up to 800 ADD and a subsequent decrease. None of the cultivars reached negative NAR values. ‘Latina’ was the first to reach a value close to 0, corresponding to 0.000033 g cm-2 ADD-1 at 643.66 ADD with the lowest fertilizer dose and 0.000022 g cm-2 ADD-1 at 660.50 ADD with the highest fertilizer dose. In this case, the crop potential production was not defined in a certain period of the plant cycle.
Santos (2010) evaluated the same potato genotypes in two locations in Colombia. In both environments, in the initial stages of the crop cycle, values between 0.001 and 0.0014 g cm-2 d-1 were recorded. These values increased up to approximately half of the cycle at the low altitude location and descended at the end of the plant cycle. In the upper location, the increase and decrease in the NAR were not as evident as in the case of the other location. This behavior did not occur in this study because the agricultural and ecological characteristics under which the experiments occurred and were contrasted (Grime and Hunt, 1975), who argue that differences in the physiological behavior of the genotypes of the same species are determined by the geographical location of the experiments.
Meanwhile, in a study by De Oliveira et al. (2000), the Aracy cultivar had NAR values that were reduced over time, and, at the end of the cycle, when this cultivar started its senescence period, an increase occurred, as seen in this study, indicating that more photosynthetic activity and more biomass distribution and accumulation in tubers. This same behavior was presented by Ñústez et al. (2009) and Segura et al. (2006) with Esmeralda and Betina cultivars.
Condori et al. (2008) showed that that Luki and Waycha cultivars were more efficient in photosynthetic terms, with NAR values between 4.39 and 6.65 g cm-2 d-1, with no differences from other tuber plants. Aguilar et al. (2006) found the highest NAR values in the early stages of the cultivation, 0.008 and 0.009 g cm-2 - week in Alpha and Milagros cultivars, respectively, which eventually decreased.
Leaf area ratio, specific leaf area and fresh weight ratio
The LAR behavior in the three cultivars evaluated in this study was similar, recording values between 90 and 150 cm2 g-1 at the beginning of the crop cycle. The curve grew to a maximum value of 16 cm2 g-1 until 420 ADD and, after that, decreased steadily until the end of the cycle. LAR, as shown in figure 9, was directly influenced by the FWR component because their curves had the same tendency. This behavior indicated that the plantsresort to significant changes in the distribution of dry matter through the organs to maintain LAR. The SLA slightly influenced the LAR behavior only in the Colombia cultivar, leading to the conclusion that,, in addition to changes in the distribution of biomass to maintain LAR, the plants also resorts to small changes in the density of its leaves.
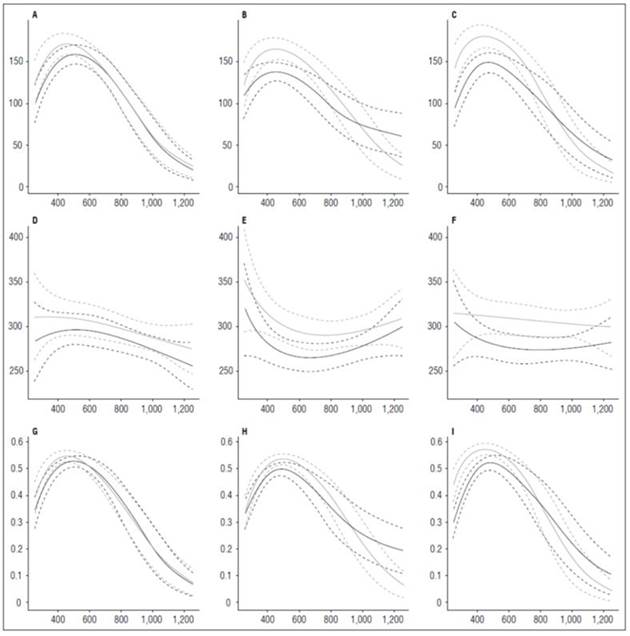
Figure 9 Leaf Area Ratio (LAR) and its components, Specific Leaf Area (SLA) and Fresh Weight Ratio (FWR) in potato cultivars (Solanum phureja Juz. et Buk.). The y-axis in figures A, B and C shows the LAR in cm 2 g -1 , in figures D, E and F shows the SLA in cm 2 g -1 and in figures G, H and I shows the FWR in g g -1 . The x-axis shows the thermal time in accumulated degree-days ADD. The black line indicates the dose of 260 kg ha -1 , and the gray line indicates the dose of 778 kg ha -1 . The dotted lines of each color indicate the Highest Posterior Density Intervals of 0.90. A, LAR ‘Colombia’; B, LAR ‘Guaneña’; C, LAR ‘Latina’; D, SLA ‘Colombia’; E, SLA ‘Guaneña’. F, SLA ‘Latina’; G, FWR ‘Colombia’; H, FWR ‘Guaneña’; I, FWR ‘Latina’.
CONCLUSION
The Guaneña and Latina cultivars had better performance than the ‘Colombia’ cultivar, according to their physiological capacity to produce biomass and growth. This indicates that, without downplaying ‘Colombia’, which is the leading parental cultivar, the fact that they are improved from Colombia cultivar provides them added value, in terms of growth and productivity.

