


![Heritability, genetic gain, and correlations in cowpea beans (Vigna unguiculata [L.] (Walp.)](/img/pt/next.gif)


 Inglês (pdf)
 Artigo em XML
 Referências do artigo
 Enviar este artigo por email
 Citado por SciELO
  Citado por Google
  Similares em
SciELO
Similares em
SciELO  Similares em Google
 Permalink
INTRODUCTION
The tomato historically went from being a merely ornamental plant to being one of the most important vegetables today in terms of consumption and production (Abdallah et al., 2016; Srinivas et al., 2019). In Colombia, production in 2019 was 556,692 t with a yield of 65,66 t ha-1 using a total area of 8,478 ha (Agronet, 2021; FAO, 2021). Currently, three genetic groups have been described: the wild ancestor S. pimpinellifolium, the transitional form S. lycopersicum var. cerasiforme, and the cultivated species S. lycopersicum var. lycopersicum (Casals et al., 2018).
The cherry tomato corresponds to the species Solanum lycopersicum var. cerasiforme, a botanical variety that is considered an ancestral form of cultivated tomatoes and that is found in the tropical and subtropical regions of the world. It is also known as cherry, pajarito or vagabundo (Medina and Lobo, 2001). All wild species related to tomatoes are native to the Andean region of Chile, Bolivia, Peru, Ecuador, and Colombia, including the Galapagos Islands. Wild species have broad adaptation to different environments because they grow at different altitudes, in narrow mountains geographically isolated from each other, and also adapt to specific microclimatic soil conditions (Flores-Hernández et al., 2017).
Nowadays, the cherry tomato has positioned itself gastronomically, not only as garnish but as an integral part of salads, sauces and cocktails (Machado et al., 2003). Colombia does not have production records because few areas cultivate this fruit. In other countries, some records report yields between 41 and 42 t ha-1 under semi-controlled conditions (Herrera, 2015).
The genotype×environment interaction (GEI) refers to the differential response of genotypes evaluated under different environmental conditions (Tonk et al., 2011) and involves environmental conditions (agroecological, climatic and agronomic) and all physiological and genetic factors that determine plant growth and development (Mohammadi et al., 2016; Wardofa et al., 2019). GEI is of great concern to plant breeders because a high interaction can reduce selection gains and make it difficult to identify superior cultivars. Measuring GEI is important to determining the optimal strategy to select genotypes adapted to specific environments (Nowosad et al., 2016).
Several methods have been used to evaluate the response of genotypes through the environment and the GxE interaction in agricultural experiments. Eberhart and Russell (1966) proposed a joint regression analysis to estimate the average performance of one genotype in different environments relative to the average performance of all genotypes in the same environment. The Principal Additive Effects and Multiplicative Interactions Model (AMMI) is the most widely used method because it considers genotypes and environments as additive and linear effects, facilitating studies using an analysis of variance (ANAVA), while GEI has multiplicative effects that can be analyzed with a Principal Component Analysis (Crossa et al., 1990).
The genotype-environment interaction and the phenotypic stability of tomatoes have been studied by several researchers, including Mandal et al. (2000), Panthee et al. (2012), Mohamed et al. (2013), Al-Aysh (2014), Zakher et al. (2016), and Shankar et al. (2017), among others.
The objective of this study was to evaluate the genotype-environment interaction of production characteristics in cherry tomatoes by applying the AMMI model to elucidate how genotypes respond to diverse natural and artificial environments for cherry tomatoes.
MATERIALS AND METHODS
Genetic material
Nine cherry tomato genotypes were evaluated from the Germplasm bank of the Universidad de Caldas, along with a commercial control called ‘Sweet Million’ (Tab. 1).
Table 1. Cherry tomato introductions used this study on the genotype-environment interaction.
| Genotype | Species | Origin |
|---|---|---|
| IAC1621 | T. cereja Alemán 12 | Brazil |
| IAC1624 | T. cereja | Brazil |
| IAC1688 | T."Lili"cereja | Brazil |
| IAC391 | T. red cherry | Brazil |
| IAC412 | Cherry tomato | Brazil |
| IAC426 | T. cherry Juliet | Brazil |
| IAC445 | T. cereja Jundiai | Brazil |
| LA2076 | Tomate cereza | California |
| LA2692 | Cherry tomato | Peru |
| Sweet Million | Solanum lycopersicum var. cerasiforme | Control |
*IAC: Introductions from the Agronomic Institute of Campinas, Campinas, Brazil.
**LA: Introductions from the Tomato Genetics Resources Center (TGRC), University of California-Davis.
Location
The trials were established in three natural environments: Montelindo and Tesorito farms belonging to the Universidad de Caldas, and the Experimental Center of the Universidad Nacional de Colombia, Palmira (CEUNP). Table 2 shows the general characteristics of each evaluation environment.
Table 2. General characteristics and soil nutrient levels at the test sites for estimating GxE interactions in cherry tomatoes.
| ID Farm | Montelindo farm | Centro Experimental CEUNP) | Tesorito farm |
|---|---|---|---|
| Location | Municipality of Palestina (Caldas) | Municipality of Candelaria (Valle del Cauca) | Manizales (Caldas) |
| Geographic coordinates | 5°04’ N, 75°45’ W | 3° 24 ΄ N, 76° 26 ΄ W | 5º 01΄47΄΄N, 75º 26΄03΄΄W |
| Elevation (m) | 1,030 | 980 | 2,340 |
| Mean precipitation (mm) | 2,200 | 1,009 | 2,000 |
| Average temperature (°C) | 23 | 24 | 17.5 |
| pH | 4.7 | 6.54 | 5.2 |
| Nitrogen (%) | 0.54 | 0.1 | 0.41 |
| Organic mat. (%) | 14.64 | 2.07 | 10.18 |
| Phosphorus (mg kg-1) | 21 | 227 | 125 |
| Potassium (cmol kg-1) | 0.29 | 0.66 | 0.97 |
| Calcium (cmol kg-1) | 0.82 | 13 | 4.74 |
| Magnesium (cmol kg-1) | 0.19 | 5.84 | 1.27 |
| Iron (mg kg-1) | 189 | 61.5 | 276 |
| Manganese (mg kg-1) | 13.43 | 69.8 | 10.44 |
| Zinc (mg kg-1) | 9.52 | 5.35 | 8.33 |
| Copper (mg kg-1) | 6.52 | 4.71 | 5.33 |
| Sulfur (mg kg-1) | 31.8 | 22.8 | 77.86 |
| Boron (mg kg-1) | 0.1 | 0.53 | 1.1 |
The introductions were planted in trays with 72 locules with peat-type substrate grade 3. The transplant was done 30 d later when the seedlings had four true leaves (Jaramillo et al., 2007).
Evaluated variables
The most important production characteristics for cherry tomatoes were evaluated, such as number of fruits per plant (NFT), average weight of the fruit (g) (AWF) and production/plant (kg/pl) (PFT).
Experiment design
The experiment design used randomized complete blocks with four blocks that used the blocking criterion potassium fertilization level (0, 60, 120, 180 kg ha-1), with the level 0 kg ha-1 reported for the soil.
On the Tesorito farm, the levels 0, 60, 120, 180 kg ha-1 of potassium were denominated environments T0K, T60K, T120K and T180K, respectively; likewise, on the Montelindo farm, conserving the same levels of potassium, the environments were named M0K, M60K, M120K and M180K, respectively; in addition, the Palmira environment was called PAL.
The effective size of the experiment unit was seven plants, of which the five central plants were used as the useful plot, planted at 1.5 m between rows, 0.50 m between plants, and 2 m between blocks. The agronomic management was the commercial plan for tomato crops, defined by Jaramillo et al. (2007). Once the fruits reached full maturity (65 d after transplanting for the Montelindo and CEUNP farms and 95 d for the Tesorito farm), they were harvested in accordance with each introduction until the plants completed 10 harvest passes (1 pass/week).
Analysis of the information
An analysis of variance was performed using the SAS GLM procedure (SAS Institute, 1992), under the statistical models (Steel and Torrie, 1997):
Individual statistical model (1):
where, Y ij is observed value of the i th genotype in the j th block; µ is general mean; B j is effect of block j (the block being the level of potassium fertilization 0, 60, 120, 180 kg ha-1); G i is effect of genotype i; (BG) ij is effect of the interaction of genotype i in block j , and ε ij is experiment error.
The difference in each of them was established by comparing means with the average partition test or Duncan's test (P≤0.05).
Combined statistical model (2):
where, Y ijk is mean behavior of genotype i in replicate j in environment k; μ is general mean of the experiment for the nine environments; A k is effect of environment k; (B j ) k is effect of replicate j within locality k; G i is effect of genotype i, (GA) ik is effect of the interaction of genotype i in environment k, and ε ijk is combined experiment error.
AMMI analysis
The AMMI multivariate analysis was represented by the equation proposed by Crossa (1990) (3):
where, Y ij is value observed in the i-th genotype in the j-th environment; μ is overall mean; g i is mean of the i-th genotype minus the overall mean; e j is mean of the j-th environment minus the overall mean; λ k is square root of the characteristic value of the k-th axis of the principal component analysis (PCA)k; α jk γik is qualifications of the PCA for the k-th axis of the i-th genotype and j-th environment; and ε ij is residual of the model. Finally, the analysis and figures (biplots) were generated using InfoGen (Balzarini and Di Rienzo, 2003).
RESULTS AND DISCUSSION
Combined analysis of variance
The combined analysis of variance indicated that there were significant differences in the environments for variables NFT, AWF and PFT, indicating that the tomato genotypes behaved differently in the three evaluation environments (Tab. 3). Similar results were reported by Sánchez et al. (2015), who found significant differences in the environments for variables days to first cut, average weight of the fruit and yield, when evaluating 25 tomato genotypes in three environments using the AMMI model. Likewise, these results are in accordance with those found by Al-Aysh (2014) and Hernández-Leal et al. (2019). The mean squares were highly significant (P≤0.01) for all characteristics, suggesting that environmental effects play an important role in the expression of phenotypic value in the evaluated genotypes.
Table 3. Combined variance analysis for production variables in ten cherry tomato genotypes in nine environments.
| Source of variance | D.f | Yield (kg/pl) | Number of fruits per plant | Average weight of the fruit (g) | ||||||
|---|---|---|---|---|---|---|---|---|---|---|
| SS | MS | % SS | SS | MS | % SS | SS | MS | % SS | ||
| Environment (E) | 8 | 105.84 | 13.23** | 39.73 | 4404726.32 | 550590.79** | 57.36 | 5443.76 | 680.47** | 45.47 |
| Genotype (G) | 9 | 83.52 | 9.28** | 31.35 | 1650837.87 | 183426.43** | 21.50 | 3623.13 | 402.57** | 30.26 |
| GxE | 72 | 77.04 | 1.07** | 28.92 | 1624195.44 | 22558.27** | 21.15 | 2905.92 | 40.36** | 24.27 |
| Mean | 1.02 | 125.18 | 11.82 | |||||||
| CV (%) | 43.4 | 56.9 | 29.66 | |||||||
* and ** significant differences at 5% and 1% probability, respectively. D.f: degrees of freedom, SS: sum of squares, MS: mean square, %SS: percentage of the sum of squares, CV: coefficient of variation.
Highly significant differences were found among the genotypes for the three variables. A variable response of tomato genotypes to different environments in the case of yield per plant was also observed by Prasanna et al. (2007). Likewise, the mean squares of the GEI were highly significant (P≤0.01) for NFT, PPF and PFT; therefore, the tomato genotypes interacted considerably in the three evaluation environments.
Savale and Patel (2017) studied the stability of 45 tomato genotypes (32 hybrids, 12 parents and one commercial control) under three different environments to identify the most stable genotypes. The pooled analysis of variances indicated that the G×E interactions were highly significant for fruit yield per plant (kg) and pericarp thickness (mm). The linear and non-linear components of the G×E interactions were significant for these characteristics, indicating that the response of genotypes varies in different environments.
Al-Aysh (2014) evaluated 14 local tomato varieties (Solanum lycopersicum L.) to estimate the magnitude of the interaction genotype-environment and phenotypic stability for the number of branches per plant, number of fruits per plant, average weight of fruit (g), and fruit yield per plant (kg) using the methodology of Eberhart and Russell (1966). Because of the genotypes, environments (years) and genotype-environment interaction, the mean squares were highly significant (P≤0.01) for most of the evaluated characteristics. The components of the genotype-environment interaction (linear), together with the combined deviation, were significant for the number of fruits per plant, suggesting the importance of both the linear and non-linear components in the construction of the GxE interaction.
The yield (kg/pl) of the 10 tomato genotypes in the nine environments determined that 31.35% of the sum of total squares was attributable to genotypic effects, while the environmental effects and the G×E interaction represented 39.73 and 28.92%, respectively. Significant differences were found (P≤0.01) in all sources of variation with a mean yield of 1.02 kg/pl (Tab. 3). For the production variables, 57.36 and 45.47% of the total sum of squares was due to environmental effects for NFT and AWF, respectively, while the genotypic effects represented 21.5 and 30.26% of the total sum of squares for the same variables. The effects of the G×E interaction showed the lowest values of the total sum of squares, 21.15 and 24.27%, respectively. The average reached in the NFT was 125.18, while the AWF showed an average weight of 11.82 g (Tab. 3).
Analysis of the interaction genotype-environment by the AMMI model
The principal components analysis indicated that the first two principal components (PC1 and PC2) were significant (P≤0.01) and, together, explained 85, 88 and 87% of the existing variation in the sum of squares for the interaction of variables PFT, NFT AND AWF, respectively. Parga et al. (2005) stated that AMMI normally explains more variation with two or three principal components than that explained by analysis of variance in its corresponding source of variation. Sánchez et al. (2015) found that only two components explained 100% of the existing variation, with the tomato experimental hybrid Q3×R1 being the best in terms of quality and yield. The evaluation environments were very different in their discrimination of genetic materials.
Table 4 summarizes the variables average production per plant (kg/pl), number of average fruits per plant and average weight of the fruit (g) for each genotype in each environment and the values of the coordinates of the main components for genotypes and environments. Likewise, figures 1, 2 and 3 show the graphic representation of said variables.
Table 4. Means and values of the coordinates of the principal components for genotypes and environments for cherry tomato production characteristics.
| Genotype | Production per plant (kg/pl) | PC1 | PC2 | Number of fruits per plant | PC1 | PC2 | Average weight of the fruit (g) | PC1 | PC2 |
|---|---|---|---|---|---|---|---|---|---|
| IAC1621 (1)* | 1.39 | 1.14 | 1.00 | 162.58 | 77.89 | -2.14 | 10.92 | -4.5 | - |
| IAC1624 (2) | 0.90 | - | 0.13 | 89.12 | -91.05 | -77.13 | 15.10 | 12.2 | -2.8 |
| IAC1688 (3) | 1.41 | 0.57 | 0.39 | 242.87 | 280.3 | -88.34 | 8.07 | - | 0.7 |
| IAC391 (4) | 1.44 | 1.14 | - | 117.9 | -23.52 | -39.46 | 16.27 | 2.98 | - |
| IAC412 (5) | 0.40 | - | - | 32.79 | - | -75.73 | 14.63 | - | 0.82 |
| IAC426 (6) | 1.14 | - | 0.04 | 177.61 | -75.08 | 167.88 | 9.99 | 5.05 | 8.31 |
| IAC445 (7) | 0.81 | - | - | 93.83 | -63.93 | - | 11.96 | - | - |
| LA2076 (8) | 1.07 | - | - | 128.92 | - | 36.90 | 9.84 | - | 0.6 |
| LA2692 (9) | 0.64 | - | 0.42 | 166.19 | 53.69 | 214.36 | 7.20 | 1.92 | 0.54 |
| Control (10) | 2.07 | 1.69 | - | 236.03 | 137.09 | -6.15 | 9.68 | - | 1.67 |
| T0K | 1.61 | 0.04 | -0.09 | 251.29 | -0.05 | 0.72 | 7.26 | -0.27 | 0.02 |
| T60K | 1.43 | 0.25 | -0.59 | 211.47 | 0.24 | -0.52 | 7.14 | -0.31 | 0.35 |
| T120K | 1.61 | 0.56 | 0.61 | 254.98 | 0.69 | -0.13 | 7.22 | -0.47 | 0.05 |
| T180K | 1.89 | 0.5 | -0.23 | 295.69 | 0.37 | 0.38 | 7.63 | -0.32 | -0.1 |
| M0K | 1.00 | -0.22 | 0.28 | 79.36 | -0.18 | -0.06 | 14.50 | 0.28 | -0.16 |
| M60K | 0.60 | -0.27 | 0.28 | 46.58 | -0.25 | -0.13 | 15.27 | 0.32 | -0.44 |
| M120K | 0.76 | -0.39 | 0.06 | 58.29 | -0.35 | -0.01 | 15.11 | 0.22 | -0.37 |
| M180K | 0.60 | -0.18 | -0.12 | 47.36 | -0.27 | -0.11 | 14.94 | 0.03 | -0.06 |
| PAL | 0.57 | -0.27 | -0.22 | 51.37 | -0.19 | -0.15 | 12.89 | 0.53 | 0.71 |
*The numbers in parentheses correspond with the respective name of the genotype in the figures of the biplot.
As can be seen in table 4, the genotypes that showed higher production per plant through the environments were Sweet Million (control), followed by the genotypes IAC391, IAC1688, IAC1621 and IAC426, whose values ranged between 1.14 and 2.07 kg/pl and, in turn, presented the highest absolute values of PC1, except for IAC1688, indicating the greatest interactions and, therefore, the best in favorable environments. In contrast, the genotypes IAC445, LA2076 and IAC412 obtained medium and low production values per plant (between 1.07 kg/pl and 0.4 kg/pl) and presented the lowest absolute values of PC1, indicating small interactions and, therefore, the most stable genotypes across the environments.
The environments that contributed most to the genotype-environment interaction were T180K and T120K, which presented the highest absolute values in PC1, 0.5 and 0.56, respectively. T180K contributed the most to the increased production per plant, with an average value of 1.89 kg/pl. The rest of the environments, with absolute values of PC1 close to zero, contributed little to the interaction. T0K (0.04) and M0K had low values because they were controlled artificial environments (zero potassium levels) (Tab. 4). Potassium has a significant effect on the quantity and quality of tomato yields because of its vital roles in photosynthesis, favoring high energy status and appropriate nutrient translocation and water uptake in plants (Amjad et al., 2014; Zörb et al., 2014; Woldemariam et al., 2018), enzyme activation, cell turgor maintenance, and ion homeostasis (Marschner, 1995).
Similar environments for ranking the genotypes were 0K, 60K, 120K, M180K and PAL, which indicated that one of these environments can be discarded without losing precision in the results. On the other hand, the environments T60K, T120K and T180K had responses that indicated specific genotypes, such as IAC1621 (1) and IAC1688 (3), which expressed their maximum yield potential in environment T120K (120 kg ha-1 of potassium on the Tesorito farm) (Fig. 1B), with values that nearly exceeded 100% of the average of each one in the environments. On the other hand, the control genotypes and IAC391 proved to be more specific in environment T180K, yielding a production of 3.70 kg/pl and 2.92 kg/pl, respectively, while genotype IAC426 was more specific for environment M120K. The most stable genotypes across the environments, as the result of their proximity to the center of the figure, were IAC445, LA2076 and IAC412 (Fig. 1A). Woldemariam et al. (2018) assessed the effect of potassium levels (0, 50, 100, 150, 200, 250, 300, 350 and 400 kg K2O/ha) on tomato productivity and fruit quality. The results of this study revealed that potassium had a significant effect on all yield and quality parameters. Increases in tomato yield, growth and fruit quality, when evaluated with different doses of sources of K and in balance with other micronutrients, have also been reported by Khan et al. (2014), Armita et al. (2017), Hernández-Pérez et al. (2019) and Weinert et al.(2021).
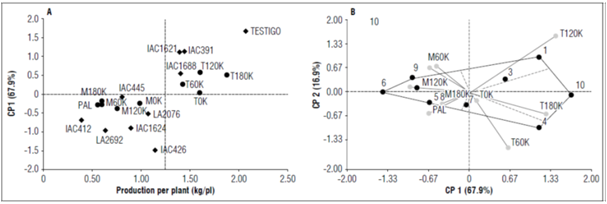
Figure 1. A and B, distribution of the ten tomato genotypes in the nine evaluation environments for the variable production per plant.
The control genotypes, IAC1621, IAC391 and IAC1688 showed the highest yield potential (greater than 1.3 kg/pl) and a degree of association with the different environments (potassium levels) in the natural environment (Tesorito). The genotypes with a greater genotype-environment interaction and lower yield potential, that is, those most associated with unfavorable environments, were IAC445, LA2692 and IAC1624, with PC1 absolute values close to one. IAC445 was the most stable across the environments (Fig. 1A, Tab. 3). Zayed et al. (2005) stated that high and stable yields are the main objective of plant breeding programs. A genotype must show good performance in a wide range of environments to be widely accepted.
For the variable number of fruits per plant, the genotypes with the greatest interaction through the environments were LA2692 (9) and LA1688 (3). Genotype LA2692 had positive PC1 and PC2 values associated with environments T0K and T180K, presenting values of 400 and 457 fruits per plant, respectively (Tab. 4, Fig. 2B). LA1688 presented the highest PC1 positive value (280.3), associated with environment T120K, where the maximum potential reached 594 fruits per plant. In contrast, genotype IAC426 was shown to be specific for environment T0K and reported 455 fruits per plant in that environment (Fig. 2A). Genotypes IAC412 and IAC445 had negative PC1 and PC2 values that were associated with the negative environments, which could be defined as Montelindo and Palmira mega-environments (Tab. 4, Fig. 2B).
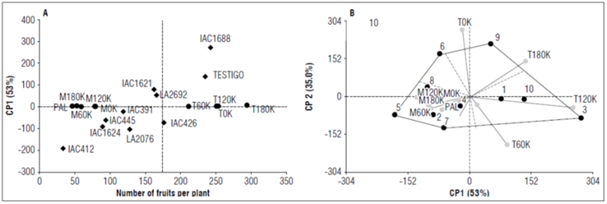
Figure 2. A and B, distribution of the ten tomato genotypes in the nine evaluation environments for the variable number of fruits per plant.
For the variable average fruit weight, genotypes IAC391, IAC1624, IAC412, IAC1621 and IAC445 exhibited the highest values, oscillating between 10.92 and 16.27 g/fruit and with the highest absolute values of PC1, indicating the greatest interactions and, therefore, the best in favorable environments (Tab. 4). Similar environments for ranking the genotypes were the Tesorito and Montelindo macro-environments with their respective artificial environments (0K, 60K, 120K and 180K). The Montelindo macro-environment was more favorable for the expression of fruit weight and had PC1 and PC2 absolute values greater than zero. On the other hand, the Tesorito macro-environment showed the lowest fruit weight values and had negative PC1 values and PC2 values close to zero, except in environment T60K.
The results indicated that one of the artificial environments within the macro-environments could be discarded without losing precision in the results. In this case, the decision would be economical from the point of view of the cost of fertilization and the associated workforce using the benefit-cost ratio (Tab. 4, Fig. 3 A, B).
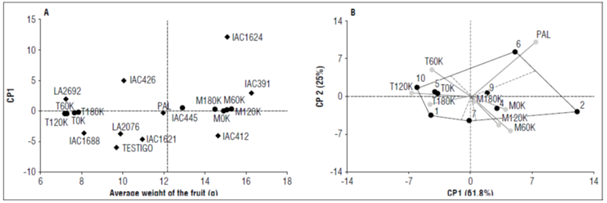
Figure 3. A and B, distribution of the ten tomato genotypes in the nine environments evaluated for the variable average fruit weight.
The environment Palmira (PAL) was the most interacting environment, presenting the highest absolute values in the two principal components (PC1 and PC2) and being the IAC426 genotype as the most specific, which had a fruit weight of 20.81 g in this environment.
The vertex genotypes with the highest interaction were IAC1624 (2) and IAC445 (7), specific to the Montelindo macro-environment; meanwhile, the control (10), along with genotype IAC1621 (1), had a stronger association with the Tesorito macro-environment. The most stable genotype across the environments with absolute values for PC1 and PC2 close to zero was LA2692, with an average fruit weight of 7.20 g (Tab. 4, Fig. 3 A, B).
The results identified groups of positively correlated environments, vectors in the same direction, and negatively correlated environments. This is important because it helps identify key environments and environments that better discriminate tomato genotypes. At the genotype level, this method identifies positively associated genotypes and groups of genotypes associated with specific environments.
CONCLUSIONS
The combined analysis of variance for the variables production per plant, number of fruits per plant and average fruit weight showed significant differences between the different genotypes, environments and genotype-environment interactions, indicating significant variations in the productive potential of the different genotypes and the differential response of this group of genotypes as the environment varies.
It is worth noting the need to identify and select specific genotypes for different environments to express their genetic potential in terms of economic importance for stable yields across localities for years. In this case, the environments T120K and T180K were optimal for the variables associated with production (PFT, NFT and AWF), with the most promising genotypes per environment being IAC1621, IAC426 and IAC1624 on the Farms Tesorito, Montelindo and CEUNP; respectively.

