


![Heritability, genetic gain, and correlations in cowpea beans (Vigna unguiculata [L.] (Walp.)](/img/en/prev.gif)


 English (pdf)
 Article in xml format
 Article references
 Send this article by e-mail
 Cited by SciELO
  Cited by Google
  Similars in
SciELO
Similars in
SciELO  Similars in Google
 Permalink
INTRODUCTION
The pea is one of the older cultivated plants used by mankind. Wild pea fields can still be found today in Afghanistan, Iran and Ethiopia (Espósito et al., 2007). Broad genetic diversity has been reported in peas by Bhuvaneswari et al. (2017) and Singh et al. (2017). This diversity has been conserved in gene banks and studied for the last 20 years (Singh et al., 2013; Warkentin et al., 2015). 72,000 pea accessions are preserved in 25 large collections, and 27,000 accessions make up part of 146 collections, including various wild relatives (Smykal et al., 2011; Smykal et al., 2013; Smykal et al., 2014; Trněný et al., 2018).Pisum sativum L. is used for human consumption as a dry seed or as fresh vegetables grown from immature grains (Ma et al., 2017). Dried peas are grown during the summer in Australia, Canada, China, India, Eastern, Europa and the northwest United States (Wu, et al., 2017). Genetic diversity is the main input for the genetic improvement of a cultivated species; therefore, it is a prerequisite for any improvement program to increase yields and stabilize production in the face of disease epidemics and fluctuation of environmental conditions. (Abubakkar et al., 2011; Gatti et al., 2011; Tiwary and Lavanya, 2012). Local and wild varieties are maintained in germplasm banks as genetic resources; however, their use has been limited when breeding for yield (Ali et al., 2007). Since inheritance acts as a predictive tool to express the reliability of phenotypic traits, high heritability could help in the effective selection of particular characteristics and when designing future selection programs (Mallu et al., 2014).
Morphological characterization is the first step in describing and classifying germplasm (Bouhadida et al., 2013). Understanding morphological characteristics facilitates the identification and selection of desirable attributes, design of new populations, gene transfer, and resistance to biotic and abiotic factors (Singh et al., 2014). In the characterization process, traits with high heritability are favorable because this implies little environmental influence. This ensures that the genotype environment interaction has a reduced effect on variables that characterize different accessions.
The objective of the present investigation was to carry out a morphological characterization of 40 bush pea accessions from European and South American countries, donated to the Universidad de Nariño by the Corporación Colombiana para la Investigación Agropecuaria (Agrosavia) and the Universidad Nacional de Colombia or grown from plants through local crosses to identify and classify genotypes and attributes of interest for the genetic improvement of species in Colombia.
MATERIALS AND METHODS
Location. This research was carried out in 2018 and 2019 at the Centro International para Produccion Limpia "LOPE Spanish traducction", which belongs to the Servicio Nacional de Aprendizaje of Colombia (SENA), located in the municipality of Pasto, Department of Nariño, with an altitude of 2,612 m a.s.l., at 01°12'28” N and 77°15'06” W, with an average temperature of 14°C, annual rainfall of 841 mm and relative humidity of 73%
Genetic material. 40 bush pea (Pisum sativum L.) genotypes belonging to the Andean Crops Research Group (GRICAND) of the Faculty of Agricultural Sciences at the Universidad de Nariño were used in this study. In the last decade, GRICAND developed a collection of bush pea genotypes of different origins, donated by the Universidad Nacional de Colombia, the Agrosavia germplasm bank, and the improvement program of the Universidad de Nariño. The sowing was carried out in 2018; 40 lines were sown in a block with plots of three two-meter rows, with 0.5 m between rows and 0.1 m between sites, depositing one seed per site. The land preparation and agronomic management of the crop was done according to the recommendations of Buitrago et al. (2006).
Morphological characterization. The 40 bush pea genotypes were characterized with 12 qualitative and 23 quantitative variables, using the descriptors proposed by the European Union (2003). In addition, the quantitative variables included the percentage reaction to powdery mildew, and the readings were taken with the assessment scales proposed by Checa and Rodríguez (2015). In each of the accessions, five plants in the middle furrow were selected, where the data for the variables were recorded. For the quantitative variables, the results were recorded from the average of the measurements, and, for the qualitative variables, the observations were recorded.
Statistical analysis. The results for the quantitative variables were subjected to principal component analysis (PCA). The quantitative variables were selected, discarding or eliminating those that resulted in a coefficient of variation of less than 20%.
The variables selected for the PCA were: W100 = Weight of 100 seeds; Pppl = Pods per plant; Bbr = Basal branches; Sbr = Secondary branches; Pmb = Peduncle in main branch; Psbr = Peduncle secondary branch; Nle = Number of leaflets; Sl = Stipule length; Sw = Stipule width; Lw = Leaflet width; Ll = Leaflet length; and Pmildr = Reaction to powdery mildew.
A multiple correspondence analysis (MCA) was used for the qualitative variables. Ward's distances were used in the classification and establishment of grouping levels and for the construction of dendrograms. The data were processed using Spad v3.5.
RESULTS AND DISCUSSION
Principal component analysis
Four principal components explained 78.80% of the variability between the analyzed accessions (Tab. 1). The first component explained 44.83% of the total observed variability. The variables that contributed most to this component were number of leaflets (Nle), leaflet width (Lw), leaflet length (Ll) and Peduncle secondary branch (Psbr). The second component explained 16.53% of the total observed variability, where the variables number of basal branches (Bbr) and Leaflet length (Ll)had a notable contribution. The third component explained 9.39% of the total variability. The variables that contributed more to the third component were stipule width (Sw) and resistance to powdery mildew (Pmildr). Finally, the fourth component explained 8.05% of the total variability, where the variable resistance to powdery mildew (Pmildr) contributed most (Tab. 1 and 2).
Table 1. Eigenvalues and percentages of variability explained by the principal components.
| Principal component | Eigenvalues | Percentage | Total percentage |
|---|---|---|---|
| 1 | 5.3790 | 44.83 | 44.83 |
| 2 | 1.9836 | 16.53 | 61.36 |
| 3 | 1.1269 | 9.39 | 70.75 |
| 4 | 0.9665 | 8.05 | 78.80 |
| 5 | 0.7617 | 6.35 | 85.15 |
| 6 | 0.6178 | 5.15 | 90.30 |
| 7 | 0.4542 | 3.79 | 94.08 |
| 8 | 0.3182 | 2.65 | 96.73 |
| 9 | 0.1810 | 1.51 | 98.24 |
| 10 | 0.1604 | 1.34 | 99.58 |
| 11 | 0.0472 | 0.39 | 99.97 |
| 12 | 0.0035 | 0.03 | 100.00 |
Table 2. Contribution of the quantitative variables to the conformation of the principal components.
| Variables/Components | 1 | 2 | 3 | 4 |
|---|---|---|---|---|
| C2 - W100 (g) | -0.67 | -0.27 | -0.32 | 0.00 |
| C3 - Pppl | 0.64 | 0.02 | 0.06 | -0.20 |
| C4 - Bbr | 0.18 | -0.79 | -0.28 | 0.12 |
| C5 - Sbr | 0.66 | -0.23 | 0.02 | 0.32 |
| C6 - Pmb (cm) | 0.52 | -0.46 | 0.36 | -0.47 |
| C7 - Psbr (cm) | 0.80 | -0.21 | 0.37 | 0.01 |
| C8 - Nle | 0.94 | 0.24 | -0.09 | 0.04 |
| C9 - (Sl) (cm) | 0.17 | -0.79 | -0.06 | 0.42 |
| C10 - (Sw) (cm) | -0.55 | -0.38 | 0.61 | -0.15 |
| C11 - (Lw) (cm) | 0.95 | 0.14 | -0.04 | 0.06 |
| C12 - (Ll) (cm) | 0.95 | 0.20 | -0.06 | 0.09 |
| C13 - Pmildr% | -0.32 | 0.31 | 0.54 | 0.62 |
The results agree with the report by Gixhari et al. (2014), who stated that the weight of 100 seeds, the width of the leaflet, and the length of the leaflet are among the characteristics that explain much of the variability in peas. They also agree with Hanci and Cebeci (2018), who included the width and length of the leaflet and the length and width of the stipule among the variables with significant contribution to the main components.
Four groups were established with the Classification Analysis dendrogram generated from the PCA (Fig. 1), as shown in table 3. The first group included 15 genotypes, (ARB012, ARB014, ARB013, ARB021, ARB016, ARB005, ARB011, ARB007, ARB008, ARB010, ARB009, ARB004, ARB002, ARB003 and ARB001) 37.5% of the studied population. This group in particular stood out for the weight values per 100 kernels (74.87 g) when compared to the overall average (65.20 g). Other characteristics in this group were recorded below the general average. The presence of zero values in the number category indicated that the genotypes of this group were afila, characterized by a lack of leaflets as the result of the recessive af gene, which replaces leaves with tendrils (Amin et al., 2010).
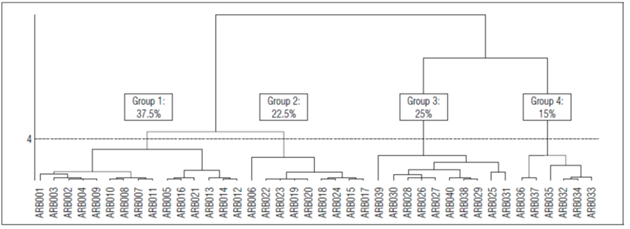
Table 3. Characterization with continuous variables in groups or categories.
| Probability | Average | Standard deviation | Variables | ||
|---|---|---|---|---|---|
| Group | General | Group | General | ||
| Group 1 | |||||
| 0.001 | 74.87 | 65.20 | 9.32 | 15.14 | W100 (g) |
| 0.007 | 8.80 | 9.83 | 0.96 | 2.03 | Pmb (cm) |
| 0.000 | 1.51 | 2.35 | 0.82 | 1.19 | Sbr |
| 0.000 | 20.39 | 27.21 | 6.92 | 9.39 | Pppl |
| 0.000 | 0.00 | 2.03 | 0.00 | 2.58 | Nle |
| 0.000 | 0.00 | 1.28 | 0.00 | 1.61 | Ll (cm) |
| 0.000 | 0.00 | 2.00 | 0.00 | 2.48 | Ll (cm) |
| 0.000 | 3.64 | 5.70 | 1.28 | 2.46 | Psbr (cm) |
| Group 2 | |||||
| 0.000 | 12.72 | 9.86 | 0.82 | 2.08 | Sw (cm) |
| 0.004 | 0.00 | 2.03 | 0.00 | 2.58 | Nle |
| 0.004 | 0.00 | 1.28 | 0.00 | 1.61 | Lw (cm) |
| 0.003 | 0.00 | 2.00 | 0.00 | 2.48 | Ll (cm) |
| Group 3 | |||||
| 0.000 | 4.98 | 2.00 | 0.54 | 2.48 | Ll (cm) |
| 0.000 | 4.98 | 2.03 | 0.71 | 2.58 | Nle |
| 0.000 | 3.03 | 1.28 | 0.55 | 1.61 | Lw (cm) |
| 0.002 | 52.90 | 65.20 | 17.08 | 15.14 | W100 (g) |
| 0.000 | 7.73 | 9.86 | 1.02 | 2.08 | Sw (cm) |
| Group 4 | |||||
| 0.000 | 13.50 | 9.83 | 0.86 | 2.03 | Pmb (cm) |
| 0.000 | 3.52 | 1.28 | 0.42 | 1.61 | Lw (cm) |
| 0.000 | 9.03 | 5.70 | 1.12 | 2.46 | Psbr (cm) |
| 0.001 | 5.22 | 2.03 | 1.50 | 2.58 | Nle |
| 0.001 | 5.07 | 2.00 | 0.59 | 2.48 | Ll (cm) |
| 0.001 | 3.75 | 2.35 | 1.05 | 1.19 | Sbr |
| 0.004 | 2.28 | 1.74 | 0.38 | 0.53 | Bbr |
| 0.008 | 6.63 | 5.47 | 1.26 | 1.26 | Sl (cm) |
| 0.000 | 0.36 | 0.71 | 0.37 | 0.27 | Pmildr (%) |
Weight of 100 grains is an important variable because it represents the part of the legume that is useful for consumption. In general, the varieties with a high grain weight per pod have a high market value. The genotypes of this group could contribute to the improvement of this characteristic, but genetic improvement has compensation mechanisms for the components of yield. When the number of seeds per pod is increased, the number of pods per plant and the seed weight could be reduced (Tiemerman et al., 2005). Gupta et al. (1984) reported that the expression of seed weight is governed by additive and non-additive genetic effects. However, the selection genotypes with more pods per plant and a greater number of seeds per pod could improve yield (Brijendra et al., 2013; Iqbal et al., 2017; Kumar et al., 2017).
Group two was made up of nine individuals: ARB017, ARB015, ARB024, ARB018, ARB020, ARB019, ARB023, ARB022 and ARB006, which corresponded to 22.5% of the population, and had the widest stipule (12.72 cm), with respect to the overall average (9.86 cm). The expression was regulated by the presence of the lat gene (Amin et al., 2010). The zero values for the number, width and length of foliole indicated that this group had afila genotypes. Unlike the genotypes in group one, the stipules were large, giving them the ability to compensate for the foliar area that is decreased when lateral leaves are replaced by tendrils.
Group three was made up of the individuals ARB031, ARB025, ARB029, ARB038, ARB040, ARB027, ARB026, ARB028, ARB030 and ARB039, which corresponded to 25% of the total population. The accessions were characterized by an above-average foliole length, number of leaflets and foliole width and a below-average weight of 100 grains and stipule width.
Group four had six individuals (ARB033, ARB034, ARB032, ARB035, ARB037 and ARB036), which represented 15% of the total population. The variables that were above the overall average and characterized this group were size of peduncle in the main branch, foliole width, size of peduncle in the secondary branch, number of leaflets, leaflet length, number of secondary branches, number of basal branches, and stipule length.
This group included genotypes with the densest foliage, requiring an adjustment in population density to obtain better results. The lines of this group were less susceptible to powdery mildew. Erysiphe pisi (Ep) is the main causal agent of powdery mildew (PM) in peas and is responsible for 25-80% losses in yield worldwide (León et al., 2020; Nisar et al., 2006). The powdery mildew decreases pod quality and is a yield-limiting factor (Nag and Khare, 2017; Sharma et al., 2017).
Multiple correspondence analysis
Nine qualitative traits that showed variability (Dgrc, Typc, Scol, Ssur, Hilc, Hab, Tleaf, Mf, Lmar)showedthat the first factor explained 18.99%, the second one explained 11.25%, the third explained 8.56%, the fourth explained 7.98, and the fifth explained 7.72%. These first five factors explained 54.49% of the total cumulative variability (Tab. 4).
Table 4. Eigenvalues and percentages of variability explained by the factors resulting from the multiple correspondence analysis (MCA).
| Factor | Eigenvalues | Percentage | Accumulated percentage |
|---|---|---|---|
| 1 | 0.4852 | 18.99 | 18.99 |
| 2 | 0.2874 | 11.25 | 30.23 |
| 3 | 0.2188 | 8.56 | 38.79 |
| 4 | 0.2039 | 7.98 | 46.77 |
| 5 | 0.1972 | 7.72 | 54.49 |
| 6 | 0.1539 | 6.02 | 60.51 |
| 7 | 0.1352 | 5.29 | 65.81 |
| 8 | 0.1218 | 4.76 | 70.57 |
| 9 | 0.1188 | 4.65 | 75.22 |
| 10 | 0.0988 | 3.87 | 79.09 |
| 11 | 0.0977 | 3.82 | 82.91 |
| 12 | 0.0891 | 3.49 | 86.40 |
| 13 | 0.0732 | 2.86 | 89.26 |
| 14 | 0.0637 | 2.49 | 91.76 |
| 15 | 0.0575 | 2.25 | 94.00 |
| 16 | 0.0507 | 1.98 | 95.99 |
| 17 | 0.0376 | 1.47 | 97.46 |
| 18 | 0.0239 | 0.93 | 98.39 |
| 19 | 0.0180 | 0.70 | 99.10 |
| 20 | 0.0161 | 0.63 | 99.73 |
| 21 | 0.0055 | 0.22 | 99.94 |
| 22 | 0.0014 | 0.06 | 100.00 |
| 23 | 0.0000 | 0.00 | 100.00 |
The analysis of the effects of the qualitative variables on the factorial axes (Tab. 5) indicated that the variables with the highest contribution to the first factor (factor one) were grain shape (Sseed = 18.0%), margin of foliole (Lmar = 17.5%), seed surface (Ssur = 16.2%), leaf type (Tleaf = 14.7%), and degree of curvature of the pod (Dgrc = 13.1%). The second factor was mainly defined by grain surface (Ssur = 20.8%), leaf margin (Lmar = 18.2%), hilum color (Hilc = 17.8%), and seed shape (Sseed = 17.2%). For the third factor, the notable, contributing variables were grain color (Scol. = 25.5%), type of pod curvature (Typc = 23.6%), growth habitat (Hab = 13.8%) and leaflet margin (Lmar = 11.6%). In the fourth factor, the variables with the highest contribution were leaflet margins (Lmar = 29.1%) and type of pod curvature (Typc = 27.9%). For the fifth factor, the variables with the highest participation were grain shape (31.5%), pod curvature type (Typc = 23%), and seed surface (Ssur = 20.7%).
Table 5. Contribution of the qualitative variables to the factor axes in theanalysis of multiple correspondences.
| Variable | 1 | 2 | 3 | 4 | 5 |
|---|---|---|---|---|---|
| Dgrc | 13.1 | 0.2 | 2.4 | 5.0 | 0.3 |
| Typc | 8.2 | 8.0 | 23.6 | 27.9 | 23.0 |
| Scol | 9.7 | 3.9 | 25.5 | 4.9 | 9.0 |
| Ssur | 16.2 | 20.8 | 7.9 | 5.1 | 20.7 |
| Hilc | 0.1 | 17.8 | 10.9 | 5.4 | 0.2 |
| Hab | 2.4 | 9.9 | 13.8 | 11.0 | 4.3 |
| Tleaf | 14.7 | 4.1 | 0.2 | 6.6 | 0.0 |
| Mf | 17.5 | 18.2 | 11.6 | 29.1 | 11.0 |
| Lmar | 18.0 | 17,2 | 4.1 | 5.1 | 31.5 |
According to the hierarchical classification analysis, the 40 lines of pea plants were organized into five groups (Fig. 2, Tab. 6). The first group had 42.5% of the individuals (ARB008, ARB007, ARB020, ARB006, ARB022, ARB010, ARB024, ARB021, ARB019, ARB023, ARB001, ARB002, ARB004, ARB017, ARB011, ARB018 and ARB ARB009). 100% of the individuals in this class had an afila af gene, which replaces leaves with tendrils.
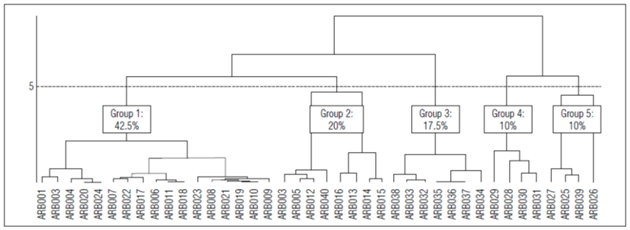
Table 6. Characterization of group categories.
| Probability | Mean | Std. deviation | Characteristic variables | Weight | ||
|---|---|---|---|---|---|---|
| Group | Overall | Group | Overall | |||
| Group 1 | ||||||
| 0.000 | 70.83 | 100 | 60 | C12=1 | Lmar | 24 |
| 0.000 | 70.83 | 100 | 60 | C11=3 | Tleaf | 24 |
| 0.003 | 54.84 | 100 | 77.5 | C6=1 | Hilc | 31 |
| 0.009 | 57.69 | 88.24 | 65 | C13=4 | Sseed | 26 |
| 0.009 | 100 | 29.41 | 12.5 | C10=3 | Hab | 5 |
| 0.009 | 28.57 | 47.06 | 70 | C10=2 | Hab | 28 |
| 0.003 | 0.00 | 0.00 | 22.5 | C6=2 | Hilc | 9 |
| 0.000 | 0.00 | 0.00 | 40 | C11=1 | Tleaf | 16 |
| 0.000 | 0.00 | 0.00 | 0.00 | C11=2 | Tleaf | 0 |
| Group 2 | ||||||
| 0.000 | 77.78 | 87.5 | 22.5 | C6=2 | Hilc | 9 |
| 0.000 | 3.23 | 12.5 | 77.5 | C6=1 | Hilc | 31 |
| 0.000 | 0 | 0 | 0 | C11=2 | Tleaf | |
| Group 3 | ||||||
| 0.001 | 43.75 | 100 | 40 | C11=1 | Tleaf | 16 |
| 0.003 | 46.15 | 85.71 | 32.5 | C5=4 | Ssur | 13 |
| 0.001 | 0.00 | 0.00 | 60 | C11=3 | Tleaf | 24 |
| 0.001 | 0.00 | 0.00 | 60 | C12=1 | Lmar | 24 |
| 0.000 | 0.00 | 0.00 | 0.00 | C11=2 | Tleaf | 0 |
| Group 4 | ||||||
| 0.001 | 50 | 100 | 20 | C2=2 | Dgrc | 8 |
| 0.008 | 50 | 75 | 15 | C5=1 | Ssur | 6 |
| 0.008 | 100 | 50 | 5 | C3=5 | Tipc | 2 |
| 0.008 | 100 | 50 | 5 | C12=2 | Lmar | 2 |
| 0.008 | 30.77 | 100 | 32.5 | C4=4 | Scol | 13 |
| 0.001 | 0.00 | 0.00 | 80 | C2=1 | Dgrc | 32 |
| 0.000 | 0.00 | 0.00 | 0 | C11=2 | Tleaf | 0 |
| Group 5 | ||||||
| 0.000 | 57.14 | 100 | 17.5 | C13=1 | Sseed | 7 |
| 0.000 | 100 | 75 | 7.5 | C4=1 | Scol | 3 |
| 0.008 | 50 | 75 | 15 | C5=1 | Ssur | 6 |
| 0.00 | 0.00 | 0.00 | 0 | C11=2 | Tleaf | 0 |
The accessions that form this group are of special interest to the improvement of pea plants because they are afila genotypes. The afila gene is recessive and leads to phenotypic expression only if it occurs in a homozygous recessive combination (afaf); it transforms leaves into tendrils (Singh et al., 2013). Because of the presence of the afila gene, plants resist early overturning, which affects varieties with conventional foliage; the greater the development of the tendril, the greater resistance to overturning (Wang et al., 2003). In addition, greater aeration favors plants that are less affected by foliar diseases. (Checa et al., 2020).
In restrictive humidity, these afila varieties tend to increase productivity in comparison to non-afila varieties (Jannink et al., 1996;Mihailovic, 2008).
All the individuals in this class presented a hyaline hilum color. In addition, 88.24% of the individuals in this group presented a rectangular shape with several shapes (C13 = 4). Another characteristic that contributed to this group was growth habitat; 47.06% were semi-twining individuals (C10 = 2).
Group two was made up of eight individuals, representing 20% of the population: ARB012, ARB016, ARB040, ARB005, ARB015, ARB013, ARB014, and ARB003. In this group, 87.50% had a light brown hilum, and 12.50% had a hilum. There were no qualitative attributes of great interest in this group for the genetic improvement of this species.
The third group was made up of seven individuals that represented 17.5% of the studied population. 100% of these genotypes had normal leaves or tendrils, and 85.71% had rough seed surfaces. The wrinkled-seeded phenotype has been associated with natural or induced mutations that impact concentrations of starch and sucrose (Santos et al., 2019).
Group four had four individuals that represented 10% of the population; this group was characterized by a degree of curvature in the soft sheath (G2 = 2). This characteristic confers high resistance for transport, as compared to pods with a strong degree of curvature. In addition, all individuals in this group presented a green grain color (C4 = 4) and 75% smooth seed surface (C5=1).
The fifth group was made up of four individuals that represented 10% of the population. All individuals in this group had round seeds; 75% had a cream-colored, and 75% were smooth, which implied a predominance of the R Rb genotype. The predominance of the double dominant Pla Qua, which indirectly determines rounded seed shapes, is alsoexpected, favoring non-compact arrangements of seeds in pods (UPOV, 1994).
CONCLUSIONS
The quantitative variables (weight of 100 grains, stipulate size, width and length of leaflets, number of leaflets, and peduncle size on the main branch) and the qualitative variables (leaf type, hilum color, grain type, and degree of curvature of the pod), contributed to the variability of the pea collection characterized in this study.
Among the variables of interest for pea improvement, the afila trait conferred by the af gene was found in groupings one and two of the quantitative variables and in group one of the qualitative variables. The highest seed weight was found in the genotypes in grouping one of the quantitative variables, and the genotypes resistant to powdery mildew were in grouping four.

