


 English (pdf)
 Article in xml format
 Article references
 Send this article by e-mail
 Cited by SciELO
  Cited by Google
  Similars in
SciELO
Similars in
SciELO  Similars in Google
 Permalink
INTRODUCTION
The potato (Solanum tuberosum L.) is one of the more important crops for human nutrition (Salcedo and Guzmán, 2014). It is grown under different production systems, and the highest diversity is found in South America, its center of origin (Sepúlveda-Cano et al., 2017; Khoury et al., 2016). There are more than 3000 cultivars of this tuber, and it is adaptable to different altitudes(Berdugo-Cely et al., 2017; Caro et al., 2019; Gil-Rivero et al., 2019). Most native potatoes belong to the Phureja group and have great scientific and conservation value for farmers given their organoleptic, agricultural, nutritional properties and cultural identity (Calliope et al., 2018). Colombia has a high genetic diversity of potatoes that is useful to improvement programs; furthermore, it has one of the most important and promising potato germplasm collections (Berdugo-Celyet al., 2017). Given its favorable agroclimatic conditions for potato production, Colombia is considered a highly feasible region for large-scale cultivation of this plant material and the development of genetic improvement processes and programs (Ghislainet al., 2006). The largest potato production in Colombia is in the departments of Cundinamarca, Boyaca, Nariño and Antioquia, which together provide 91% of the total production area, where Nariño contributes 19% (Agronet, 2019). In 2020, the national average was 20.9 t ha-1, and the Department of Nariño reached 22.2 t ha.1 (MADR, 2020).
The assessment of work collections through genetic improvement programs represents an alternative for increasing potato crop yield. This evaluation sought to identify and select genotypes with outstanding yield and adaptability or stability in diverse environments, as well as the capacity to tolerate biotic (e.g., pests and diseases) and abiotic factors (e.g., drought and soil salinity, among others) that can damage crops (Picardi, 2018; Yahaya et al., 2015). The impact of these factors varies according to the genetic composition of the plant material and the environment where the crop is established (Cooper and Byth, 1996).
The response of genotypes to the environment is determined by estimating the genotype-environment interaction (GEI) (Vargas et al., 1999; Abbott and Pistorale, 2011; Salomón et al., 2015). This interaction is highly important in improvement programs and is a determinant factor in cultivar selection and recommendation processes since it allows improving the efficiency of the genetic improvement process (Sleper and Poehlman, 2006; Andrade et al., 2016; Márquez-Vasallo et al., 2020). The significance of GEI allows evaluating the behavior of genotypes (in this case, through yield) and determining whether genotypes adapt to the study areas or environments (Mohammed, 2017). The GEI enables the identification of superior genotypes and ideal conditions for their development (Lule et al., 2014; Thiyagu et al., 2013). Furthermore, it estimates the differential behavior of genotypes under contrasting conditions (i.e., agroecological, climatic, and agronomical) that influence plant growth and development(Haynes et al., 2012; Mohammadi et al., 2016; Tirado et al., 2018).
A GEI analysis is supported by an additive model of main effects and multiplicative interaction (AMMI) (Tirado et al., 2018). This model assesses the effect of the interaction in experimental plots, providing important and necessary data for the selection of varieties (Negash et al., 2013). The AMMI model shows the behavior of genotypes and environments through a biplot graph (Vargas and Crossa, 2000), while a principal components analysis (PCA) enables the identification and selection of superior genotypes based on their yield in a given environment (Adebola et al., 2013). A PCA is based on the decomposition of eigenvalues and can be applied to yield data (Gauch, 2006). On the other hand, biplot graphs provide information for drawing important conclusions about the environment and genotype (Elias et al., 2016).
It is necessary to identify genotypes with optimal yields that contribute to breeding programs and generation of varieties that would benefit potato producers. Therefore, this study aimed to determine the GEI of yield in 21 guata potato genotypes, selected based on their response to water stress conditions in previous studies, in four localities in the Department of Nariño.
MATERIALS AND METHODS
This research was conducted in four potato-growing regions in the Department of Nariño, Colombia, in the first half of 2019, located at 1°09'33.5" N and 77°16'34.6" W in the municipality of Pasto; 1°03'48.2" N and 77°25'14.2" W in Tangua; 1°04'08.1" N and 77°28'01.8" W in Imues, and 0°52'05.2" N and 77°37'15.1" W in Pupiales. These localities are distributed across four producing zones, with different altitudes and edaphic conditions, as shown in table 1.
Table 1. Altitude and edaphic conditions of the study zones.
| Loc | Altitude (m a.s.l.) | Tex | pH | OM (%) | P (mg kg-1) | Ca (cmol kg-1) | Mg (cmol kg-1) | K (cmol kg-1) |
|---|---|---|---|---|---|---|---|---|
| Pasto | 2,820 | Sandy- loam | 6.4 | 2.75 | 72.83 | 8.26 | 3.67 | 1.39 |
| Tangua | 2,098 | Loam | 6.18 | 2.47 | 14.52 | 6.21 | 2.58 | 0.51 |
| Imues | 2,108 | Loam | 6.46 | 1.39 | 39.22 | 6.62 | 2.00 | 0.85 |
| Pupiales | 2,966 | Loam | 5.3 | 13.7 | 41.68 | 4.62 | 1.47 | 1.74 |
Loc = locality; m a.s.l. = meters above sea level; Tex = soil texture; OM = organic matter; P = phosphorous; Ca = calcium; Mg = magnesium; K = potasium.
This study evaluated 20 experimental guata potato clones from the work collection of the Universidad de Nariño, which were previously selected and assessed under water stress conditions in a greenhouse. Additionally, a commercial control (‘Diacol Capiro’) was used (Tab. 2), a widely adaptable variety that is grown in several departments of Colombia between 2,000 and 3,200 m a.s.l. The commercial control shows high chip production quality and has a high industrial demand (Porras and Herrera, 2015).
Table 2. Guata potato (S. tuberosum var. tuberosum) genotypes selected from the work collection of the Universidad de Nariño.
| N° | Genotype | Code | Source | Origin |
|---|---|---|---|---|
| 1 | ‘Unica M2’ | 20 | ‘Unica M2’ (‘Unica Vieja La Cocha’) | Colombia |
| 2 | ‘Diacol Capiro’ | 24 | ‘Diacol Capiro’ | Colombia |
| 3 | Suprema M2 | 31 | ‘Pastusa Suprema’ certificada M2 | Colombia |
| 4 | UdenarStGua55 | 55 | CIP 377744.1 Kori-INIA | Peru |
| 5 | UdenarStGua57 | 57 | CIP 384866.5 Amarilis-INIA | Peru |
| 6 | UdenarStGua58 | 58 | CIP 387164.4 LBr-40 | Peru |
| 7 | UdenarStGua59 | 59 | CIP 389746.2 | Peru |
| 8 | UdenarStGua61 | 61 | CIP 391011.17 | Peru |
| 9 | UdenarStGua68 | 68 | CIP 392657.171 | Peru |
| 10 | UdenarStGua71 | 71 | CIP 393077.159 | Peru |
| 11 | UdenarStGua72 | 72 | CIP 393079.24 | Peru |
| 12 | UdenarStGua78 | 78 | CIP 393371.58 INIA 310 | Peru |
| 13 | UdenarStGua82 | 82 | CIP 394904.20 | Peru |
| 14 | UdenarStGua83 | 83 | CIP 395112.32 | Peru |
| 15 | UdenarStGua87 | 87 | CIP 396012.266 | Peru |
| 16 | UdenarStGua89 | 89 | CIP 396034.268 | Peru |
| 17 | UdenarStGua91 | 91 | CIP 396285.1 | Peru |
| 18 | UdenarStGua93 | 93 | CIP 397196.3 | Peru |
| 19 | UdenarStGua94 | 94 | CIP 398190.404 | Peru |
| 20 | UdenarStGua97 | 97 | CIP 398193.553 | Peru |
| 21 | UdenarStGua98 | 98 | CIP 398208.620 | Peru |
The fresh weight of the tuberes, expressed as kilograms per plot, was recorded at harvest. Furthermore, the number of tons per hectare were calculated. Data were recorded at 180 d after planting.
A complete randomized block design with four repetitions was used. The experimental plot was formed with four rows, and the useful plot comprised two rows of five plants, separated by a distance of 0.4 m between plants and 1.20 m between rows. The rows were established as the useful plot (9.6 m2), and one tuber was planted per site. This experiment was established in four potato-growing localities of the Department of Nariño (Marcillo et al., 2021). Sanitary and agronomic management was done according to the technical recommendations and requirements of the crop (ICA, 2011).
An additive main effects and multiplicative interaction (AMMI) model (Eq. 1) was used to determine the phenotypic stability. The AMMI model adjusts the analysis of variance and thus obtains the main effects of the genotype and the environment together with the analysis of main components, providing the genotypes with greater adaptation to each zone (Sharifi et al., 2017). This model analyzed the main additive effects of the potato genotypes and the localities through a conventional analysis of variance, followed by a description of the non-additive variance with a multivariate principal component analysis (PCA). The following model was used as described by Crossa et al. (1990):
where,
A biplot graph was generated from the first two principal components (PC1 and PC2). This plot represented the similarities of the potato genotypes and their interaction with the localities. The statistical analyses were conducted using the agricolae package in R v. 4.2 (R Core Team, 2008).
For the comparison of means between the treatments, significant differences were established according to De la Cruz-Lázaro et al. (2010) when the mean of the genotypes exceeded the overall mean plus one standard deviation (µ+σ) or twice the standard deviation (µ+2σ) (i.e., highly significant).
RESULTS AND DISCUSSION
The analysis of variance of the main and additive effects of the environments, genotypes, and GEI on yield was highly significant (P<0.001) (Tab. 3). The significance of the interaction justified conducting further analyses to determine the behavior of the genotypes across the localities, indicating an important variation across the genotypes (Maharana et al., 2017). Similar results were found by Cabrera (2019), who evaluated stability parameters in eight potato genotypes across six localities through a combined analysis of variance. This author reported significant results for environments, genotypes, and GEI, with yields of up to 22.09 t ha-1.
Table 3. AMMI analysis of potato (S. tuberosum var tuberosum) yield in four localities of the Department of Nariño.
| Source of variation | df | Sum of squares | Mean square | %SC | P-value |
|---|---|---|---|---|---|
| Environments | 3 | 101.335 | 33.778 | 42.43 | *** |
| Repetitions | 12 | 3.735 | 311 | 1.56 | *** |
| Genotypes | 20 | 33.047 | 1.652 | 13.84 | *** |
| GenxEnv | 60 | 36.987 | 616 | 15.49 | *** |
| PC 1 | 22 | 13.618 | 619 | 73.64 | *** |
| PC 2 | 20 | 3.372 | 169 | 18.22 | ** |
| PC 3 | 18 | 1.504 | 83 | 8.10 | NS |
| Error | 576 | 63.699 | 111 | 26.67 |
*** 0.001 P-value; ** 0.05 P-value; NS: Not significant.
Table 3 shows that the total variation of the experiment was largely explained by the environment (42.43% of the total sum of squares), indicating that yield was highly influenced by environmental factors. Furthermore, the results suggested that the localities were highly different. Environmental heterogeneity was determined mainly by differences in altitude, temperature, and soil nutrient availability in the field evaluations (Tab. 1). Temperature was one of the more important elements in the production behavior, in addition to the response of each genotype with the environment (Martín et al., 2017). Moreover, the phenotypic effects, expressed here as yield, were not controlled by a single gene but rather were the result of the interaction of many genes that generated a cascade of chemical reactions and were influenced by the environment (Habtamu et al., 2016).
On the other hand, the genotypes accounted for 13.84% of the variation, and the GEI explained 15.49% of the variance (Tab. 3).
These results differed from those reported by Iragaba (2014), Gedif and Yigzaw (2014), Muthoni et al. (2015) and Tirado et al. (2018), who found that the GEI accounts for a larger percentage of the variation than the environment and the genotypes, thus, explaining the behavior of yield in potato genotypes. Shahriari et al. (2018) studied the behavior of 30 potato genotypes in 10 different environments, finding that the environmental variation least explains the variability of the experiment, followed by the genotype and the GEI, which was attributed to the effect of the environment on yield.
Moreover, Hassanpanah (2011) evaluated the behavior of three potato varieties using the AMMI model, finding that yield was significantly different between environments and in response to the GEI. Lozano-Ramírez et al. (2015) stated that GEI occurs when genotypes behave differentially in response to the variation at each zone. In the absence of this interaction, yield results could be obtained from a single location and be considered universal data (Hallauer et al., 1988).
The comparison of means test (Tab. 4) showed the mean yields obtained in the four localities. Imues showed an overall mean of 31.89 t ha-1, where genotypes 68, 98, and 83 exceeded the overall mean (47.78, 47.22, 46.43 t ha-1, respectively). Additionally, in this locality, 90.5% of the genotypes exceeded the national yield (20.9 t ha-1), and mean yield of Nariño (22.2 t ha-1) (MADR, 2020). In Pasto, the average yield was 46.5 t ha-1 (Fig. 1), where genotype 83 (69.86 t ha-1), genotype 58 (68.29 t ha-1), and genotype 57 (68.24 t ha-1) showed outstanding yields that exceeded the overall mean for this locality (46.56 t ha-1) (Tab. 4). These yields were also higher than those found by Vásquez et al. (2021) and Vásquez et al. (2019), which ranged from 19.64 to 38.66 t ha-1 across eight genotypes obtained from five cycles of recurrent selection and six experimental genotypes from Baños Experimental Stations of Inca-INIA Cajamarca, respectively. In addition, Muñoz and Lucero (2008) evaluated the behavior of potatoes in the Department of Nariño with different levels of fertilization and found yields that varied between 10 t ha-1 and 13 t ha-1.
Table 4. Yields of 21 guata potato (S. tuberosum var tuberosum) genotypes evaluated in four localities of the Department of Nariño.
| Genotype | Code | Localities | |||
|---|---|---|---|---|---|
| Imues | Pasto | Pupiales | Tangua | ||
| UdenarStGua20 | 20 | 29.22 | 38.01 | 52.27 | 18.86 |
| UdenarStGua24 | 24 | 25.36 | 41.03 | 58.82 | 22.38 |
| UdenarStGua31 | 31 | 20.69 | 54.57 | 49.07 | 25.49 |
| UdenarStGua55 | 55 | 31.16 | 49.95 | 57.45 | 22.44 |
| UdenarStGua57 | 57 | 39.82 | 68.24* | 58.01 | 25.67 |
| UdenarStGua58 | 58 | 30.27 | 68.29* | 55.59 | 30.29* |
| UdenarStGua59 | 59 | 27.67 | 35.97 | 59.33 | 25.12 |
| UdenarStGua61 | 61 | 34.79 | 43.59 | 58.66 | 23.47 |
| UdenarStGua68 | 68 | 47.78* | 45.12 | 60.97 | 30.33* |
| UdenarStGua71 | 71 | 33.25 | 50.66 | 45.17 | 24.83 |
| UdenarStGua72 | 72 | 29.44 | 58.84 | 61.28 | 25.17 |
| UdenarStGua78 | 78 | 47.55* | 61.39 | 76.51** | 28.5 |
| UdenarStGua82 | 82 | 32.16 | 55.66 | 57.99 | 26.47 |
| UdenarStGua83 | 83 | 46.43* | 69.86* | 51.64 | 25.92 |
| UdenarStGua87 | 87 | 28.71 | 58.67 | 51.98 | 15.93 |
| UdenarStGua89 | 89 | 33.51 | 36.61 | 52.35 | 27.14 |
| UdenarStGua91 | 91 | 24.09 | 15.86 | 49.39 | 16.4 |
| UdenarStGua93 | 93 | 8.33 | 16.19 | 53.5 | 33.96** |
| UdenarStGua94 | 94 | 29.21 | 39.35 | 58.67 | 25.35 |
| UdenarStGua97 | 97 | 23.04 | 13.73 | 53.63 | 20.23 |
| UdenarStGua98 | 98 | 47.22* | 56.23 | 60.84 | 29.39* |
| µg | 31.89 | 46.56 | 56.34 | 24.92 | |
| Σg | 9.60 | 16.32 | 6.25 | 4.41 | |
| µg+σg | 41.49 | 62.88 | 62.59 | 29.33 | |
| µg+2σg | 51.08 | 79.20 | 68.84 | 33.75 | |
*, ** = Significant at 0.05 and 0.01, respectively; µg = overall mean; σg = standard deviation.
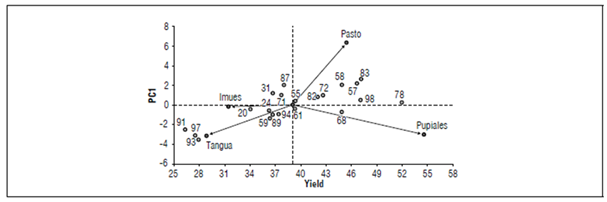
Figure 1. Graphical representation of CP1 as a function of yield for 21 guata potato (S. tuberosum var. tuberosum) genotypes evaluated in four localities of the Department of Nariño.
Pupiales showed the highest mean yield among the localities (56.34 t ha-1) (Tab. 4 and Fig. 1). This result indicated that it is the most favorable environment for the expression of yield in the different genotypes, which ranged between 45.17 t ha-1 (genotype 71) and 76.51 t ha-1 (genotype 78).
The yield reached by genotype 78 was similar to the one found by De la Cruz (2015)), who evaluated eight potato genotypes in Ecuador, obtaining a yield of 78.6 t ha-1 for the Superchola genotype in San Isidro. Furthermore, the yield of genotype 78 exceeded that reported by Roa et al. (2010) in two localities of Venezuela, who indicated yields ranging from 18.4 to 27.7 t ha-1. Possibly the genetic makeup of each genotype influences performance in the same way that the environmental variation does (Tirado et al., 2018). Overall, Pupiales exceeded the national yield by 169.6% and the departmental yield by 153.8%. These findings were attributed to the influence of soil nutrient availability, optimal temperatures for vegetative growth, precipitation, radiation, and low pressure from pests and diseases in this locality (Tirado-Lara et al., 2020).
Finally, Tangua showed the lowest overall mean among the localities, with a yield of 24.92 t ha-1 (Fig. 1). However, genotypes 93, 68, 58, and 98 showed significant means that ranged between 29.39 and 33.96 t ha-1 (Tab. 4). Probably, the altitude where the crop was established was at the lower limit of potato adaptation, which generated these low yields. De Almeida et al. (2015) maintained that temperature is one of the main variables for vegetative development and reproduction.
The results of the stability analysis are shown in table 3 and figure 1. The decomposition of the sum of squares of the GEI into principal components (PC) under the AMMI model demonstrated that the first two principal components were significant (P<0.05). The first principal component (PC1) explained 73.6% of the variation, and the second component (PC2) accounted for 18.2% of the variance. Altogether, PC1 and PC2 explained 91.8% of the inertia present in the interaction, which facilitated the analysis of the behavior of the experiment.
Table 5 shows the scalar values of the first two PCs obtained with the AMMI model, the mean of the genotypes, and the analyzed localities. The sign and magnitude of each genotype and locality in the components indicated the interaction and orientation of the interaction, which is shown in the biplot graph in figure 2. The genotypes with values close to zero for PC1 had superior yields, while those with values less than zero displayed low yields (Yan and Tinker, 2006). Values close to the origin in PC1 had higher magnitudes for the interaction, resulting in a lower GEI and more stability (Yan et al., 2000; Bassa et al., 2019). Stability is important in potato crops because it obtains progenitors that can be used in selection processes for improved potatoes (Affleck et al., 2008).
Table 5. Contribution of 21 potato (S. tuberosum var tuberosum) genotypes and four localities of the Department of Nariño to the first two principal components (PC) obtained with the AMMI model.
| Genotype | Code | Yield | PC1 | PC2 |
|---|---|---|---|---|
| UdenarStGua20 | 20 | 34.59 | -0.38 | -0.61 |
| UdenarStGua24 | 24 | 36.90 | -0.57 | 0.55 |
| UdenarStGua31 | 31 | 37.46 | 1.25 | 2.04 |
| UdenarStGua55 | 55 | 40.25 | 0.44 | 0.07 |
| UdenarStGua57 | 57 | 47.93 | 2.19 | -0.10 |
| UdenarStGua58 | 58 | 46.11 | 2.10 | 1.76 |
| UdenarStGua59 | 59 | 37.02 | -1.30 | 0.21 |
| UdenarStGua61 | 61 | 40.13 | -0.37 | -0.68 |
| UdenarStGua68 | 68 | 46.05 | -0.73 | -1.91 |
| UdenarStGua71 | 71 | 38.47 | 1.02 | -0.20 |
| UdenarStGua72 | 72 | 43.68 | 1.06 | 1.06 |
| UdenarStGua78 | 78 | 53.49 | 0.31 | -1.06 |
| UdenarStGua82 | 82 | 43.07 | 0.81 | 0.56 |
| UdenarStGua83 | 83 | 48.46 | 2.66 | -1.11 |
| UdenarStGua87 | 87 | 38.82 | 2.02 | 0.18 |
| UdenarStGua89 | 89 | 37.40 | -0.99 | -0.58 |
| UdenarStGua91 | 91 | 26.44 | -2.48 | -1.14 |
| UdenarStGua93 | 93 | 28.00 | -3.53 | 2.96 |
| UdenarStGua94 | 94 | 38.15 | -0.91 | 0.15 |
| UdenarStGua97 | 97 | 27.66 | -3.13 | -0.67 |
| UdenarStGua98 | 98 | 48.42 | 0.53 | -1.42 |
| Imues | 31.89 | -0.18 | -4.47 | |
| Pasto | 46.56 | 6.29 | 1.38 | |
| Pupiales | 56.34 | -3.04 | 0.46 | |
| Tangua | 29.20 | -3.08 | 2.63 | |
| μg genotypes | 39.93 | |||
| μg environments | 41.00 | |||
μg = overall mean
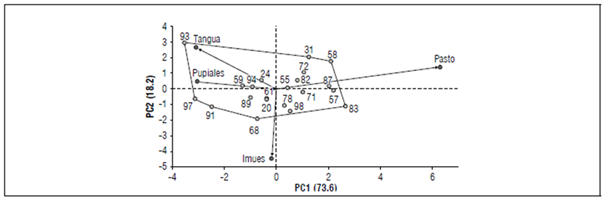
Figure 2. Biplot of tuber yield (t ha-1) in 21 potatoes (S. tuberosum var tuberosum) genotypes in four environments in the southern region of the Department of Nariño.
The biplot graph was obtained using the PCs and represented the potato genotypes and environments (Fig. 2). Genotypes 55, 78, 24, 61, 20 and 98 had an IEG close to zero, indicating that these materials had stable behaviors across the environments. Tena et al. (2019) stated that a suitable genotype would have medium to high yields that are maintained across different environments. Tirado (2019) and Mohammadi et al. (2016) stated that new potato varieties should display wide stability in multiple environments and express high productive potential. In this study, genotype 78 (53.49 t ha-1) and genotype 98 (48.42 t ha-1) showed high stability and yields above the departmental and national means (39.93 t ha-1). Accordingly, these genotypes are new promising varieties in southern Colombia.
For the environments (Tab. 5), Pupiales and Imues showed values below zero in PC1 (-3.04 and -0.18, respectively). Pupiales presented yields above the general average, 41.0 t ha-1, and Imues did not exceed the general average. On the other hand, Tangua showed a negative value for PC1 (-3.08) but had a yield below the overall mean. Moreover, Pasto showed a positive value for PC1 (6.29) and a mean yield of 46.56 t ha-1 that exceeded the overall mean. Additionally, Pasto had the best adaptation in terms of genotype performance, as represented by the length of its vector in the biplot graph. (Fig. 2) (Yan and Tinker, 2006).
Genotypes 93, 31, 58, 83, 98, 68, 91, and 97 created a polygon of variation that suggested a greater effect of the interaction on their behavior across the localities. The environments had a positive or negative effect on these materials, largely on yield. Furthermore, when a genotype vector had the same direction as the environment vector, the interaction was positive, indicating favorable adaptation (Tirado et al., 2018).
The biplot graph (Fig. 2) and the mean yield per locality (Tab. 4) indicated that genotypes 97 and 91 had a positive interaction with Pupiales, with mean yields of 53.63 and 49.39 t ha-1, respectively. These values were higher than the overall mean, as we well as the departmental and national means. Moreover, genotype 93 had a positive interaction with Tangua and a significant mean yield of 33.96 t ha-1. Thus, genotypes 97, 91, and 93 are promising for these localities. The yield was attributed to the specific environmental conditions (Tirado et al., 2018).
Similarly, genotypes 57, 87, 58, and 83 showed positive interactions with Pasto. The genotypes exceeded the mean yield in this locality (46.56 t ha-1)(Tab. 5), indicated by significant mean yields ranging from 68.24 to 69.86 t ha-1 (Tab. 4). Finally, the location of genotypes 78 and 98 in the biplot graph (Fig. 2) indicated that they were better adapted to Imues, with yields above the mean of 31.89 t ha-1 for this locality (Tab. 5).
CONCLUSIONS
The broad variation and significant effect of the environment on yield caused diverse yields per plant material in each zone. Furthermore, this study showed a differential behavior of the potato genotypes according to the growing region, which were influenced by the altitude and soil conditions of each zone.
Genotypes UdenarStGua55, UdenarStGua78, UdenarStGua24, UdenarStGua61, UdenarStGua20 and UdenarStGua98 had a low GEI, which indicated that their yields were stable; therefore, these genotypes are promising for the evaluated areas.

