


 English (pdf)
 Article in xml format
 Article references
 Send this article by e-mail
 Cited by SciELO
  Cited by Google
  Similars in
SciELO
Similars in
SciELO  Similars in Google
 Permalink
INTRODUCTION
Fusarium oxysporum is the causative agent of vascular wilt and root rot in plants and is part of a complex of more than 120 formae speciales (ff. spp.) that differ in their ability to infect certain hosts (Dean et al., 2012). F. oxysporum f. sp. lycopersici (Fol) causes significant economic losses in tomato production (Solanki et al., 2015). This pathogen can produce resilient spores called chlamydospores that may persist in the soil for more than 20 years (Michielse and Rep, 2009; Dean et al., 2012).
Fol colonizes the elements of the xylem and causes the formation of gums and tylose, obstructing and increasing resistance in rising water, and decreasing the xylem and leaf water potential (Chekali et al., 2011; Yadeta and Thomma 2013; Srinivas et al., 2019). Consequently, stomatal closure increases, and CO2 absorption is reduced in detriment of photosynthetic activity, generating decreases in the quantum efficiency of photosystem II (PSII). These disorders end up affecting the biomass accumulation capacity of the plant and, overall, resemble those caused by water stress (Lorenzini et al., 1997; Nogués et al., 2002; Yadeta and Thomma, 2013).
Light photon reception and electron transport must be regulated to maintain energy production and consumption balance. In high radiation conditions, excess energy must be dissipated to avoid photodamage to the chlorophyll reaction centers (PSI and PSII). Thus, the energy perceived by the PSII can be absorbed and redirected towards photochemical processes such as photolysis and synthesis of adenosine triphosphate (ATP) and nicotinamide adenine dinucleotide phosphate (NADPH+); this process is called photochemical quenching (qP). Meanwhile, excess energy is harmlessly dissipated as heat (non-photochemical quenching) or fluorescence, to avoid damage to the leaf. In this way, chlorophyll fluorescence is one of the best indicators for detecting early stress in plants since damage to PSII is avoided, and photosynthetic activity is preserved through energy dissipation as an acclimatization mechanism (Pérez-Bueno et al., 2019).
The chlorophyll fluorescence parameter most broadly evaluated is the maximum potential quantum efficiency of PSII photochemistry (Fv/Fm); the stability of Fv/Fm value indicates the absence of stress. The photochemical efficiency of PSII (Y(II)) reveals the amount of energy being used in the photochemical phase of photosynthesis (Melgarejo et al., 2010; Kardile et al., 2019).
Resistance inducers can be synthetic substances, components derived from plants or microorganisms, as well as Microbial or Pathogen Associated Molecular Patterns (MAMPs or PAMPs) that induce a resistance response in the plant, triggering PTI (PAMP Triggered Immunity) (Vidhyasekaran, 2016). These resistance inducers trigger signaling through hormonal pathways (Salicylic Acid: SA, Jasmonic Acid: JA, and Ethylene: ET), changes in calcium concentrations, ubiquitin-dependent protein degradation, activation of G-proteins, and phosphorylation of Mitogen-Activated Protein Kinase (MAPKs), among others. Then transcription factors or epigenetic modifications regulate the transcriptional activity of Pathogenesis-Related (PR) genes that encode antimicrobial proteins and antioxidant substances to counteract the oxidative cascades triggered during the defense response (Walters et al., 2013; Andersen et al., 2018).
One of the most studied resistance inducers in plants is chitosan (Orzali et al., 2017), a derivative of chitin present in the cell wall of some fungi, yeasts, green algae, insects, and crustaceans. Chitosan is a linear polymer comprising partially deacetylated N-acetyl glucosamine (GlcNAc) subunits (Orzali et al., 2017). If more than 50% of the GlcNAc residues are deacetylated at position 2 the heteropolymer is referred to as chitosan (Kappel et al., 2020).
Two mechanisms have been documented by which chitosan protects plants against different phytopathogenic fungi: the first one is the direct action by inhibiting mycelial growth, sporulation, and germination of conidia, mainly through membrane destabilization and cell wall weakening by interrupting the β-1,3 glucan synthesis (Kumaraswamy et al., 2018). The second mechanism is the induction of resistance in plants as a consequence of biochemical and physiological changes such as the production of Reactive Oxygen Species (ROS), the formation of callose deposits, and tissue strengthening (lignification and suberization) (Xing et al., 2015; Vidhyasekaran, 2016).
Chitosan is widely used worldwide in agriculture through commercial formulations (Walters et al., 2005; Ávila-Orozco et al., 2017). This work aimed to evaluate the effect of chitosan treatment on tomato plants at the physiological and molecular parameters during their infection with Fol.
MATERIALS AND METHODS
Biological material. This work was carried out at Corporación Colombiana de Investigación Agropecuaria, Agrosavia (Mosquera, Cundinamarca). TheFol59 strain identified as F. oxysporum f. sp. lycopersici (Fol) Race 2 (Carmona et al., 2020) was used.
Chonto type tomato seeds of the Santa Cruz Kada variety (Impulsemillas®) were used, superficially disinfected with 2% sodium hypochlorite for 10 min, followed by 70% ethanol and sterile distilled water washes. The seeds were germinated on sterile peat. The seedbeds were maintained for 30 d as done on a commercial scale.
Chitosan preparationand in vitro inhibition of Fol59 growth by chitosan. A stock solution of 10 mg mL-1 of chitosan was prepared, adding 2 g of chitosan (Sigma-Aldrich®) in 200 mL of acidified water (1% acetic acid), and the pH was adjusted to 5.6 (Hernández-Lauzardo et al., 2008).
Three molecules of chitosan (Sigma - Aldrich®) of different molecular weight (low molecular weight - LMW, medium molecular weight - MMW, high molecular weight - HMW) were used. Physicochemical characteristics of chitosan are described in table 1. PDA culture medium was prepared and supplemented with seven concentrations of chitosan (0.5, 1, 1.5, 2, 2.5, 3, and 4 mg mL-1) and a commercial product based on poly-(D) glucosamine, that was used according to the manufacturer's recommendations. Unsupplemented PDA (pH 5.6) was used as a negative control.
Table 1. Characteristics of the chitosan-based products used in in vitro and in vivo assays.
| Product | LMW | MMW | HMW | Commercial product |
|---|---|---|---|---|
| Presentation | Fine powder | Small flakes | Fine powder | Soluble concentrate |
| Viscosity (cp-centipoise) | 20-100 | 200-800 | 800-2,000 | 200-2,000 |
| Degree of deacetylation (%) | 75-85 | 75-85 | >75 | Non indicated |
| Molecular weight (kDa) | 50-190 | 190-310 | 310-375 | Non indicated |
| Manufacturer | Sigma-Aldrich | Sigma-Aldrich | Sigma-Aldrich | Bioagro |
LMW, low molecular weight; MMW, medium molecular weight; HMW, high molecular weight
A 5 mm disk was removed from the margin of 14-d-old Fol59 culture and transferred in the center of a Petri dish with a culture medium supplemented with each chitosan treatment. Five technical replicates were done, and the whole experiment was repeated three independent times (biological replicates). After incubation for 7 d at 25°C, the equation of You et al. (2016) was used to calculate the IPRG (inhibition percentage (%) on radial growth): IPRG = (C2-C1/C2)*100, where C2 is the mycelial growth area of Fol in the control treatment, and C1 is the mycelial growth area with chitosan treatment.
Effect of chitosan on tomato vascular wilt. Thirty-day-old tomato plants were treated with 10 mL of chitosan applied to the soil at different concentrations of each molecular weight considered, 24 h before transplantation. During the transplant process, plants were inoculated through the root immersion method (Jelinski et al., 2017), using a Fol59 suspension of 1·106 conidia/mL. Plants immersed in sterile water were used as absolute control, and Fol59-infected plants untreated with chitosan were used as pathogenic control. Nutritional management was based in recommendations from a soil analysis, adding 1 g of 15-15-15 (NPK) per plant.
After transplanting, plants were kept at 30°C/d and 20°C/night, with 54% relative humidity under 12 h photoperiod with a light intensity of 90 µmol m-2 s-1. The variables incidence, severity, and area under the disease progress curve (AUDPC) were evaluated from the onset of symptoms to 14 days after inoculation (DAI). The severity of the disease was established using a modified visual scale (Rongai et al., 2017) from 0 to 5, where 0 is a healthy plant, and 5 is a dead plant. AUDPC was calculated using the equation: AUDPC=∑ i Y i + Y i +1 /2∗ (t i +1 − t i ), where Y corresponds to the percentage of the disease, whether expressed as incidence or severity, while t is the time elapsed in days (Pedroza-Sandoval and Samaniego, 2009).
Physiological changes in tomato plants during the interaction with Fol and chitosan. For this test, the following treatments were evaluated: (i) Absolute control (plants treated with water), (ii) Chitosan (not infected with Fol59), (iii) Chtsn + Fol (application of chitosan, and after 24 h infection with Fol59), and (iv) Pathogen (Infection with Fol59). The concentrations of chitosan used in this experiment were selected according to the in vitro and in planta assays. Chitosan applications were made 24 h before inoculating the plants with Fol59.
Photochemical efficiency, stomatal conductance, and relative water content. The parameters Fv/Fm and Y(II) were evaluated. In the first case, a miniPAM II modulated fluorometer (Walz Germany®) was used. Stomatal conductance was measured at 3, 6, 9, 12, and 15 DAI employing an SC-1 porometer (Decagon®, USA) and the results were expressed as cm s-1. Relative water content (RWC) was calculated using the equation by Melgarejo et al. (2010): RWC=(mf-ms/mt-ms)*100, where mf corresponds to fresh mass, ms is dry mass, and mt is full turgor mass, and the results were expressed as percentage of RWC at each day.
Proline. Proline content was established using the protocol taken from Bates et al. (1973). Briefly, proline from 100 mg grounded leaf tissue was extracted using sulfosalicylic acid (3%), glacial acetic acid, acid ninhydrin and toluene. The absorbance was read at 520 nm employing a microplate spectrophotometer (Biotek®, USES). Proline was calculated using the equation given after calibrating a standard curve from 0-70 µg mL-1 of a proline standard solution: y = 0.0097x + 0.0398, with an R 2 = 0.98; the results were expressed in µg g-1 of fresh weight.
Photosynthetic pigments. Carotenoid and chlorophyll a and b contents were calculated in µg mL-1 after extraction using the protocol described by Rojas-Tapias et al. (2012). Briefly, pigments were extracted from 10 mg of fresh leaf tissue incubating on 1 mL of dimethyl sulfoxide (DMSO) for 2 h at 96°C. Absorbance was detected in a microplate spectrophotometer (Biotek®, USA) using wavelengths of 649 nm and 665 nm for chlorophylls, and 480 nm for carotenoids. The concentration was calculated according to the equations indicated by Wellburn (1994) as follows: C a =12.19A 665 -3.45A 649 ; C b =21.99A 649 -5.32A 665 ; Cx+c=(1,000A480-2.14Ca-70.16b)/220, with C a is chlorophyll a, C b is chlorophyll b, and C x+c corresponds to carotenoids.
Dry mass.Complete plants (stem, leaves and roots) of 15 DAI were dried in an oven at 60°C for 48 h to establish the accumulation of dry mass. Results were expressed as g of dry mass per plant at 15 DAI.
Effect of chitosan on the expression of defense marker genes in tomato plants infected with Fol. Plants were first treated with chitosan, and 24 h after this treatment, the same plants were infected with Fol59, then after 48 h of Fol59 inoculation (72 h after chitosan treatment), the foliar part of the plants was collected, and quickly frozen in liquid nitrogen. Subsequently, total RNA was extracted using the protocol by Yockteng et al. (2013). The following treatments were assessed: (i) Control (plants treated with water), (ii) Chitosan (not infected with Fol), (iii) Chtsn+Fol (application of chitosan and subsequent infection with Fol59), and (iv) Pathogen (Infection with Fol59).
The iScript™ cDNA Synthesis Kit (Bio-Rad®) was used for cDNA synthesis, and the quantitative real-time polymerase chain reaction (qRT-PCR) was performed using the iScript™ One-Step RT-PCR Kit (Bio-Rad®), marking with SYBR® Green (Bio-Rad®), following the manufacturers’ recommendations. Defense-related genes involved in salicylic acid (SA) signaling (PAL-PHENYLALANINE AMMONIA LYASE and PR1a-PATHOGEN RESPONSE1), and Jasmonic Acid (JA) signaling (LOXA-LIPOXYGENASE A), and the Ethylene-Response gene (ET) (ERF1- ETHYLENE RESPONSE FACTOR1) were evaluated. The tomato gene EF1a (elongation factor) was used to normalize the expression. Each reaction was performed in triplicate with two biological replicates. ΔCT values were compared, as described by Soto-Suárez et al. (2017). The sequence for all primers used in this work are in table 2.
Table 2. Primers used in this study for qRT-PCR analysis.
| Primer name | Sequence | Gene and signalling pathway | Reference |
|---|---|---|---|
| EF1a_F | GATTGGTGGTATTGGAACTGTC | EF1a, normalizing gene. Tomato elongation factor | Martínez-Medina et al. (2013) |
| EF1a_R | AGCTTCGTGGTGCATCTC | ||
| ERF1_F | GAGGGGTCCTTGGTCTCTACTC | ERF1, response factor to ethylene and jasmonic acid | Huang et al. (2004) |
| ERF1_R | ACAGCAGCTGGAGATAATCCAT | ||
| LOXA_F | GAAAAACCCCGATAAGGCAT | LOXA, Lipoxygenase A, induced by MeJA (Methyl Jasmonate) | León-Morcillo (2012) |
| LOXA_R | AGGAGACTCTCGTTGTCCGA | ||
| PAL_F | CGTTATGCTCTCCGAACATC | PAL, Phenyl alanine ammonia lyase, SA biosynthesis | Martínez-Medina et al. (2013) |
| PAL_R | GAAGTTGCCACCATGTAAGG | ||
| PR1a_F | GTGGGATCGGATTGATATCCT | PR1a, Inducible by salicylic acid | Martínez-Medina et al. (2013) |
| PR1a_R | CCTAAGCCACGATACCATGAA |
Experimental design and data analysis.All experiments were performed separately at least twice, according to a complete randomized blocks design with a one-plant experimental unit. Measurements were taken every 3 d until 14 DAI for AUDPC analysis and 15 DAI for physiological parameters. The non-destructive samplings had ten plants, and the destructive samplings included five plants on each sampling day. Physiological variables were measured on the terminal leaflet of the third fully expanded leaf of each plant. The Statistix 8.0 software was used for data analysis. The normality of the data distribution was verified, and subsequently, a Kruskal-Wallis non-parametric test with α = 0.05 was performed.
RESULTS
Effect of chitosan on Folmycelial growth
All the molecules evaluated reduced the radial growth of Fol59 at a concentration of 1.5 mg mL-1 (Fig. 1). As the concentration of the chitosan in the culture medium increased, mycelial growth inhibition was higher (Tab. 3). Of the three molecules (LMW: low molecular weight, MMW: medium molecular weight, and HMW: high molecular weight), the LMW chitosan inhibited the growth of Fol59 at the lowest concentrations to the control (0.5 and 1 mg mL-1) (Fig. 2).
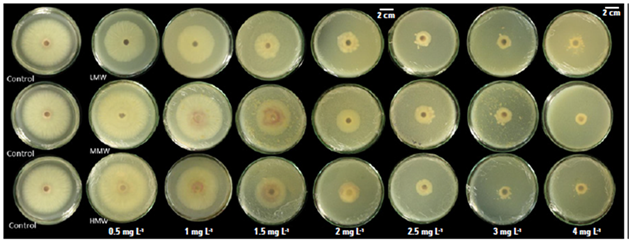
Figure 1. Different chitosan molecules in increasing concentrations inhibit Fol59 mycelial growth under in vitro conditions at seven days after incubation at 25°C.
Table 3. Inhibition percentage on radial growth of Fol59 after 7 d of chitosan application at different concentrations and molecular weights.
| Concentration (mg mL-1) | LMW | MMW | HMW |
|---|---|---|---|
| 0.5 | 22.7±3.1 de | -21.3±5.3 d | -20.4±3.8 e |
| 1 | 24.8±3.4 de | 11.4±4.8 cd | 5.6±3.9 de |
| 1.5 | 65.5±1.5 cd | 45.6±2.3 bcd | 53.6±1.6 cde |
| 2 | 81.5±0.7 bcd | 72.1±1.9 abc | 76.6±1.9 bcd |
| 2.5 | 89.9±0.6 abc | 83.8±0.8 ab | 90.1±0.5 abc |
| 3 | 92.4±0.4 ab | 90.7±0.4 a | 95.8±0.2 a |
| 4 | 94.0±0.3 a | 92.5±0.7 a | 94.9±0.2 ab |
| Commercial | -24.5±5.1 e | -24.5±5.1 d | -24.5±5.1 e |
± indicate the standard error (n=15). Equal letters indicate that there are no statistically significant differences according to Kruskal-Wallis (α = 0.05; P = 0.0000; df = 59; F = 66.4).
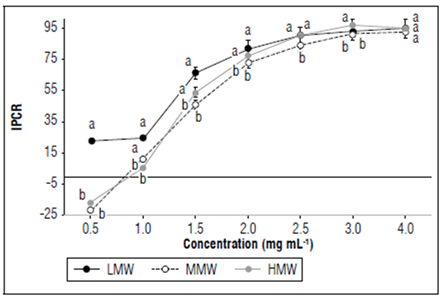
Figure 2. Different chitosan molecules in increasing concentrations inhibit Fol59 growth under in vitro conditions at 7 DAI (α= 0.05; P value=0.0000 df=59; F=66.4). Equal letters indicate that there are no statistically significant differences according to Kruskal-Wallis (α = 0.05). Bars indicate the standard error (n=15).
Low concentrations of MMW, HMW and commercial chitosan promoted the growth of Fol (Tab. 1), and that fact can be related to the hormesis phenomenon, which is defined as the response of organisms to a toxic component, which in low concentrations produces a beneficial effect. This response is related to a metabolic overcompensation, triggered by an adaptive response to stress induced by a determined substance (Vargas-Hernandez et al., 2017).
Effects of chitosan on the reduction of vascular wilt caused by Fol in tomato plants
Disease severity in plants treated with LMW and MMW chitosan were significantly lower with the 2.5 and 3 mg mL-1 treatments (Fig. 3, α = 0.05; P = 0.0000; F = 10.2; df = 159) in comparison to the pathogen treatment. Regarding the efficacy of chitosan supplementation on severity, the highest value reached was 91% (LMW: 2.5 mg mL-1), followed by 85% (LMW: 3 mg mL-1) and 78% (MMW: 3 mg mL-1) (Tab. 4). In agreement with what was found in vitro, the low concentrations of chitosan were not able to effectively decrease the expression of the disease.
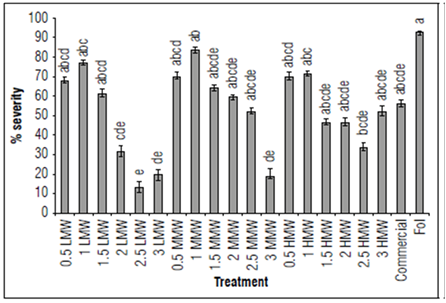
Figure 3. Results of the effect of chitosan severity of the disease 14 DAI in terms of percentage. The data are means of 40 replicates. Bars indicate the standard error (n=20). Equal letters indicate that there are no statistically significant differences according to Kruskal-Wallis (α = 0.05).
Table 4. Effect of chitosan on the AUDPC of incidence and severity, and the efficacy on incidence and severity in infected plants with Fol59.
| Molecule | Concentration (mg mL-1) | Incidence | Severity | ||
|---|---|---|---|---|---|
| AUDPC | % efficacy | AUDPC | % efficacy | ||
| LMW | 0.5 | 390±4.1 abcdef | 5.0±3.9 bc | 196±3.5 abcdef | 20.6±3.3 bcd |
| 1 | 670±8.8 abc | 0.0±0.0 c | 318±4.3 abc | 0.1±9.0 cd | |
| 1.5 | 360±5.2 abcdef | 20.0±5.0 abc | 181±3.9 abcdef | 33.3±3.6 abcd | |
| 2 | 210±5.2 def | 45.0±4.3 abc | 84±3.8 def | 61.2±2.8 abc | |
| 2.5 | 80±6.0 f | 70.0±5.5 a | 28±3.8 f | 90.9±1.2 a | |
| 3 | 113±13.7 ef | 67.5±2.2 a | 45±7.1 ef | 85.0±1.3 ab | |
| MMW | 0.5 | 583±7.1 abc | 7.5±5.1 bc | 284±5.7 abcd | 7.9±3.0 cd |
| 1 | 715±3.0 ab | 5.0±5.9 bc | 371±2.9 ab | -17.0±8.2 d | |
| 1.5 | 498±15.7 abcdef | 12.5±4.8 abc | 223±11.1 abcdef | 14.6±6.1 abcd | |
| 2 | 530±3.9 abcd | 10.0±4.5 abc | 237±3.3 abcde | 26.2±2.4 abcd | |
| 2.5 | 341±9.2 bcdef | 15.0±5.6 abc | 155±6.3 bcdef | 43.0±3.7 abcd | |
| 3 | 291±17.9 bcdef | 50.6±2.1 ab | 79±8.1 def | 78.4±1.7 ab | |
| HMW | 0.5 | 503±6.1 abcde | 12.5±4.8 abc | 296±6.5 abcd | 7.4±5.3 cd |
| 1 | 695±7.0 abc | 5.0±3.9 bc | 353±4.4 abc | -2.8±7.7 cd | |
| 1.5 | 378±8.8 abcdef | 17.5±3.7 abc | 155±5.7 bcdef | 51.5±3.0 abcd | |
| 2 | 303±11.0 bcdef | 22.5±5.7 abc | 132±9.2 bcdef | 58.6±2.8 abcd | |
| 2.5 | 265±6.6 cdef | 45.0±4.4 abc | 120±5.1 cdef | 60.3±3.8 acd | |
| 3 | 363±6.1 abcdef | 32.5±5.9 abc | ±6.1 abcdef | 55.9±4.1 abcd | |
| Commercial | 350±7.3 bcdef | 20.0±4.5 abc | 164±5.8 abcdef | 37.0±2.4 abcd | |
| Pathogen | 915±4.3 a | 0±0.0 bc | 504±3.8 a | 0±0.0 cd | |
| Control | 0±0.0 f | 100.0±0.0 a | 0±0 f | 100.0±0 a | |
± corresponds to standard error (n=40). Equal letters indicate that there are no statistically significant differences according to Kruskal-Wallis (α = 0.05).
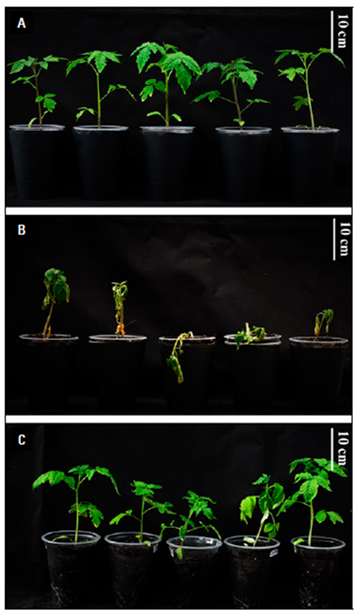
The results showed the protective effect of chitosan against vascular wilt (Fig. 4), and the best performance of the LMW (2.5 mg mL-1) treatment; therefore, it was selected for the following tests.
Effect of chitosan on physiological parameters of tomato plants infected with Fol
The results on Fv/Fm and Y(II) indicate a reduction in photosynthetic processes due to the infection by Fol59 (Fig. 5). To investigate if chitosan can mitigate the early tomato stress conditions caused by Fol59, we measured photosynthesis efficiency (Fv/Fm). In this experiment, the Fv/Fm decreased in the infected plants from 9 DAI, observing a decrease of up to 70% at 15 DAI in plants inoculated with Fol59 compared to uninfected control plants (Fig. 5A). Contrastingly, in the Chtsn + Fol treatment (plants applied with chitosan 24 h before being infected with Fol), the Fv/Fm was 7.5% lower than the absolute control (control). In plants infected only with Fol (pathogenic treatment), the Fv/Fm were significantly different (P = 0.000; F = 15.3; df = 79).
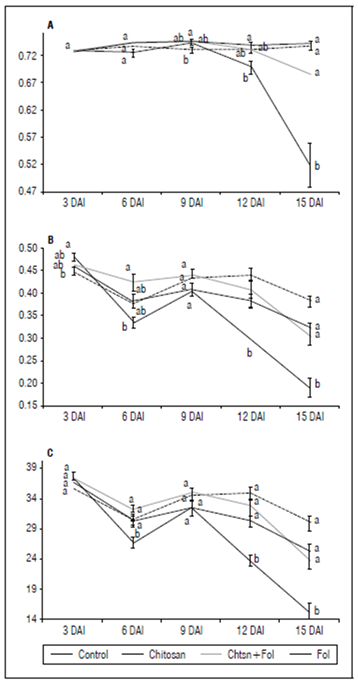
Figure 5. A) Fv/Fm progress for 15 d; B) Y(II) progress for 15 d; C) Electron Transfer Rate (ETR). Control (plants treated with water); Chitosan (not infected with Fol59), Chtsn + Fol (application of chitosan and subsequent infection with Fol59); Fol (Infected with Fol59). Bars correspond to the standard error (n=20). Equal letters indicate that there are no statistically significant differences according to Kruskal-Wallis (α = 0.05).
Y(II) parameter decreased at 6 DAI in the Fol treatment, although with a slight rebound on day nine after inoculation (Fig. 5B). Subsequently, the Y(II) value for the plants infected with Fol59 decreased significantly (P = 0.000; F = 18; df = 79). Lower Y(II) values represent decreases in the energy flow destined for the ATP and NADPH production. Plants previously treated with chitosan and then infected with Fol59 (Chtsn + Fol) showed a lower decrease in Y(II) values (5%) compared to plants only infected with Fol59 (41%). The results obtained in Fv/Fm and Y(II) suggest an important role of the treatment with chitosan, mitigating the damage by Fol on the light phase of tomato photosynthesis.
Dry mass
The accumulation of biomass in the plant under stress conditions depends on the adequate use of energy for direct metabolic and photosynthetic processes, constituting an indicator of plant health (Fig. 6). To gain an insight into the effect of the chitosan application on tomato plant health infected with Fol59, the accumulation of biomass was evaluated.
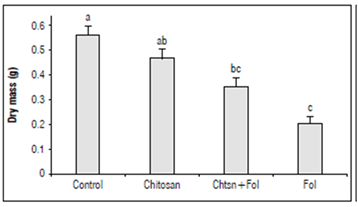
Figure 6. Dry mass accumulation 15 DAI in tomato plants with different treatments. Control (plants treated with water); Chitosan (not infected with Fol59), Chtsn + Fol (application of chitosan and subsequent infection with Fol59); Fol (infected with Fol59). Bars correspond to the standard error (n=20). Equal letters indicate that there are no statistically significant differences according to Kruskal-Wallis (α = 0.05).
Our results indicate that 15 DAI, Fol59 infection significantly affects the biomass accumulation in plants, decreasing from 36 and 62% in the Chtsn + Fol and Fol treatments, respectively, compared to the control (P = 0.000; F = 20; df = 79). The two treatments with Fol59 inoculated plants did not differ significantly between them.
Proline content
At 15 DAI, the proline content in the plants infected with Fol59 was nine times higher than the control, and in the Chtsn + Fol treatment, the values were six times higher compared to the control. The proline values were significantly higher in the treatments inoculated with Fol59 compared to those not inoculated (Tab. 5, P = 0.000; F = 10.4; df = 39).
Table 5. Prolinecontent measured in the different treatments.
| Treatment | Proline |
|---|---|
| Control: plants treated with water | 6.1±0.69 b |
| Chitosan: not infected with Fol59 | 4.8±0.72 b |
| Chitosan+Fol: application of chitosan and subsequent infection with Fol59 | 38.6±8.35 a |
| Pathogen: infected with Fol59 | 54.4±9.02 a |
± corresponds to standard error (n=10). Equal letters indicate that there are no statistically significant differences according to Kruskal-Wallis (α = 0.05).
Stomatal conductance
One of the most well-known alterations produced during Fol infection is the difficulty by the plant in absorbing water and nutrients (Yadeta and Thomma, 2013), inducing stomatal closure. At 9 DAI, a 40% decrease in gs in the Fol treatment compared to the Chtsn + Fol treatment (Tab. 6) is explained by the proliferation of the pathogen in the xylem. This trend was maintained until 15 DAI, where the gs was 87% lower in the Fol treatment plants compared to the control treatment; meanwhile, in the Chtsn + Fol treatment, the reduction was 52% compared to the control. Despite not detecting significant differences between the Fol and Chtsn + Fol treatments, it seems that chitosan-treated plants show less hydric stress and less stomatal closure than the plants only infected with Fol59.
Relative water content (RWC)
The RWC remained stable in the first phase of the infection (6 DAI) and began to decrease at 9 DAI in plants infected with Fol59 (Tab. 6). It is important to note that after 9 DAI, the RWC was 10% higher in the chitosan treatment compared to the absolute control, suggesting that an optimization of the water use may be induced by chitosan. However, there were no significant differences between the inoculated treatments; therefore, in the Chtsn + Fol treatment plants, this effect does not seem sufficient to mitigate the water limitations caused by the pathogen.
Chlorophyll content
The chlorophyll content is shown in the table 6 and was stable until 12 DAI. From 15 DAI in the plants of the pathogenic treatment, chlorophylls a and b showed a decrease of 39% to the control; meanwhile, in the Chtsn + Fol treatment, the contents remained stable without significant differences compared to the control (Tab. 6). The carotenoid content was not altered in any of the treatments during the experiment. The decrease in chlorophyll concentrations is consistent with the appearance of chlorosis in plants only infected with Fol.
Table 6. Physiological variables evaluated.
| Treatment | Fv/Fm | qP | Y(II) | gs | RWC (%) | Chlorophyll a | Chlorophyll b | Carotenoids |
|---|---|---|---|---|---|---|---|---|
| Day 3 | ||||||||
| Control | 0.729±0.003 | 0.682±0.014 | 0.463±0.008 | - | 62.1±4.4 | 5.392±0.104 | 1.677±0.031 | 0.948±0.022 |
| Chitosan | 0.724±0.003 | 0.679±0.011 | 0.449±0.008 | - | 58.4±2.6 | 4.711±0.147 | 1.528±0.043 | 0.811±0.025 |
| Chitosan+Fol | 0.725±0.004 | 0.710±0.011 | 0.469±0.008 | - | 59.2±3.1 | 3.989±0.154 | 1.318±0.039 | 0.765±0.021 |
| Pathogen | 0.728±0.003 | 0.700±0.013 | 0.480±0.008 | - | 61.5±2.9 | 4.836±0.078 | 1.584±0.024 | 0.783±0.016 |
| Day 6 | ||||||||
| Control | 0.726±0.010 | 0.645±0.019 | 0.381±0.017 | - | 77.4±7.2 | 5.899±0.079 | 1.959±0.027 | 0.768±0.010 |
| Chitosan | 0.739±0.003 | 0.644±0.014 | 0.375±0.008 | - | 62.6±2.8 | 4.539±0.107 | 1.538±0.035 | 0.588±0.017 |
| Chitosan+Fol | 0.744±0.003 | 0.681±0.013 | 0.423±0.019 | - | 65.8±4.2 | 6.170±0.061 | 2.102±0.018 | 0.858±0.014 |
| Pathogen | 0.725±0.010 | 0.610±0.014 | 0.336±0.012 | - | 62.7±3.7 | 6.827±0.058 | 2.361±0.019 | 0.881±0.014 |
| Day 9 | ||||||||
| Control | 0.743±0.004 | 0.663±0.017 | 0.407±0.014 | 878.81±44.55 | 70.2±4.6 | 5.038±0.114 | 1.759±0.040 | 0.672±0.019 |
| Chitosan | 0.732±0.003 | 0.683±0.027 | 0.431±0.012 | 928.36±69.43 | 77.7±2.8 | 4.225±0.068 | 1.491±0.022 | 0.547±0.016 |
| Chitosan+Fol | 0.746±0.003 | 0.694±0.010 | 0.441±0.011 | 525.02±86.27 | 57.0±3.1 | 6.122±0.098 | 2.211±0.034 | 0.795±0.015 |
| Pathogen | 0.744±0.004 | 0.624±0.021 | 0.405±0.016 | 315.01±110.83 | 51.7±2.7 | 5.988±0.122 | 2.128±0.039 | 0.837±0.020 |
| Day 12 | ||||||||
| Control | 0.739±0.004 | 0.603±0.016 | 0.383±0.015 | 664.31±84.79 | 85.6±2.6 | 4.959±0.161 | 1.751±0.042 | 0.613±0.020 |
| Chitosan | 0.736±0.004 | 0.688±0.013 | 0.438±0.013 | 789.26±66.69 | 91.5±3.9 | 4.599±0.058 | 1.664±0.017 | 0.574±0.013 |
| Chitosan+Fol | 0.731±0.004 | 0.630±0.024 | 0.407±0.019 | 231.50±64.42 | 71.3±3.4 | 4.131±0.122 | 1.493±0.036 | 0.512±0.016 |
| Pathogen | 0.698±0.012 | 0.548±0.015 | 0.299±0.012 | 39.73±4.79 | 61.4±6.4 | 3.236±0.113 | 1.204±0.039 | 0.372±0.014 |
| Day 15 | ||||||||
| Control | 0.742±0.003 | 0.519±0.015 | 0.322±0.012 | 272.57±30.97 | 74.6±5.1 | 6.002±0.154 | 2.182±0.055 | 0.661±0.020 |
| Chitosan | 0.738±0.003 | 0.617±0.015 | 0.383±0.013 | 290.84±28.00±28.00 | 81.0±4.5 | 6.880±0.147 | 2.479±0.048 | 0.827±0.031 |
| Chitosan+Fol | 0.687±0.027 | 0.537±0.021 | 0.304±0.020 | 131.91±20.54 | 67.1±5.5 | 6.500±0.150 | 2.264±0.050 | 0.884±0.027 |
| Pathogen | 0.519±0.039 | 0.453±0.032 | 0.190±0.021 | 33.09±3.56 | 59.2±5.1 | 3.674±0.199 | 1.332±0.061 | 0.594±0.039 |
Control, plants treated with water; Chitosan: not infected with Fol59; Chitosan+Fol: application of chitosan and subsequent infection with Fol59; Pathogen: infected with Fol59.
Effect of chitosan on the expression of defense marker genes in tomato plants infected with Fol
The differential expression of the PR1a, ERF1, PAL, and LOXA genes in leaves and stems was evaluated after 72 h of chitosan application and 48 h after infection with Fol59 (Fig. 7). As an interesting result, in the chitosan treatment (without Fol59 inoculation), the ERF1, LOXA, and PAL genes were not differentially expressed compared to the control, while the PR1a gene was expressed 3.6 times more compared to the control.
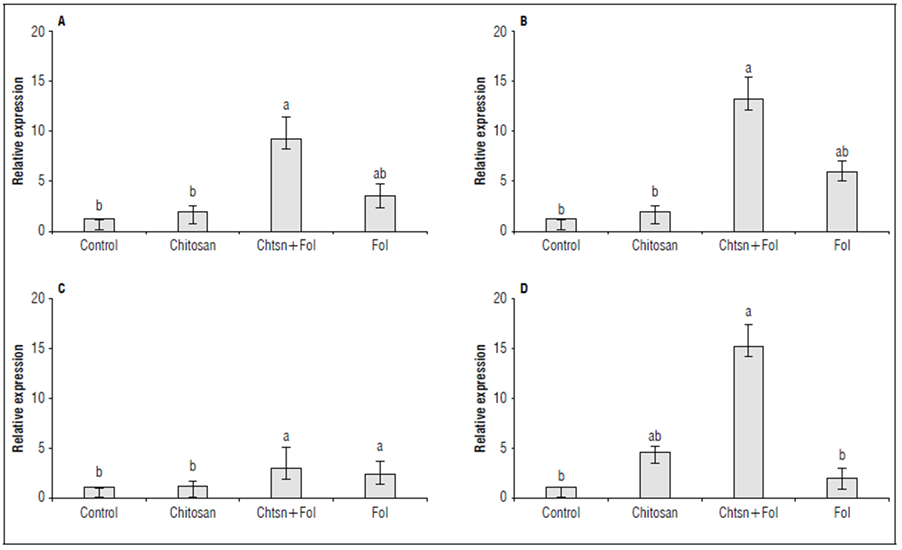
Figure 7. Differential expression of the defense genes A) ERF1 (ET/JA) (P = 0.0002; F = 16.1; df = 17); B) LOXA (JA) (P = 0.0000; F = 30.3; df = 17); C) PAL (SA) (P = 0.0002; F = 16.1; df = 17), and D) PR1a (SA) (P = 0.0221; F = 4.96; df = 17) in tomato plants subjected to different treatments. Standardized data with respect to the control (= 1). Control (plants treated with water); Chitosan (not infected with Fol59), Chtsn + Fol (application of chitosan and subsequent infection with Fol59); Fol (infected with Fol59). Bars correspond to the standard error (n=6). Equal letters indicate that there are no statistically significant differences according to Kruskal-Wallis (α = 0.05).
For the Chtsn + Fol treatment, all genes were differentially expressed compared to the control. The PAL, ERF1, LOXA, and PR1a genes were expressed 1.8, 8.2, 12.2, and 14.2 times more, respectively, compared to the control plants. This result suggests that 72 h after applying chitosan and 48 h after Fol59 inoculation, detection of the pathogen activates a systemic response that extends to the aerial part of the plant, even when the infection has not spread to that level. On the other hand, in the Fol treatment, the PR1a gene did not differ from the control (0.9 times more than the control), while the ERF1, LOXA, and PAL genes were expressed 2.2, 4.9, and 1.3 times more than the control.
DISCUSSION
The high in vitro growth inhibition of chitosan on Fol59 is probably due to the antimicrobial mechanisms of chitosan on fungi, affecting mainly cell walls by inhibition in glucan biosynthesis and destabilization of cell membranes (Xing et al., 2015; Kumaraswamy et al., 2018). In our research, chitosan exerts antifungal activity in vitro. El-Mohamedy et al. (2019) and Soliman and El-Mohamedy (2017)) found that HMW and LMW chitosan effectively inhibited the growth of fungal pathogens and that this inhibition increased depending on the concentration. Besides, the results indicated that growth and sporulation decreased significantly when the LMW molecule was used compared to the HMW molecule.
The efficacy of LMW chitosan was consistent in vitro and in planta assays and, in accordance with other studies for plant pathogens, including F. oxysporum (Tikhonov et al., 2006; Zhang et al., 2017), highlighting the physicochemical properties of chitosan and its ability to induce resistance in plants against phytopathogens (Orzali et al., 2017). The process is presumed to occur by binding the chitosan molecule to the plant cell membrane, initiating signaling by hydrogen peroxide (H2O2) and nitric oxide (NO) in photosynthetic plastids (Kauss et al., 1989), triggering antioxidant substance synthesis and abscisic acid (ABA), which ends in the induction of stomatal closure, gene activation and other responses related to biotic stress (Zhang, 2004).
Fv/Fm has been widely used as a stress indicator in plants, and its values decrease according to the severity of the stress. This parameter represents a measure of the photon absorption capacity by PSII intended to reduce plastoquinone A, and is a sensitive indicator of plant photosynthesis, whose optimal values are around 0.83 in stress-free plants (standard for a wide variety of plant species) (Maxwell and Johnson, 2000). Decreases in Fv/Fm values are a clear indicator of severe stress that is causing damage to the photosynthetic apparatus (Goltsev et al., 2016). Plants inoculated with F. oxysporum, with a severity level of 92%, (Wagner et al., 2006) reported a decrease in Fv/Fm to 0.343, highlighting the relationship between this variable and disease stress. In this work, the fact of not finding significant differences in the Fv/Fm in untreated plants (absolute control) compared to plants only treated with chitosan, reinforces the potential of using chitosan as an alternative Fol control without the appearance of phytotoxic effects.
In this work, the reduction in Fv/Fm occurred after 9 DAI, long after the first symptoms appeared (6 DAI), suggesting that in the initial stages of infection, no irreversible damage occurs in the PSII and that this happens as a consequence of the xylem obstruction by the pathogen and a decrease in stomatal conductance. Segarra et al. (2010) described a decrease of 24% in Fv'/Fm' after 31 d of inoculation with Fol.
Furthermore, according to our results, Fol seriously compromises the photochemical processes of photosynthesis through the energy flow. This result is similar to the one reported by Nogués et al. (2002), where Fol infection decreased by 50% the Y(II) in tomato plants. Besides, decreases in Fv/Fm and electron transfer rate (Fig. 5) were found in the current study, leading to a decrease in ribulose-1,5-bisphosphate carboxylase/oxygenase (Rubisco) activity. In this sense, Pshibytko et al. (2006) attributed this result to a decrease in electron transport due to decreases in the acceptor flux in quinone A (QA) of the PSII.
The symptoms caused by Fol infection have previously been related to disorders caused by water stress (Duniway, 1971); for example, decreases in the photosynthetic rate of infected plants have been correlated with the consequences of the decrease in gs, such as the water state and gas exchange (CO2 absorption) (Lorenzini et al., 1997; Nogués et al., 2002). Segarra et al. (2010) reported that one of the first responses of tomato plants in diseases caused by Fusarium is stomatal closure; with this reaction, the plant seeks to keep its water state stable under different conditions; however, if these conditions are prolonged, alterations occur in other processes. Our study suggests that in the treatments where the plants were inoculated with Fol, water limitations occurred due to vascular obstructions, so the plants responded by closing their stomata, avoiding water loss.
The increase in the concentration of proline in the tissues 15 DAI seems to be more an indicator of severe stress (Alsamir et al., 2017). In agreement with the gs and RWC parameters, the increase in proline content occurred as a response to water shortage to maintain an osmotic adjustment in the leaves. Thus, the reductions in gs and RWC found in Fol infected tomato plants cause a decrease in energy flow observed in the fluorescence variables during the development of vascular wilt (Pshibytko et al., 2006).
The maintenance of chlorophylls integrity by chitosan suggests that after its application, protection mechanisms of the apparatus and photosynthetic pigments are activated in the plant. Similar results were obtained in other studies where the photosynthetic performance (30-60%) and the concentrations of chlorophylls and carotenoids were higher (30-74%) in plants that were treated with chitosan compared to their controls (Dzung et al., 2011; Van et al., 2013). According to our results, the chitosan application activates protective mechanisms such as the accumulation of proline, contributing in part to the protective capacity of membranes and proteins (Soliman and El-Mohamedy, 2017). All the defense processes of the plant require the use of energy so that in addition to the direct alterations of the pathogen in the plant (i.e., water flow, CO2 uptake and assimilation, oxidative stress, and photosynthetic damage) (Yadeta and Thomma, 2013), the metabolic cost of defense due to the diversion of resources causes a significant decrease in biomass accumulation (Huot et al., 2014).
The results obtained in the expression of defense genes are congruent with those reported in other works where the expression of various defense genes occurs after 72 h of treatment with chitosan and other resistance inducers in tomato plants (Jamiołkowska, 2020). These results were related to a lower expression of the disease caused by R. solanacearum and Fol, indicating that chitosan induces priming of plant defenses (Zehra et al., 2017).
The PR1a protein has been reported to have antimicrobial properties against different pathogens and it is synthesized as part of the SAR response in plants, associated with the accumulation of SA (Jia et al., 2016). In other pathosystems such as tomato-Fusarium andiyazi, chitosan activates the PR1 and SOD genes, indicating SA-mediated defense and antioxidant response co-occur (Chun and Chandrasekaran, 2019); similarly, in the kiwi-Pseudomonas syringae pv. actinidiae pathosystem, the application of chitosan induced 3.5 times the expression of the PR1 gene when compared to the control (Beatrice et al., 2017). Knowing that Fol is a hemibiotrophic pathogen, the defense response of the plant is initially directed towards the biotrophic phase of the pathogen (mediated by the SA pathway) (Chowdhury et al., 2017). The gene expression results indicate that chitosan presumably induces the plant to strengthen its immune system in presence of pathogens in a primming-like response, highlighting the potential of chitosan as a preventive, biocompatible, and non-toxic strategy for disease management (Maluin and Hussein, 2020).
CONCLUSION
The disease control capacity expressed by chitosan LMW (2.5 mg mL-1), under favorable conditions for the establishment of the pathogen, reveals that this molecule has a high control potential against Fol. The physicochemical characteristics of chitosan and its biodegradability, together with the results presented here, making chitosan an excellent candidate for its use in sustainable disease management and clean agricultural production. This study validates chitosan as a strong candidate to produce an agroecologically sustainable bioproduct, for controlling Fol on tomato crops from specific microenvironments in Colombia.

