


 English (pdf)
 Article in xml format
 Article references
 Send this article by e-mail
 Cited by SciELO
  Cited by Google
  Similars in
SciELO
Similars in
SciELO  Similars in Google
 Permalink
INTRODUCTION
Resolving significant problems in daily life depends on the active participation of affected people in the research process, where the researcher in turn must be involved as an agent of social change (Jimenez Montero, 2020). The approach to common problems is well-defined in the concept Participatory Action Research (PAR), developed by Orlando Fals Borda in Latin America (Colmenares, 2012), which is a “reflective, systematic, controlled and critical procedure that aims to study an aspect of reality with an explicit practical purpose” (Bacher-Martínez, 2017, p. 312, own translation). It includes the acquisition and organization of knowledge and intervention. It is participatory through direct and active involvement of the community in transforming knowledge and reality (Bacher-Martínez, 2017).
PAR is similar to the strategy of participatory appraisal (Osorio and Contreras, 2009), which in the context of agricultural production systems, served as the basis for the emergence and development of Participatory Rural Appraisal (PRA), proposed by Robert Chambers in the 1980s (Omondi, 2020). In PRA, community members become analysts, observers, researchers, historians and cartographers. This methodology uses role reversal and visual media, such as mapping, which are more useful for obtaining information with illiterate people than surveys and interviews (Román Bermejo, 2016; Omondi, 2020). From PRA, participatory mapping (PM) emerges as a way to collect oral information in communities with different levels of literacy and as a mechanism to improve participation, dialogue and negotiation (FIDA, 2010), actively involving communities in a research process (Martín et al., 2019). The map production process is carried out by a group of people who try to visually demonstrate the relationships between themselves and their spatial environment. Therefore, maps are a result of the knowledge on the territory, its nuances, potentialities, and limits (Chambers, 2006) and are “a collective construction adjusted to the culture of oral narrators and restatements of the individual and collective memory” (Carvajal, 2005, p. 6, own translation).
Because PM is a flexible methodology that adapts to different budgets, geographical and cultural scenarios, it became very popular in the 1990s within indigenous and peasant organizations in Latin America (Honduras, Panama, Colombia); thanks to PM, it is possible to standardize the knowledge of local inhabitants to outline the recognized space and transform it into conventional maps with the consent of the community (Herlihy and Knapp, 2003; Braceras, 2012; Herlihy and Taylor, 2019).
There are several examples of the contributions that PM has made to the development and improvement of information systems in communities in the Americas, Africa, Asia, Australia, New Zealand, Thailand, China and Cambodia (McConchie and McKinnon, 2002). In Honduras, PRA with maps was useful for locating twelve new indigenous territorial jurisdictions (Herlihy and Taylor, 2019). In southern Africa, PM identified key resource areas that support local livelihoods in the Kavango-Zambezi Transfrontier Conservation Area, which covers parts of Angola, Botswana, Namibia, Zambia and Zimbabwe (Bailey et al., 2020).
Vélez et al. (2012) used participatory and collaborative mapping to characterize socio-environmental conflicts in three territories in the upper Cauca River basin, in the southwest of Colombia; the authors stated that, although cartography generates both a technical and symbolic distortion of reality, it presents an opportunity for the announcement and systematization of local knowledge on the inhabited space, as well as for the denouncement of perceived conflicts and injustices.
In Colombia, the pea is produced in 11 departments and is one of the basic products of the peasant economy for small and medium producers. The main producers are in Nariño, Cundinamarca and Boyaca, with 5,500; 2,100 and 2,240 cultivated hectares, respectively, and an average yield of 5.2 t ha-1 (Agronet, 2021). It is estimated that more than 26,000 producers depend on this crop, generating around 2.3 million wages and about 15,000 direct jobs (Fenalce, 2017). Despite its economic importance, pea producing areas are subject to different risks, such as the incidence of late frosts, water stress and high temperatures during the flowering stage (Gonzalez and Ligarreto, 2006).
Agroclimatic risk could be defined as the series of negative impacts of climate change and variability on the agricultural sector (Beddington et al., 2011). The vulnerability of small agriculture to the effects of climate variability and change is a consequence of the lack of appropriate technification, deficient existence and/or access to agroclimatic information and its socioeconomic marginality.
For this reason, community organization guides actions related to participatory planning of land use, management of natural resources and generation of information from communities for the improvement of decision-making processes in and for the territory. Some of these aspects were collected in projects such as Models of Adaptation and Agroclimatic Prevention (MAPA) and Sustainable Territory Adapted to the Climate (TESAC); MAPA, developed by Agrosavia, sought to improve local capacity for agroclimatic risk management based on a series of resilient technological options in some productive systems (Agrosavia, 2013), while TESAC, carried out by CCAFS, focused on providing tools for consolidating farm adaptation plans that contribute to increased production and food security (CCAFS, 2015). PM works as a tool that guides community decision-making processes based on the construction of spatial references related to the effects of climate variability.
Given the lack of inputs for agricultural territorial planning in the context of agroclimatic risk, as developed by Martinez et al. (2016) in the MAPA framework, and the need action directed towards adaptation to the impacts of extreme climatic events, the objective was to identify areas with less exposure to agroclimatic threats with participatory maps made by pea crop producers in Fusagasuga, Colombia.
MATERIALS AND METHODS
The PM was built at the municipal level with a 1:100,000 scale map that included hydrography, roads and populated centers. With this information, pea producers in Fusagasuga zoned the suitability of land use, determined the biophysical susceptibility of the municipality to water excess and deficiency, and identified areas of agroclimatic risk.
Study area
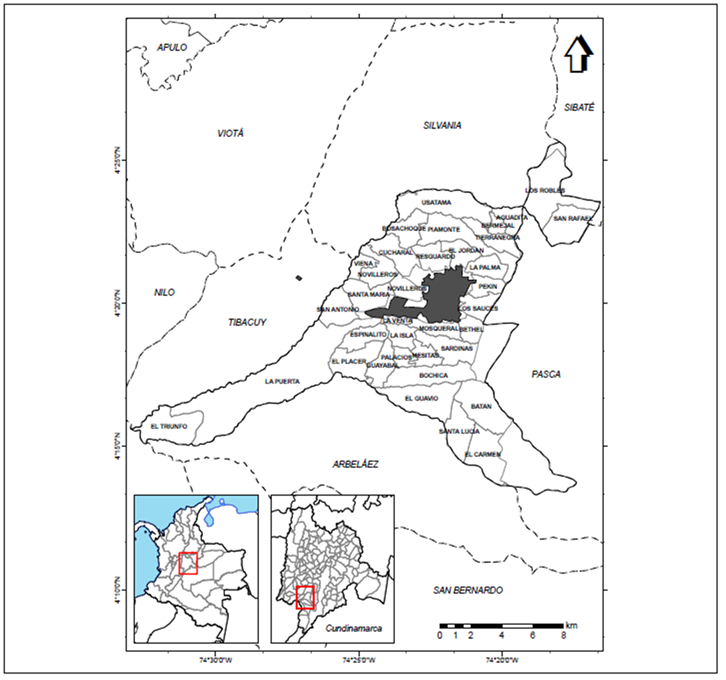
Fusagasuga is located in the Department of Cundinamarca (Colombia), between 4°13′19′’ N - 4°25′38′’ N and 74°16′34′′ W - 74°32′58′′ W. It is on a plateau framed by the Cuja and Chocho Rivers and the Quinini and Fusacana Hills, which make up the Sutagaos Valley and Chinauta Highlands (Fig. 1). In Fusagasuga, annual rain averages 1239 mm, distributed in two rainy seasons, one per semester, alternated with a marked dry period in the middle of the year (June to September) and a transition period (December to March). There is high rainfall variability on an annual scale. For 14 years (1997-2011), rainfall anomalies greater than 20% were recorded. Increments greater than 35% were recorded in 1984 and 2008, and most of the years with excessive rains occurred during La Niña events. During the El Niño event in 1992 (one of the most intense ever recorded), precipitation decreased between 20 and 40%. In general, climate variability events have a greater impact on precipitation during the first dry or low rainfall season (Agrosavia, 2017).
Focus
The PM approach contained elements developed in participatory diagnostic methods, such as PRA. These learning methods are progressive, interactive, flexible, and fast and are carried out in a workshop environment that encourages continuous debate. The approach sought consensus and the identification of differences in the collective; it was not limited by disciplines but sought the collective construction of different levels of reality perception (Basarab, 2013). During PM development, value is attributed to the knowledge of social actors and their diagnostic and analysis capabilities. The external agent worked as a catalyst for information generation, and local actors investigated the problems and resources. The debate was not limited to agrarian system. Rather, in this case, it included elements such as the relationship among the local actors, the biophysical environment, and historical memory (Osorio and Contreras, 2009).
The basis of this technique was the ability for flexible dialogue, which was based on semi-open questions and not conditioning answers. This facilitated adjusting the capacities of the group so that researchers and participants benefited from a democratic process with joint construction of the maps (Milagres et al., 2020). It also helped those who did not have the gift of gab. The nature of the approach was purely qualitative, which facilitated the generation of basic criteria for deeper research. Given the relative speed in the documentation of the results, it was possible to motivate debate about the future of this location based on the diagnosis (Osorio and Contreras, 2009). In this case, the future of territorial planning and adaptation to risks were discussed.
First moment
The workshop and objectives were presented, and the importance of knowing and interpreting the information in the maps was highlighted to improve the decision-making capacity for issues related to agroclimatic risk planning and management in the territory (department, municipality, village and crops). This was followed by a role-playing game in which farmers assumed the role of “municipal planners”. The coordinator mentioned the importance of planning agricultural production to improve adaptation to “climate changes” and opened the discussion on the subject to generate an environment of trust and motivate the members’ interest, discussion and participation. The coordinator introduced the game, indicating that “due to the lack of land use planning and organization, agricultural production is located in areas of high agroclimatic risk, where economic losses are significant and frequent.” He later expressed the need for local actors (who know the productive system and the municipality) to guide their territories’ productive planning by taking into account the agroclimatic risk caused by soil and climate. After that, the municipality map (Fig. 1) was introduced and used as the basis. Then, the planners marked the location of their municipal rural settlements with an “X” on the map. Additionally, reference points such as roads, reserve areas, municipal capital, etc., were identified.
Second moment
To guide the biophysical context, the coordinator provided information using thematic cartography and asked questions such as: What is a basin? What basins have influence in the municipality? What is the topography of the municipality? What slopes can be found? What temperatures and rainfall are recorded in the municipality? What kind of landscapes are in the municipality? The planners’ responses were heard, and the coordinator complemented the activity with thematic maps of watersheds, slopes, multi-annual average rainfall, multi-annual average temperature, and landscapes.
Third moment
The zoning of the agroclimatic risks was done with a) the identification of land use suitability and b) the location of areas with the greatest impact of extreme of water excess and deficit events. The planners performed the exercise using colored markers on the base map, which was covered with clear acetate. Areas with clear boundaries were drawn as closed polygons, indicating that each polygon corresponded to a cartographic unit (Fig. 2). Table 1 shows the purpose, methodology and tools used in each step.

Table 1 Descriptive scheme of the agroclimatic risk zoning process.
| Moment | Purpose | Metodology | Tools |
|---|---|---|---|
| First | Interpretation of thematic cartography to increase local diagnostic and decision-making capacity | Group discussion and / or deliberation of a specific topic | Role-playing game where participants take on the role of territory planners |
| Second | Contextualization of the biophysical environment | Questions and counter-questions | Role-playing game where participants ask and answer |
| Third | Agroclimatic risk zoning | Participatory mapping | Delineation of areas based on biophysical context and deliberation |
Identification of soil suitability “A1, B1 and N”
To identify soil suitability, questions such as: What is a good soil for pea crops? What conditions must an “A1” soil (or very good for crop) have? What is a “B1” soil (not so good for crops)? What is an “N” soil (very bad for crops)? were asked. According to the planners’ level of information, the soil characteristics were described in detail as follows: good soil or optimum soil (A1), regular soil or soil with some limitations (B1), and a very bad soil (N) for crops. The coordinator wrote the characteristics that the planners mentioned on the acetate sheet. Then, the question: Where are A1, B1 and N soils located? was asked. After the questions, the planners marked polygons indicating the most suitable - A1 (green color), regular - B1 (orange color) and very bad - N (red color) soils on the base map (with the acetate sheet). Once the exercise was done, the coordinator indicated that there would always be better soils than others, that the soil was highly variable, and that the crop developed better under certain characteristics. It was also clarified that, for that exercise, only the natural soil supply was taken into account. However, if there were soil adaptations given the presence of local infrastructure (irrigation or drainage systems or districts), that observation was written on the acetate (Fig. 3A).
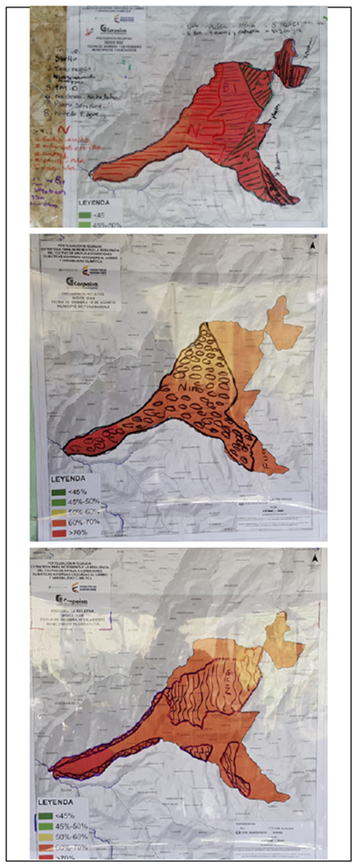
Figure 3. Delimitation of land use suitability polygons for pea crops (A); susceptibility to “Niño” water deficits (B) and susceptibility to waterlogging (C) using participatory mapping. Identification of areas with greater susceptibility to water excess and deficits.
Guidance questions, such as Is the crop tolerant to drought/excess water?, were asked. The planners marked polygons indicating the areas with the greatest water deficit (Fig. 3B) and the areas with more waterlogging (Fig. 3C) based on questions such as: What areas of the municipality have the most waterlogging problems during La Niña events? and What areas of the municipality have more drought problems during El Niño events?
Agroclimatic suitability identification
After the development of the activities, the coordinator presented the cartographic result obtained where the areas of soil suitability and greater susceptibility to extreme events of excess and deficit were found. Later, for the “identification of agroclimatic risk areas for pea crops”, the following questions were asked: taking into account the suitability of A1, B1 and N soils for pea crops and the areas of greatest waterlogging during a La Niña event, where would you NOT establish a pea crop? and Taking into account the suitability of A1, B1 and N soils for pea crops and the areas of greatest water deficit in the soil during a El Niño event, where would you NOT establish a pea crop?. On the basic map (with the acetate sheet), the planners marked “cartographic unit” polygons indicating areas of higher and lower agroclimatic risk under extreme weather events.
Finally, the results of the two analyses were interpreted using ArcGIS 10® spatial analysis functions.
RESULTS AND DISCUSSION
Land use suitability for pea crops
The producers mainly identified three types of soils for pea crops (Tab. 2). The characteristics of these soils were determined based on productive experiences, plant growth observation and yield results. The descriptions presented in the table reflect how producers understand soil suitability, mainly through characteristics such as texture, color, type of vegetation present, slope (related to the ease of tillage), structure, waterlogging tendency and the ability to retain water during times with low precipitation. Soils classified as A1, “good soils for pea crops”, were the most prevalent in the municipality. These soils were mostly dark or had a black color, loamy texture and loose to the touch. They also had, as their main characteristic, the ability to store water and not lose it so fast, with a low tendency for waterlogging. These soils had very good productive results. In contrast, N soils, “soils not suitable for pea crops”, were described as poor or not suitable for crop production, mainly because of their texture and tendency to waterlog or dry out.
Table 2. Description of soil suitability for pea crops by producers.
| Type of soil | Suitability category | Description |
|---|---|---|
| Suitable soil for pea crops | A1 | These soils must be black, loamy with high content of organic matter, loose, non-acidic (there should be no ferns around), with flat or semi-flat topography and good humidity. Neither prone to waterlogging nor very dry. Pea grows very well |
| Soils with limitations for pea crops | B1 | These soils are not so black, with semi-flat topography, tend to be acidic, have a lot of vegetation in which ferns are observed. Pea grows well if soils are prepared and if enough lime, organic matter and fertilizers are added |
| Unsuitable soils for pea crops | N | These are clayey soils that tend to waterlog or dry out. They are compacted and yellow or pale in color, with a high fern presence. They have a very sloped topography. Peas do not grow well in these soils |
When comparing the soil requirements identified by the producers with those contained in table 3, coincidences were observed in terms of topography, drainage, textures and organic matter; the pea requires well-drained soils, with flat to slightly inclined slopes (Fenalce, 2006), as well as medium textures (silty loam to clay loam) (Agrosavia and INAT, 1999; Fenalce, 2006) and a high organic matter content, preferably above 10% (Labrador Moreno, 2002). Similarly, the ideal pH is between 5.5 and 6.5, but it tolerates slightly alkaline soils (Fenalce, 2006; INIA, 2015).
Table 3. Soil requirements for pea crop.
| Characteristics | Unit | Suitability category | ||
|---|---|---|---|---|
| A1 | B1 | N | ||
| Natural drainage | Class | Well-drained | Excessive, moderate | Imperfect, poor, very poor, swampy |
| Texture | Class | Mean | Gross | Fine |
| Acidity | pH | 5.5-6.5 | 5.0-5.5; 6.5-7.5 | <5.0; >7.5 |
| Topography | % | Flat or semi-flat, slightly inclined and moderately inclined | Strongly inclined | Slightly steep, strongly steep and very steep |
| Organic matter | % | > 10 | 5 to 10 | < 5 |
Participatory mapping identified the differences between the soils, as well as their location in the territory. A1 soils were located between the southeastern sector (municipal rural settlements of Batan, Santa Lucia and El Carmen) and the northeastern sector (municipal rural settlements of Usatama, Aguadita, Bermejal, Tierra Negra, Piamonte and La Palma). In contrast, soils classified as N were located in the south of the Los Sauces village and the area from the center of the municipality (municipal rural settlements of Bosachoque, Cucharal, La Venta, La Isla, Novilleros, Santa Maria, Guayabal, western Bochica and el Guavio) to the western limit (Fig. 4).
Susceptibility to water deficits during “El Niño” and “La Niña” events
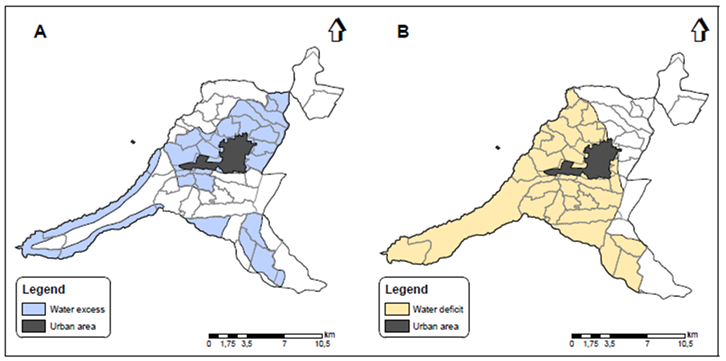
The 2010-2011 rainy season, which had a negative effect on agricultural production in Cundinamarca, still remains in the people’s collective memory. The farmers recognized areas where there was greater pressure (critical areas) from water excess events in the soil associated with the La Niña phenomenon. Under water excess events, the Central East Sector, the municipal rural settlements of El Batan, El Carmen, Santa Lucia, El Guavio, La Venta, Espinalito, La Isla, Santa Martha, Novilleros, Los Sauces, Pekin, La Palma, El Jordan, Resguardo, Piamonte, Tierra Negra, Bermejal, and Aguadita, and some perimeter areas of La Puerta and El Triunfo (Fig. 5A) were identified as critical areas. Similar to what happened with excess water, the effect of the water deficit caused by the El Niño event of 1997 and the 2014-2015 season remains a reference for the community. The farmers indicated that the phenomenon has had a greater expression in months with a lower water volume (January, February, June, July, August and September). The community indicated that, because of the decrease in rainfall, a higher temperature and winds increase susceptibility of the municipality to frost and incidence of pests and forest fires. The PM exercise identified that, during a water deficit event, the area from the center of the municipality (Bosachoque, El Resguardo, Los Sauces, Bethel, Sardinas, Bochica, El Guavio, El Batan, Santa Lucia and El Carmen) to the western limit presents high exposure to water losses in the soil (Fig. 5B).
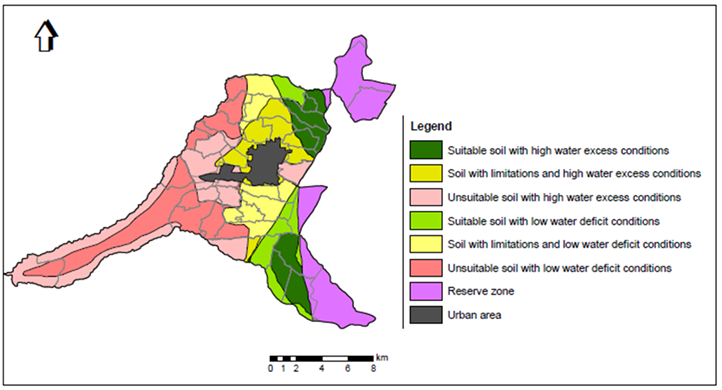
Agroclimatic risk under water excess events
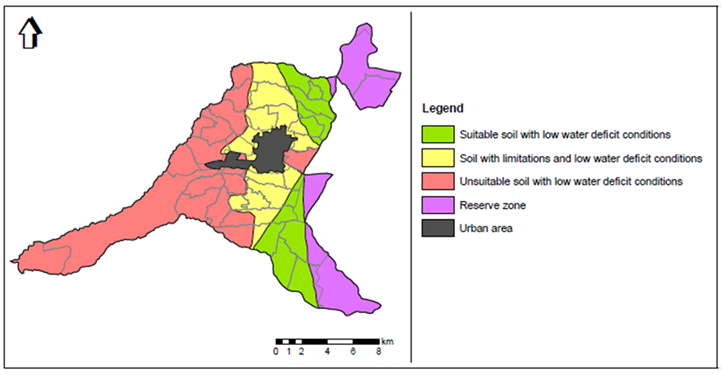
The cartographic definition of soil suitability for crops and the susceptibility to events of water excess in the soil identified areas that represent a greater risk for pea production. The municipal rural settlements of Novilleros, Santa Maria, La Venta, La Isla, Espinalito, and Los Sauces and part of El Triunfo and La Puerta had soils that are not suitable for pea crops and have high exposure to water excess events (“unsuitable soil with high water excess conditions”, light pink color). In these areas, it is not advisable to establish pea crops because of a high risk for production. On the other hand, in the municipal rural settlements of Aguadita, Bermejal, Tierra Negra, La Palma, Batan and El Carmen, the soils had adequate suitability for pea crops ("Suitable soil with excess water conditions", dark green color). According to the farmers, crop establishment is not recommended because of a high risk of waterlogging and pressure of plant diseases. Despite this, the farmers indicated that improved drainage could reduce losses caused in these areas. It was possible to identify a low-risk area during water excess events, comprised of the sectors Usatama (northern municipality), Sardinas, Bochica, El Guavio and Santa Lucia (“Suitable soil with low water excess conditions”, light green) (Fig. 6).
Agroclimatic risk under water deficit events
The critical pea production area during water deficit events includes zones with soils classified as A1 (municipal rural settlements of Santa Lucia and El Carmen), as well as areas with unsuitable soils for crops (Bosachoque, Cucharal, Vienna, Novilleros, Santa Maria, La Venta, La Isla, San Antonio, Espinalito, Guayabal, El Placer, El Guabio, La Puerta and El Triunfo). In these areas, crop establishment is not recommended, mainly during the months of January, February, June, July, August and September. In areas with A1 soils, eventual improvements in irrigation infrastructure could enhance opportunities for crop establishment. In this scenario, the producers identified an area of low risk to deficit events, with the best edaphic supply. These low agroclimatic risk areas were located in the municipal rural settlements of Aguadita, Bermejal, and Tierra Negra and the sectors La Palma, Piamonte, Usatama and Batan (Fig. 7).
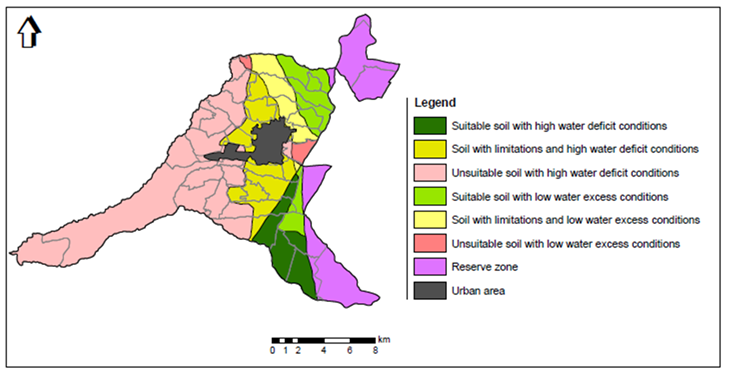
Figure 7. Map of agroclimatic suitability under water deficit during “El Niño” events made by the farmers.
The participatory mapping exercise as a dialogic technique (Fals Borda, 1999) facilitated questions and critical viewpoints on agroclimatic risks for pea crops from the perspective of agricultural technicians and farmers. This exercise was useful for reflections on the productive possibilities of the municipality’s soils, as well as possible agronomic practices that could be carried out for conditioning. An important result of the cartographic process was the spatial recognition of the risk of excess and deficit events from spatial-territorial reflection and collective temporal reflection exercises.
Similar results and initiatives on the use of PM for the analysis of territorial risks have been obtained by other authors under similar perspectives. Critical or higher risk areas are spatially located to propose alternatives that reduce vulnerability to dangerous conditions and contribute to the collective management of the territory.
Ojeda-Trejo et al. (2014) used participatory mapping to generate community land and land use maps in the regions of Santa Maria Nativitas and Santa Catarina in the municipality of Texcoco, Mexico. The collection of the local community perceptions was carried out using aerial photographs (1:19,000) and mosaics on paper (1:10,000). The authors indicate that “the inclusion of local knowledge in a formal scheme, such as participatory mapping, creates an alternative representation of the territory for land use planning and decision-making by inhabitants that should be considered more broadly in the mapping of the Community Land Regulation” (Ojeda-Trejo et al., 2014, p. 18, own translation).
Soares and García (2017), together with the community of the Usumacinta River basin in Jiutepec (Mexico), prepared maps of the most vulnerable areas, identifying fire, drought, deforestation, flooding and landslide risks. The maps were printed on bond paper at a scale of 1:50,000, which corresponded to the subregion and represented the municipal political division, roads, localities, water bodies and other notable geographical characteristics.
On the other hand, Martínez et al. (2007) designed a methodological guide for participatory disaster risk analysis for rural areas in the Nueva Cajamarca district in Peru. This guide identified and analyzed hazards, vulnerabilities and risks of different origin to achieve a representation that can be easily interpreted by users. The disaster risk analysis required the development and study of thematic cartography to identify potentially vulnerable areas. In general, this methodology is a social-technical instrument to diagnose and evaluate existing risk conditions in a specific territory. It started from the spatial location of the community on a map, as well as from the natural and human - cultural components of the region to subsequently identify current risk zones given the presence of different types of hazards and vulnerability factors. Cartographic materials, such as satellite images (Landsat TM and ETM+) and a road map that provided a starting point for the study of the community (group of 8 to 10 inhabitants), were used.
The present study on soil risk and suitability carried out with pea producers in the municipality of Fusagasuga encouraged the collective memory on “risks” and territoriality in terms of graphic representations on blank maps of the municipality. Despite the fact that many of the attendees in the area provided information on soil opportunities and limitations and agroclimatic risks, they did not know the details presented by the farmers or the location of these soils in the municipality. In this sense, the differences in historical memory of climate impacts and the knowledge on the particularities of the municipality did not create conflict when creating the maps. On the contrary, they contributed to the reflection of the community on the productive risks that the community must address, the challenges of the collective construction of information, and the recognition of the environmental and political interests and positions of the community. These ideas were expressed through the cartographic exercise. According to Vélez et al. (2012), p. 62, “the participatory mapping exercise transcends collective mapping, as a practice of appropriating the mapping technique, since it starts from previous experiences and representations of organizations and communities and energizes the work” (own translation).
De Sousa-Santos (1991) stated that a territory should be analyzed as a complex of historical and geographical dynamics, following the principles of authenticity and commitment in participatory research by Fals Borda (1999). In this way, social organizations strengthen their ability to establish, manage and defend the territory (Alberich, 2007) through the generation of research processes and concrete knowledge-power tools (Foucault, 1988).
CONCLUSION
This exercise identified the municipal rural settlements of Novilleros, Santa Maria, La Venta, La Isla, Espinalito, El Triunfo and La Puerta as high-risk areas for pea crops in terms of very limiting soils for crops and a greater occurrence of extreme water deficits and excess events. In contrast, the areas with the lowest risk as a result of their optimal soil for crops and a low occurrence of extreme events were in the municipal rural settlements of Aguadita, Bermejal, Tierra Negra, La Palma, Piamonte, Usatama and Batan (under deficit events) and Usatama, Sardinas, Bochica, El Guavio and Santa Lucia (under water excess events).
This methodology and these results provide a framework for decision-making in the autonomous and participatory planning of the territory. It will allow communities to recognize specific territorial challenges in the impact of climate variability in the municipality. In addition, it will strengthen governance and improve knowledge on the territory, providing an input for discussion within the institutional framework for the joint management of agroclimatic risks.

