


 English (pdf)
 Article in xml format
 Article references
 Send this article by e-mail
 Cited by SciELO
  Cited by Google
  Similars in
SciELO
Similars in
SciELO  Similars in Google
 Permalink
INTRODUCTION
In recent years, interest in pseudocereals has increased for the development of functional food products and their health benefits. Among these plants are amaranth, buckwheat, and quinoa (Romano and Ferranti, 2023). Quinoa (Chenopodium quinoa Willd.) belongs to the Amaranthaceae family and is considered a crop originating from South America that has been cultivated for approximately 3,000-4,000 years (Ahmed et al., 2018).
In the agro-industry, quinoa is considered a super grain and functional food ingredient because it provides technological and health benefits (Sharma et al., 2022). This grain has carbohydrates with a low glycemic index, high biological value proteins containing all 20 amino acids, including the 10 essential ones. It also contains vitamins such as thiamine, riboflavin, niacin, and vitamin E, and antioxidant compounds such as saponins and polyphenols (Liu et al., 2022). The quality and vigor of quinoa seeds vary according to temperature, humidity, and storage time (Anchico et al., 2021).
When ripe, it provides a protein content ranging from 9 to 20% (Stikic et al., 2012; Nowak et al., 2016; Fischer et al., 2017). The seed's proteins include globulins such as quenopodin and albumin, accounting for approximately 37 and 35% of the total seed protein, respectively. In addition, quinoa seed has a low concentration of prolamins (0.5-7.0% of total protein), making it a suitable ingredient for patients with celiac disease (Dakhili et al., 2019). Moreover, it contains high amounts of glutamic acid and aspartic acid with lower levels of proline and arginine than other cereals (Bhargava et al., 2006; Elsohaimy et al., 2015; Dakhili et al., 2019).
This species can also exhibit high variations in the content of other nutritional components such as fiber and lipids. Studies have shown variations in the range of 4.0 to 7.6% for lipids and 8.8 to 14.1% for fiber. On the other hand, minerals such as calcium, zinc, magnesium, and potassium are found in quinoa in bioavailable forms, making it suitable for a balanced diet (Vilcacundo and Hernández-Ledesma, 2017).
The usefulness and functionality of any grain as human food depend on the quantity and quality of these chemical constituents, which can change according to variety, irrigation, and processing. Quinoa has different forms of use and applications. Due to the high protein contents in the straw (10.6 to 19.9%), it is considered a dual-purpose species for grain production and animal feed, generating several economic benefits for the producer (Asher et al., 2020). On the other hand, in the human diet, there are studies that demonstrate that this species can be used as a vegetable because its leaves can be consumed during the early stages of development, which, according to the genotypes, may present variations in the content of carbohydrates, lipids, proteins, dietary fibers, vitamins, and minerals (Stoleru et al., 2022). Its nutritional composition has generated interest, leading to its propagation in various regions of the world, due to the culture's ability to face many limitations such as water deficit, salinity, frost, or poor soils (Hafeez et al., 2022).
Given the nutritional and functional importance of this grain, this research aimed to evaluate the physicochemical composition and antioxidant capacity of 11 quinoa genotypes originating from Brazil, Colombia, and Ecuador, grown under Brazilian cerrado conditions. To determine the effect of these genotypes on the physicochemical composition of the grains to establish future genetic improvement programs.
MATERIALS AND METHODS
Growing location.The experiment was conducted at Fazenda Água Limpa, Faculdade de Agronomia e Medicina Veterinária (FAV), Universidade de Brasília, located at 15º56' S and 47º55' W, with an altitude of 1,100 m. The area has an AW climate type, according to the Köppen classification, characterized by a rainy summer season from October to April and a dry winter season from May to September (Kottek et al., 2006). Each plot had 30 plants/m and the useful area was 1 m2. The soil was prepared 30 d before sowing with the application of organic fertilizer and limestone. Planting and cover fertilizations were carried out according to soil analysis and following the recommendations of Spehar (2007), which were 60 kg ha-1 of N, 60 kg ha-1 of P, and 60 kg ha-1 of K.
Evaluated progenies. The study evaluated 11 quinoa genotypes obtained from Brazil, Colombia, and Ecuador. The seeds were prepared by manual threshing and cleaning with a fan to remove impurities. The seeds were then stored in paper bags at -4°C until the evaluation of the following genotypes.
BRS Syetetuba: A cultivar developed in Brazil. It has a cycle of around 120 d, an average plant height of 180 cm, cylindrical and flattened grains with a white pericarp surrounded by the perigone, which opens during maturation. The seeds have high quality with tolerance to high-stress environments (Alencar et al., 2021), an average weight of 2.5 and 3.3 g (weight of 1,000 grains) in summer and winter crops, respectively, containing up to 18% of protein, grain yield of 2.3 t ha-1, and dry matter of 7.5 t ha-1. It has no pigmentation (Spehar et al., 2011). The genotypes used from this cultivar were BX1, BX2, BX3, BX4, BX5, BX6, BX8, and BX10.
Aurora: A variety selected by the Faculty of Agricultural Sciences of the Universidad de Nariño - Colombia, adapted to altitudes between 2,300 and 3,000 m. The Aurora variety is classified as early, with a cycle of approximately 85 to 140 d. It has a short stature with a size of 90 to 130 cm and a production of 1.8 to 2.4 t ha-1. The grains are uncovered at maturity and have less shelling tolerance. The seeds are small and white, with a diameter of less than 2 mm (Sañudo et al., 2005). The Aurora variety has pigmentation. The genotype used in this experiment selected from this variety was A88.
Piartal: A variety originating from the province of Carchi, northern Ecuador. The plant has a purple color, can reach up to 240 cm in height, and is susceptible to mildew. The grain is opaque white, with a diameter of approximately 2 mm. It has an average yield of 2.3 t ha-1 (Alvarez et al., 1990). The Piartal variety has pigmentation. The genotype used in this experiment selected from this variety was P88.
Tunkahuan: Originating from Ecuador, it presents high adaptability in altitudes situated between 2,400 and 3,200 m. Under Andean conditions, it reaches a plant height of 144 cm, with a cycle of 150 to 210 d, purple plant and orange-yellow clustered panicle, white grain, grain size from 1.7 to 2.1 mm, low saponin content of 0.06%, and 15.73% protein with an average yield of 2.2 t ha-1 (Nieto et al., 1992). The genotype used in this experiment was T88.
Physicochemical analysis
The physicochemical analysis was performed at the Centro de Pesquisa em Alimentação of the Universidade Passo Fundo (UFP), Rio Grande do Sul (RS), and the analysis of antioxidant capacity at the Packaging Laboratory (LABÉN) of the Technological Faculty of the Universidad de Santiago de Chile.
Moisture content determination: It was determined by the gravimetric method (931.04, AOAC, 1995). First, 10 g of the sample were placed in a previously dried metal capsule (m 0) and weighed on an analytical precision balance. The capsules with the samples were weighed again (m 1). Subsequently, they were taken to a drying oven at a controlled temperature of 105±0.2°C for approximately 24 h until they reached constant weight. At the end of this period, the capsule was removed and immediately covered with the lid to be taken to the desiccator to cool the sample. Finally, the capsule with the lid and the dried sample (m 2) were weighed again. The moisture content (U) of the sample was determined according to the following formula and was expressed as a percentage of moisture (Eq. 1):
Ash determination: The ash content was determined according to the AOAC 920 by the gravimetric method (920.153, AOAC, 1995). First, a previously dried crucible was weighed (M 0). Then, a quantity of 3 to 5 g of a well-homogenized sample (M 1) was weighed on a precision scale. The sample was calcined in a muffle at approximately 550°C until the ashes were slightly gray or of constant weight. Continuously, the crucible was cooled in a desiccator. Finally, the capsule was weighed (M 2). The ash content (AC) of the sample was determined according to the following formula and was expressed as a percentage (Eq. 2):
Protein determination: It was performed using the Kjeldahl method, according to AOAC 981.10 (AOAC, 1995). Approximately 2 g of the homogenized sample were weighed and quantitatively transferred to the digestion tube. Then, concentrated sulfuric acid and hydrogen peroxide were added. The digestion tube was continuously placed in a temperature ramp block up to 420°C, until the resulting solution became clear. The digestion tube was cooled to 50-60°C and the digestion and titration process was performed. The result was expressed as % protein. The conversion to crude protein was made using the factor 6.25 (Mujica-Sánchez et al., 2001).
Determination of crude fiber: It was performed by digesting the material in a 1.25% w/v H2SO4 solution for 30 min, followed by a 1.25% w/v NaOH solution for another 30 min (AOAC, 1995). The result was expressed as a percentage.
Lipid determination: It was obtained using the solvent extraction method (n-hexane), hot, in a Soxhlet extractor. Firstly, a flask was previously dried at 103°C, cooled and weighed (P 0). Then, 5 g of sample (P 1) were weighed and immediately subjected to liquid-solid extraction. Hexane was used as a solvent in a Soxhlet extractor for 5 h at 60°C. After the oil extraction was completed, the organic solvent was evaporated in a rotary evaporator for 30 min at 100 °C. The flask was cooled in a desiccator and continuously weighed (P 2). The ether extract was determined by the following formula (Eq. 3):
Carbohydrate (CHO) determination: Carbohydrates were calculated by difference according to the following formula (Eq. 4) and the result was expressed as a percentage:
Evaluation of antioxidant activity
Initially, the extraction of bioactive compounds in quinoa grains was carried out by hydroalcoholic extraction (ethanol/water, 1:1) at 40°C for 3 h. The resulting extract was then filtered through paper and used for antioxidant activity analysis using the ABTS [2,2´-azinobis (3-ethylbenzothiazoline-6-sulfonic acid)] radical reduction method, prepared by reacting an aqueous solution of ABTS (7 mmol L-1) with potassium persulfate (140 mmol L-1). The solution was kept protected from light at room temperature for 16 h and then diluted in ethanol until an absorbance of 0.70 nm was obtained at a wavelength of 734 nm. Aliquots of the extracts were added to the ABTS+ solution, and the absorbance was measured at 734 nm after approximately 6 min using a spectrophotometer. The antioxidant capacity of the sample was calculated relative to the activity of the antioxidant Trolox, under the same conditions, and the results were expressed in equivalence (mg ET/g) (Kuskoski et al., 2004).
Statistical analysis
All analyses were performed in triplicate, and the data were presented as means. Analysis of variance (ANOVA) was performed using the F-test, and the means of the genotypes were compared using the Tukey test (P≤0.05). Additionally, correlation analysis (Fischer-test, P≤0.01and P≤0.05) was performed using the statistical program SPSS, and a dendrogram was constructed using hierarchical clustering analysis by the Ward method, with the formation of groups based on moisture (%), carbohydrates (%), protein (%), lipids (%), fiber (%), and ash (%) for the 11 quinoa progenies.
RESULTS AND DISCUSSION
The analysis of variance revealed significant differences among the genotypes for all the evaluated physicochemical parameters, as indicated by the F test (P≤0.01 and P≤0.05) (Tab. 1). Higher F values (>2) were obtained, demonstrating a high degree of experimental precision in this research, in accordance with Resende and Duarte (2007). The grains moisture content had an average of 11.21%, which is lower than the recommended value of 12% for seed storage processes that promote seed vigor and germination (Souza et al., 2016). Additionally, the low moisture level in the seeds can increase their shelf life by inhibiting the growth of microorganisms. On the other hand, seed moisture plays a crucial role in all biological and metabolic activities, which can influence the longevity or deterioration of seeds during storage (Bakhtavar and Afzal, 2020). The Tukey test also revealed significant differences among the genotypes. Specifically, the F values ranged from 8.49 for lipids to 27.75 for moisture.
Table 1. Composition of quinoa grains (%) from 11 genotypes, sowed under Brazilian Savanna (Cerrado) conditions.
| Genotypes | Moisture | Carbohydrate | Protein | Lipid | Fiber | Ash |
|---|---|---|---|---|---|---|
| P88 | 11.66 a | 45.30 d | 16.28 a | 2.09 c | 18.27 a | 6.37 ab |
| T88 | 11.39 b | 46.35 cd | 15.59 ab | 2.78 b | 17.26 a | 6.61 a |
| BX6 | 11.31 bc | 51.68 ab | 15.27 bc | 3.45 ab | 12.86 b | 5.40 c |
| BX8 | 11.19 cd | 50.65 ab | 15.10 bcd | 3.38 ab | 13.74 b | 5.92 bc |
| BX10 | 11.18 cd | 51.13 ab | 14.92 bcd | 3.40 ab | 13.51 b | 5.84 bc |
| A88 | 11.17 cd | 52.66 a | 14.32 d | 3.35 ab | 13.11 b | 5.37 c |
| BX1 | 11.16 cd | 52.55 a | 14.65 cd | 3.45 ab | 12.26 b | 5.90 bc |
| BX2 | 11.12 d | 51.09 ab | 14.61 cd | 3.30 ab | 13.80 b | 6.05 ab |
| BX4 | 11.07 de | 51.06 ab | 15.68 ab | 3.53 a | 12.76 b | 5.87 bc |
| BX3 | 11.05 de | 48.93 bc | 15.80 ab | 3.41 ab | 14.38 b | 6.41 ab |
| BX5 | 10.92 e | 50.28 ab | 15.67 ab | 3.47 ab | 13.45 b | 6.19 ab |
| Average | 11.21 | 50.16 | 15.27 | 3.24 | 14.13 | 6.0 |
| F | 27.75* | 11.14* | 9.88* | 8.49* | 13.63* | 10.12* |
| CV (%) | 1.76 | 4.75 | 3.93 | 13.24 | 13.45 | 6.5 |
Means followed by the same letters, in each column, do not differ from each other according to Tukey's test (P≤0.05).
*significant in the F test (P≤0.01).
Carbohydrates (CHO) are the main constituents of cereals and grains, but they have also been increasingly used in the development of new products in the food and pharmaceutical industries, such as coatings, cosmetics, and sanitary uses, among others (Contreras-Jiménez et al., 2019; Zhang et al., 2021). In this study, carbohydrates were the major compounds in the seeds, with an average of 50.16% (Tab. 1). These results are lower than the carbohydrate levels (59.62-69.36%) found by Velásquez-Barreto et al. (2021) in different Andean quinoa grains. Depending on the different genotypes and types of grain, carbohydrate levels can vary widely, as demonstrated in studies on the physicochemical characterization of quinoa. Stikic et al. (2012) reported values of 49.55%, while Pereira et al. (2019) found levels of 75-77% in different varieties of quinoa from Spain and Peru. In this study, carbohydrate values fluctuated in the range of 45.30-52.66% (Tab. 1), which are lower than other grains such as wheat, rice, and corn (71.1, 81.7, and 74.3%, respectively). The genotypes did not differ statistically in terms of their carbohydrate content, except for the P88 genotype from Ecuador, which had a lower carbohydrate content in its physicochemical composition. A lower carbohydrate content in the grains may be a consequence of the fiber content, but a higher fiber content tends to decrease the content of carbohydrates and other compounds, such as lipids.
The protein of the evaluated genotypes showed significant differences according to the Tukey test (P≤0.05) with an average of 15.27% (Tab. 1). Velásquez-Barreto et al. (2021) found lower protein content values ranging from 9.66 to 12.19% in white, red, and black quinoa varieties. However, the protein content can vary depending on various factors such as grain type (white, red, or black), variety, origin, exposure to saline conditions, among others (Stikic et al., 2012; Mohamed et al., 2019; Pereira et al., 2019). Fischer et al. (2017) reported that water availability and washing processes in seeds can affect protein contents, which are stored in the endosperm and embryonic tissues. Therefore, all mechanical practices in seed processing should be carried out with great care to avoid damage that can result in the loss of phenols, proteins, and vitamins (Ninfali et al., 2020). Additionally, protein content may decrease with time and temperature during storage (Kibar et al., 2021). Protein percentages ranged from 14.32 to 16.28% (Tab. 1). In this sense, genotype P88 had the highest protein content, while genotype A88 had the lowest protein content (14.32%) compared to the others. Spehar (2007) and Rocha (2011), reported higher protein content data for the same conditions as those of the present study. The nutritional quality of a food is determined by the content and quality of its protein, which is directly related to its amino acid content, digestibility, and other factors. In this study, the different genotypes evaluated showed an average of 15.27% protein, which exceeds the values reported in barley (11%), rice (7.5%), and corn (13.4%) and is comparable to the protein content in wheat (15.4%) (Satheesh et al., 2018). Valencia-Chamorro (2016) argues that the embryo of the quinoa seed constitutes a significant proportion of the total weight, which may explain the presence of higher levels of protein compared to other cereals. Therefore, quinoa produced under specific conditions in the Brazilian Savannah is an ideal option to complement the diet in tropical regions and add high nutritional value.
This study found an average lipid content of 3.24% in quinoa grains, which is similar to the findings of Rodríguez et al. (2021) who reported values of approximately 3.9% for the European variety (Pot_4). However, other studies have reported higher lipid contents of up to 6.8%, depending on the genotype and grain type (Stikic et al., 2012; Pereira et al., 2019; Velásquez-Barreto et al., 2021). In this study, it was observed that the P88 genotype differed statistically from the other results, exhibiting the lowest lipid content (2.09%). The other genotypes did not differ statistically from each other but had higher lipid content than P88.
Regarding fiber content, variation was observed between 12.86 to 18.27%, with an average value of 14.13% (Tab. 1). Several studies on quinoa have shown lower results than those found in this study (Stikic et al., 2012; Velásquez-Barreto et al., 2021). Rodríguez et al. (2021) reported similar fiber content, ranging from 12.55 to 22.71%. It was observed that genotypes originating from Ecuador had the highest fiber content, with values of 18.27 and 17.26% in genotypes P88 and T88, respectively. The other genotypes had lower values, without significant differences between them.
Significant differences were found for ash content, with an average value of 6.0%. Similar results were found in other studies related to ash content in quinoa (Pereira et al., 2019; Rodríguez et al., 2021; Velásquez-Barreto et al., 2021). The ash percentages found in this study exceed the reported values for wheat, corn, and rice (1.1, 0.7, and 0.2%, respectively) (USDA, 2015). However, ash content can vary depending on the genotype, fertilization, storage, minerals, and soil type (Nasir et al., 2015). This study showed that quinoa offers desirable nutritional characteristics for food, with higher protein, total fat, fiber, and ash content than conventional cereals such as wheat, corn, and rice (Nisar et al., 2017). Due to its physicochemical composition, quinoa has various technological applications for developing food products.
To establish and observe the relationships between the studied variables, linear correlation analyses (P≤0.01) and (P≤0.05) were performed among the following parameters: moisture (%), protein (%), carbohydrates (CHO%), lipids (%), fiber (%), and ash (%) (Tab. 2). It was observed that the moisture parameter had a negative correlation with CHO (r=-0.643) and lipids (r=-0.873). Thus, high moisture values were associated with low carbohydrate and lipid values. However, this parameter presented a decreasing positive correlation with fiber (r=0.756), protein (r=0.334), and ash (r=0.189). In this sense, the percentage of moisture can influence the nutritional contents of quinoa, exhibiting a significant correlation with fiber and protein (Kibar et al., 2021).
The carbohydrate (CHO) content showed a positive correlation with lipids (r=0.858) and a significant negative correlation with the protein (r=-0.785), ash (r=-0.814), and fiber content (r=-0.965). These results confirm the relationship between carbohydrates and lipids. Studies have shown an inverse relationship between the carbohydrate content and the protein, fiber, and ash content (Rocha, 2011; Bonifacio et al., 2015). Therefore, selecting genotypes with lower carbohydrate content may result in higher protein content.
Table 2. Pearson correlation coefficients between moisture, carbohydrates (CHO), protein, lipids, fiber, and ashes of quinoa genotypes.
| Characteristic | Moisture | CHO | Protein | Lipid | Fiber | Ash |
|---|---|---|---|---|---|---|
| Moisture | 1 | -0.643* | 0.334 | -0.873** | 0.756** | 0.189 |
| CHO | 1 | -0.785** | 0.858** | -0.965** | -0.814** | |
| Protein | 1 | -0.525 | 0.621* | 0.638* | ||
| Lipids | 1 | -0.937** | -0.521 | |||
| Fiber | 1 | 0.712* | ||||
| Ash | 1 |
*Significant at 5% probability.
**Significant at 1% probability.
In terms of protein, a positive correlation was observed with fiber content (r=0.621), and a negative correlation was found with lipid content (r=-0.525). In contrast, lipid content showed a strong negative correlation with ash content (r=-0.521) and fiber (r=-0.937). These findings enable the selection of genotypes with lower lipid content, resulting in a higher fiber content, which is a desirable characteristic in the food industry for developing products using extrusion processes (Repo-Carrasco-Valencia et al., 2011).
The hierarchical analysis provided a comprehensive grouping of genotypes based on their similarities in measured characteristics (Fig. 1). The grouping was determined by the Euclidean distance between the detected differences (Freddi et al., 2008), resulting in four distinct clusters with cluster III and IV consisting of genotypes from Ecuador (T88 and P88, respectively) (Fig. 1). These two groups exhibited similarities not only in physicochemical composition but also in other agronomic variables such as plant height, grain yield, panicle size, inflorescence color, and thermal accumulation of phenological cycles (Anchico et al., 2020; Anchico-Jojoa et al., 2021).
Cluster II was formed by 7 genotypes, with 6 selected from the BRS Syetetuba cultivar (BX2, BX3, BX4, BX5, BX8, BX10) and one genotype selected from the Colombian Aurora cultivar (A88). Genotypes from Brazil were predominantly associated with Cluster III, indicating a significant association between origin and composition due to similar physicochemical composition. The A88 genotype from Colombia was also associated with Cluster III, which may suggest that it has tolerance to high-stress environments characteristic of the Brazilian Cerrado, as it exhibited a physicochemical composition similar to most of the BRS Syetetuba genotypes.
Cluster I was composed of two genotypes selected from BRS Syetetuba (BX1 and BX6), which shared similarities in characteristics such as CHO, fiber, and lipids (Fig. 1). Overall, the grouping allowed for the identification of genotypes with similar physicochemical compositions, which could aid in the selection of genotypes for specific purposes, such as the development of products with extrusion processes in the food industry.
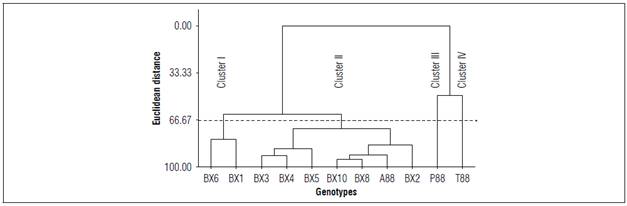
Figure 1. Dendrogram resulting from hierarchical clustering analysis using Ward's method with the formation of groups based on data on moisture (%), carbohydrates (%), protein (%), lipids (%), fiber (%) and ash (%) for 11 quinoa genotypes.
Antioxidants are substances that can effectively delay or inhibit substrate oxidation at low concentrations. When added to food, they can minimize rancidity, delay the formation of toxic oxidation products, maintain nutritional quality, and increase shelf life (Sies and Stahl, 1995; Miranda et al., 2010). The antioxidant activity is related to the presence of bioactive compounds such as phenols, saponins, anthocyanins, and vitamins in different food matrices (Song et al., 2016).
According to the results observed (Tab. 3), it can be concluded that the Aurora cultivar sample, originating from Colombia, showed the highest antioxidant activity (1.96±0.01 mg Trolox/g) compared to the other genotypes. BRS Syetetuba followed closely, with an antioxidant activity of 1.93±0.01 mg Trolox/g, while Tunkahuan, originating from Ecuador, showed the lowest antioxidant activity (1.30±0.02 mg Trolox/g). In the development of functional foods, the Aurora cultivar is recommended to enhance the antioxidant activity of the food, which may be due to the presence of pigmentation and a greater contribution of anthocyanins, which are attributed to the antioxidant activity.
Table 3. Antioxidant activity of Aurora, BRS Syetetuba, Piartal, and Tunkahuan quinoa grains.
| Cultivars | ABTS (mg Trolox/g) |
|---|---|
| Aurora | 1.96±0.01 a |
| BRS Syetetuba | 1.93±0.01 b |
| Piartal | 1.42±0.01 c |
| Tunkahuan | 1.30±0.02 d |
| Average | 1.65 |
| CV (%) | 0.5 |
| F | 6997.50* |
Means followed by the same letters in each column do not differ significantly according to Tukey's test (P≤0.05).
n±standard deviation. *Significant at 5% probability.
Quinoa is known to possess antioxidant activity, although this activity varies depending on the cultivar and its origin. For instance, Escribano et al. (2017) reported concentrations of antioxidant activity using the ABTS method of 0.318 mmol Trolox/kg of extract in 29 quinoa genotypes originating from Peru. Meanwhile, studies conducted on different quinoa varieties from Brazil and Bolivia showed variations in antioxidant activity using the ABTS method (69.47-131.84 and 56.88 - 171.11 µmol Trolox/g, respectively), which may be attributed to the genotype origin (Polari, 2017).
This study provides evidence of the nutritional characteristics in a group of quinoa varieties grown in a common environment. This suggests that any differences observed among the varieties are due to distinctive genetic factors rather than environmental influences or genotype-environment interactions. Therefore, the findings of the relationships between the nutritional traits could serve as a useful indicator for the development of future improvement programs aimed at enhancing the nutritional attributes of this species.
CONCLUSION
The carbohydrate content varied between 45.30 and 52.66%, while the protein content varied between 14.32 and 16.28%. The lipid content in quinoa grains was on average 3.24%, with variations among genotypes. The fiber content ranged from 12.26 to 18.27%.
Protein showed a positive correlation with fiber and negative correlation with lipid and carbohydrates, while lipid showed a strong negative correlation with ash and fiber content. These results allow for the selection of genotypes with specific nutrient contents to meet the needs of the food industry.
Genotype A88, originating from Colombia, was associated with group II in the hierarchical analysis due to having similar physicochemical characteristics to genotypes from the Brazilian region, indicating a possible tolerance to high-stress environments characteristic of the Brazilian cerrado.
The Aurora cultivar, originating from Colombia, showed the highest antioxidant activity, followed by BRS Syetetuba, while the Tunkahuan cultivar, originating from Ecuador, showed the lowest antioxidant activity. Additionally, the presence of pigmentation, mainly anthocyanins, may contribute to the antioxidant activity of functional foods.

