


 English (pdf)
 Article in xml format
 Article references
 Send this article by e-mail
 Cited by SciELO
  Cited by Google
  Similars in
SciELO
Similars in
SciELO  Similars in Google
 Permalink
INTRODUCTION
70% of the world's surface is covered with water, with the volume of water in the world close to 1,386 million km3 (IICA, 2021); however, 97.5% is salt water and only 2.5% is fresh water, of which less than 1% is suitable to sustain human life, on a planet subjected to high anthropic pressure due to population growth and the current development model (WWF Colombia, 2012). In addition, agricultural activity uses 70% of the total water consumed (Romero et al., 2016).
For the next few years, the amount of water necessary to produce the food, fiber and biofuels required by the population will increase by up to 55% due to population increase and the change in consumption patterns (UN-Water, 2014). Soil and water are strategic resources that contribute to food security and the generation of ecosystem services. The use of irrigation in agriculture in the tropics allows two or three crops a year on the same plot, which makes these areas important for world food security (Medina et al., 2016). The analysis of the water footprint (WF) and the water demand of the agricultural sector implies studying the water requirement of crops and the relationship with the natural water supply, associated with the temporal and spatial variability of precipitation and the characteristics of the soils (IDEAM, 2023).
The WF is an environmental indicator to quantitatively identify the relationship of humans with water and its possible impacts on water resources (Díaz et al., 2016); this indicator takes into account both direct and indirect use of water by a consumer or product (Hoekstra and Hung, 2005; Egan, 2011; Hoekstra, 2017). The International Water Footprint Network (WFN) defines WF as the total volume of water used by people, companies or countries to produce, consume or use goods and services. Likewise, ISO 18091 considers WF as a parameter to quantify the possible environmental impacts related to water (eutrophication, salinization, acidification, scarcity, etc.) (ISO, 2014). Agricultural WF includes WFgreen (associated with precipitation), WFblue (associated with irrigation) and WFgray (leaching or effluents) (IDEAM, 2015); thus, the WF of a crop consists of the sum of WFgreen (effective precipitation consumed during crop growth), WFblue (estimate of the portion of irrigation potentially effective to sustain agriculture (IDEAM, 2023)) and WFgray (amount of fresh water requiredto assimilate pollution caused by crop growth (Gao et al, 2021)).
Estimated world WF in the period between 1996 and 2005 was 7,404 Gm3 year-1, with a contribution of 78% WFgreen, 12% WFblue and 10% WFgray (Mekonnen and Hoekstra, 2011). The estimated WF of agricultural (permanent and transitory crops) for Colombia in 2020 was 6,283.4 Mm3 year-1of WFblue and 50,146.2 Mm3 year-1 of WFgreen (IDEAM, 2023); in 2016 there were 8,327.7 Mm3 year-1 for WFblue and 51,642.6 Mm3 year-1 for WFgreen (IDEAM, 2019). Quantifying the WH in agricultural systems is essential, since it allows producers to know and understand how much water they use, consume and contaminate during the crop cycle and thus identify if the water resource is used efficiently, in addition to identifying the potential risks that a productive system faces under a scenario of water deficit to make better decisions regarding the management of this resource, manage processes, participate in local and national policies of environmental and productive sustainability, which allow regulating specific actions for its savings (Romero et al.,2016).
The onion (Allium cepa L.) is one of the most widely cultivated plants in the world; it is the second vegetable in economic importance in Colombia after the potato and is an important occupation of family labor (Amaya and Méndez, 2013). In 2019, there was 290,640.9 t of national production, with a yield of 20.28 t ha-1(Agronet, 2022). Boyaca is an important producing department which in 2020 participated in 39.83% of the production (138,441.6 t), with yields of 24.25 t ha-1 and 25.47 t ha-1 in 2021. This vegetable has the largest planted area, mainly in the provinces of Centro, Tundama, Sugamuxi and Ricaurte (Gobernación de Boyacá,2020) with 43 municipalities, highlighting Tibasosa (1,414 ha) and Toca (1,080 ha) according to the Evaluaciones Agropecuarias Municipales of 2017 (EVAin Spanish) (MADR, 2019). Samaca, for the year 2020, reported a planted area of 740 ha, production 16,280 t and yield of 22 t ha-1 and 26.76 t ha-1 in 2021(Agronet, 2022).
The determination of WF is widely used in the management of water resources and involves edaphoclimatic data to compare different agronomic practices, productive systems, and economic activities, both spatiotemporal and multipurpose; therefore, the objective of this research was to determine the water footprint in bulb onion cultivation under drip and sprinkler irrigation systems in the municipality of Samaca (Colombia).
MATERIALS AND METHODS
Data collection and treatments
The research was carried out at 2,660 m a.s.l., temperature 13.9ºC and 5°31'53.98'' N and 73°29'15.7'' (Samaca, Boyaca, Colombia).The hybrid Osaka F1 yellow onion with a short and early day was used. The evaluations were carried out from planting to harvest (first half 2021) in Fluventic Haplustepts soil (USDA, 2014). The treatments consisted of two irrigation systems, sprinkler and drip, with distances between sprinklers of 12 m between lines and 9 m between emitters, and drip, five tapes per bed with a distance between lines of 0.4 m and between drippers 0.1 m.
To determine the water footprint, 1×1×0.35 m lysimeters were used, with a storage cabin and water extraction outlet. The extraction was done weekly using suction pumps, together with 50 g of soil to determine gravimetric humidity. Chemical analysis (N, P, K, Ca, Mg and K) and physical analysis of soils were carried out: apparent density (g cc-1) (known volume ring) and real (pycnometer), moisture retention curves (pressure cookers, 2.5 cm rings) at 0.33 and 15 bars (field capacity, permanent wilting point), hydraulic conductivity (cm h-1) (constant head hydraulic conductivity equipment, 5 cm rings), and physicochemical analysis of irrigation water.
A portable weather station was also used for the collection of precipitation, evapotranspiration and temperature, and the Cropwat application for the determination of evapotranspiration (EV) and daily water balances, every 10 d (1 dec) and monthly (Allen et al., 2006; Romero et al., 2016). Precipitation information over a 30-year period from the IDEAM Villa Carmen station (Samaca) was used.
Weekly data were collected on lysimeter leachate (mm), applied irrigation sheets (mm h-1), gravimetric moisture content (%), precipitation (mm) and reference evapotranspiration from the information generated by the portable weather station. Cropwat was used to determine crop evapotranspiration and effective precipitation (ETc [mm dec-1]).
During the crop cycle, pest and disease control was ensured. Edaphic fertilization was applied in each treatment based on the chemical analysis of soils and fertigation formula (15 d after emergence until day 60) and maturation (begins day 61 up to 30 d before harvest) (Tab. 1).
Table 1. Edaphic fertilization and fertigation formula in Allium cepa.
| Irrigation system | Sowing (kg ha-1) | Start of bulbing (kg ha-1) | |||||||
|---|---|---|---|---|---|---|---|---|---|
| N | P | k | N | P | k | ||||
| Sprinkler | 50.4 | 88.92 | 41.76 | 97.44 | 37.12 | 162.4 | |||
| Drip | 16.8 | 29.6 | 13.9 | 31.9 | 12.1 | 53.2 | |||
| Fertigation formula (mg kg-1) | |||||||||
| Stage | N | P2O5 | K2O | MgO | B | Cu | Fe | Mn | Zn |
| Growth | 130 | 50 | 90 | 50 | 0.5 | 2 | 5 | 3 | 2 |
| Maturation | 120 | 445 | 170 | 445 | 1 | 2 | 5 | 3 | 2 |
Components of the water footprint (WF)
In line with Hoekstra (2017), WHblue is the water applied by artificial means for crop production; it was calculated from crop water use (CWU [m3 ha-1]) divided by crop yield (Y [t ha-1 ], Eq. 1). The CWU was determined from the daily evapotranspiration (mm d-1) during the evaluation period (Eq. 2).
where the EVTblue is the total evapotranspiration of blue water, 10 the conversion factor to mm, LPC is the cultivation period from the day of transplantation to harvest.
Since the WFgreen corresponds to the contributions of water from rainfall, it is estimated by taking the results of effective precipitation (PRECe) using Cropwat as a reference. The effective precipitation is that part of the precipitation stored in the soil and potentially available to satisfy the needs of the crop. Most of the time the effective precipitation is less than the precipitation because plants cannot appropriate all the water, due to surface runoff and percolation (Eq. 3).
where PRECe was the effective precipitation and y the yield.
Finally, the WFgray is the volume of water necessary to assimilate the pollutants (the pollutants generally referenced in agricultural systems are fertilization and pesticide residues) generated up to the limits allowed by current legislation (IDEAM, 2019) and is obtained by dividing the load polluting by difference between the maximum permissible level of a pollutant and the natural concentration of it, divided by yield (Franke et al.,2013) (Eq. 4).
where α was the fraction of leaching that reaches fresh water, with 10% assumed for all fertilizers (Chapagain and Hoekstra, 2011), AR the amount of fertilizers applied (Tab. 1), Cmax the maximum acceptable concentration of leachate from fertilizers and reference values under Resolution 1575 (MAVDT, 2007) for chemical substances related to pesticides and fertilizers (for our case, a maximum value for nitrates (NO3) of 10 mg L-1 was assumed), and Cnat, the natural concentration of pollutants (value of zero (0) was assumed).
RESULTS AND DISCUSSION
Edaphoclimatic characteristics
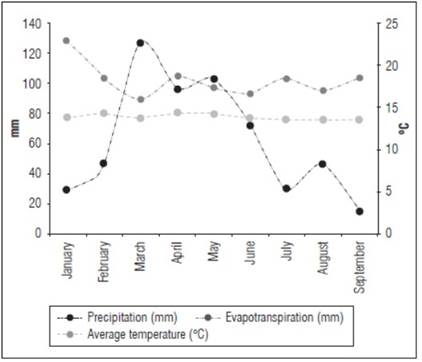
Climate monitoring allows adequate management of different agronomic activities to achieve a productive and sustainable model. The average temperature fluctuated between 13.5 and 14.4°C, with an average of 13.9°C, for February, 14.3°C for April and May, and between 13.5 and 13.8°C for the remaining months, typical of the cold climate of the area. The accumulated precipitation (565.4 mm) was lower than the accumulated evapotranspiration (919.4 mm), and the months with the highest precipitation (>100 mm), and the lowest evapotranspiration (89.5 and 97.4 mm) were March and May, although April registered 96 mm of precipitation. The monthly evapotranspiration was greater than the precipitation in the months of January, February, April, June, July, August and September, resulting in a water deficit (Fig. 1).
Water management must take full advantage of the weather conditions according to the results and the actual situation (Gao et al., 2021). Some studies have shown that the water requirement of the crop not only depends on its particular characteristics but also on the moment of the crop cycle, the environmental conditions and the planting location (Zhang et al., 2021).
The WF is mainly determined by temperature and precipitation (Zhang et al., 2015). To evaluate the efficiency and productivity of water, it is necessary to understand that its use is directly related to the water requirement of the crop, which can be supplied by water stored from precipitation in the soil as moisture (green water) or by irrigation (blue water) (Adeoti et al., 2021).
The main properties of the soil (Tab. 2) must be taken into account for the dynamic management of water through the efficient management of irrigation and the use of rainwater.
Table 2. Physical properties of the soil in the study area.
| %Sand | %Silt | %Clay | Texture | AD (g cc-1) | RD (g cc-1) | Total porosity (%) | SHC (cm h-1) | FC (%) | PWP (%) |
|---|---|---|---|---|---|---|---|---|---|
| 25 | 10 | 65 | Clayey | 1.18 | 2.26 | 49.1 | 0.1 | 46.5 | 37.8 |
AD; apparent density; RD: real density; SHC: saturated hydraulic conductivity; FC: field capacity; PWP: permanent wilting point.
The predominant texture was clayey (>65% content), which is reflected in a low hydraulic conductivity (0.09 cm h-1). The percentage of pores is adequate (49.1%); nevertheless, the distribution between macro (1.5%), meso (14.9%) and micropores (32.7%) is not favorable for drainage, due to the high clay content, since the movement, content and availability of water are subject to texture, structure, porosity, depth and organic matter content (Valenzuela and Torrente, 2010). Onion cultivation does not require deep soil, with 40-60 cm being sufficient, as long as there is good drainage, and develops in a pH range of 6.0 to 7.5 (does not tolerate acidity) and medium textures (Ruiz et al., 2013; Adeoti et al., 2021).
The pore space of the soil is sensitive to natural and anthropogenic impacts; any disturbance of the superficial soil layer (0-30 cm) by rain or tillage causes changes in its structure, affecting some soil hydraulic properties. Excessive tillage and loss of soil organic matter often lead to a reduction in the infiltration rate due to loss of surface porosity. When the intensity of the rain is greater than the infiltration rate, runoff ensues (Shaxson and Barber, 2005), hence the importance of the hydrodynamic parameters of the soil (Castro et al., 2009).
To calculate the water footprint, a summary of the data estimated during the onion bulb crop cycle is presented in Tab. 3.
Table 3. Crop evapotranspiration (ETc) and effective precipitation using two irrigation systems in Allium cepa.
| Month | Decadals (10 d) | Phenological state | ETc sprinkler (mm) | ETc drip (mm) | Effectiveprecipitation _ (mm) |
|---|---|---|---|---|---|
| Mar | 1 | Leaf development | 18.4 | 18.4 | 28.5 |
| Mar | 2 | 18.1 | 19.1 | 37.9 | |
| Mar | 3 | 15.7 | 19.7 | 34.3 | |
| Apr | 1 | 18.2 | 21.2 | 28.5 | |
| Apr | 2 | 18.6 | 20.6 | 26.0 | |
| Apr | 3 | 22.7 | 24.4 | 26.9 | |
| May | 1 | Bulbing | 23.7 | 25.7 | 29.0 |
| May | 2 | 22.4 | 25.4 | 29.9 | |
| May | 3 | 24.2 | 26.2 | 27.1 | |
| Jun | 1 | 22.1 | 24.1 | 24.6 | |
| Jun | 2 | 22.9 | 24.6 | 22.6 | |
| Jun | 3 | 23.1 | 25.1 | 16.7 | |
| Jul | 1 | Maturity | 23.6 | 25.6 | 8.0 |
| Jul | 2 | 21.6 | 23.6 | 1,3 | |
| Jul | 3 | 21.1 | 23.1 | 5.7 | |
| Aug | 1 | 4.4 | 6.4 | 1,3 | |
| Total | 423.8 | 456.2 | 378.3 |
Blue water footprint
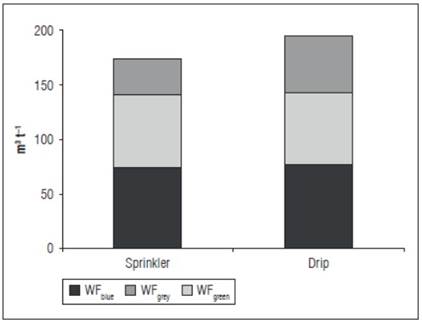
The WFblue not only includes the water evapotranspired and incorporated into the product, but also the water that evaporates during its storage (artificial water tanks), transport (open channels), treatment (in case it is not suitable for irrigation) and application efficiency, being a completely anthropic decision (Allen et al., 2006; Romero et al., 2016). A greater blue water footprint was found in the drip irrigation system (78.7 m3 t-1) compared to sprinkler (75.7 m3 t-1) (Fig. 2).
Green water footprint
The use of water from precipitation together with the properties of the soil will determine the green water footprint. Higher consumption was found in the sprinkler irrigation system (67.53 m3 t-1) versus drip irrigation (65.3 m3 t-1) (Fig. 2).
Gray water footprint
According to IDEAM (2019), leached water from agricultural activity contains intermediate compounds of the original molecules, including toxic cations, mineral nutrients, herbicides, and pesticides that would not have been mobilized without irrigation. Assuming that 20% of the amount of nitrogen applied during fertilization would contaminate the leached waters, mainly with nitrate, the application of nitrogen fertilization in sprinkler irrigation (147.8 kg ha-1) was 63.2% of that applied under drip irrigation of (233.7 kg ha-1)(Tab. 1), which created a larger gray footprint (52.4 m3 t-1) with respect to sprinkler irrigation (31.3 m3 t-1) (Fig. 2).
For onion cultivation under the conditions of Samaca (Colombia) and using the most common irrigation systems (Fig. 2), WF for sprinkler irrigation was 174.5 m3 t-1 with a yield of 56.02 t ha-1 compared to drip irrigation of 196.4 m3 t-1 with a yield of 57.9 t ha-1.
The WFgreen and WFblue were similar in the two irrigation systems (sprinkler 143.1 m3 t-1 and drop 144 m3 t-1). IDEAM (2019) mentions that transitory crops represent 18% of the total agricultural water demand, 13% of the total WFblue and 3% of the total WFgreen. In addition, Léllis et al. (2022), mention that in the case of WFgreen, the amount and distribution of precipitation condition WFblue, because in areas where rainfall supplies all or most of the crop's water requirements, this indicator is low.
Zhang et al. (2021) propose efficient water management agricultural practices to reduce the consumption of irrigation water, increase crop yields and develop sustainable agriculture to guarantee food security. Improving the rate of use of green water or reducing the use of blue water in agricultural planning can save irrigation water without reducing yield (Su et al., 2014).
Thus, for example, a greater WFgraywas found in drip irrigation (52.41 m3 t-1) compared to that of sprinkler (31.29 m3 t-1) due to fertigation, which applies a greater amount of nitrogen.
According to Mekonnen and Hoekstra (2011), the world average of the total water footprint for vegetables is 322 m3 t-1, (WFblue43, WFgreen 194 and WFgray 85 m3 t-1) and for onion specifically 271 m3 t-1 (WFblue 44, WFgreen 176 and WFgray 51 m3 t-1). Peñaloza-Sánchezet al. (2020) report, for Mexican conditions, a WF of the onion crop for the spring/summer cycle of 578.65 m3 t-1 (WFblue263, WFgreen293.3, and WFgray 22.9 m3 t-1) with a low yield of 7.69 t ha-1, contrary to the autumn/winter cycle withWF of 249.7 (WFblue 53,WFgreen 176.4, and WFgray 20.1 m3 t -1), with a yield of 20.4 t ha-1.The authors mention that the gray water footprint was underestimated because only the use of fertilizers and not pesticides was considered. Our results for sprinkler and drip irrigation systems (174.47 and 196.41 m3 t-1) were lower, while our results for WFgray in sprinkler (31.3 m3 t-1) and drip (52.4 m3 t-1) were higher.
In Colombia, the WF of agricultural indicator with the highest participation is WFgreen, due to the high rainfall that implies a lower requirement for irrigation water. This means that the cost of using water for agriculture is lower than in other countries, where agriculture depends on infrastructure and technologies for crop irrigation (IDEAM, 2023).
Castañeda and Ramírez (2016), for Colombia, report 164.59 m3 t-1 for WFblue and 324.07 m3 t-1 for WFgreen, higher than our results where the WF for the sprinkler irrigation system was 174.47 m3 t-1 and for drip 196.41 m3 t-1. The Instituto de Hidrología, Meteorología y Estudios Ambientales (IDEAM, 2019) estimated a national WFblueof 8.5 Mm3 year-1 and WFgreen of 34.6 Mm3 year-1 for the bulb onion crop for the year 2018, using the statistics on harvested area (12,695 ha), production volume (287,959 t) and average yield (22.68 tha-1) from the Ministry of Agriculture and Rural Development (2019). According to these estimates, WFblue was 29.51 m3 t-1 and WFgreen 120.15 m3 t-1, which are lower than our results for WFblue (sprinkler 75.7 m3 t-1and drip 78.7 m3 t-1), higher for WFgreen (sprinkler 67.5 m3 t-1 and drip 65.3 m3 t-1) and lower for yield (sprinkler 56.0 t ha-1 and drip 57.9 t ha-1). Other results on onion water footprint are listed in table 4.
Table 4. Water footprints (WF) reported in bulb onion (Allium cepa L.).
| Country | Authors | Production system | Wfblue (m3t-1) | WFgreen (m3t-1) | WFgray (m3 t-1) | WF (m3 t-1) |
|---|---|---|---|---|---|---|
| National Water Footprint | ||||||
| Colombia | Research results | Irrigation/sprinkler | 75.65 | 67.53 | 31.29 | 174.47 |
| Irrigation /drip | 78.72 | 65.28 | 52.4 | 196.41 | ||
| Castañeda and Ramírez (2016) | NR | 164.59 | 324.07 | NR | 488.66 | |
| *IDEAM, (2019) | NR | *29.51 | *120.15 | NR | *149.66 | |
| International Water Footprint | ||||||
| Mexico | Peñaloza-Sánchez et al. (2020) | Autumn/Winter | 53.0 | 176.4 | 20.1 | 249.7 |
| Spring/Summer | 263.0 | 293.3 | 22.9 | 578.65 | ||
| Nigeria | Adeoti et al. (2021) | Onion /dry | 2405.5 | 19.0 | 51.2 | 2475.7 |
| Chili | Novoa et al.(2019) | NR | NR | NR | NR | 36.0 |
| World average | Mekonnen and Hoekstra (2011) | NR | 44.0 | 176.0 | 51.0 | 271.0 |
NR: no reference, *: estimated value.
The information on the use of water by agricultural activity is limited for the Colombian context. The water footprint is a powerful instrument that not only quantifies the volume of water used but also allows for better multi-objective planning for saving water, evaluating new technologies, comparing production systems, evaluating different edaphoclimatic moments, reducing wastewater, finding the best economic gain, and seeking the greatest social impact (generated jobs), among others. The pressure on water will increase due to changes in ecosystems, climate change and the constant increase in the demand for food due to the increase in the population (Arévalo et al., 2011; Ríos et al., 2018).
CONCLUSIONS
This study found that the green and blue water footprint in the onion production system in Samaca (Colombia) of 143.59 m3 t-1 was lower than previous reports of 488.66 and 149.66 m3 t-1; in addition, the yield was 284.8% higher due to the use of crop water. These differences were attributed to technological changes and the greater blue water footprint of our experimental conditions. Additionally, differences were found in the gray water footprint of the irrigation systems with 31.29 m3 t-1 for sprinkler and 52.4 m3 t-1 for drip, mainly due to differences in nitrogen in the fertigation formulation. According to the results, the best option to reduce the water footprint of the onion crop is the sprinkler irrigation system due to its yield and lower gray water footprint.

