


 English (pdf)
 Article in xml format
 Article references
 Send this article by e-mail
 Cited by SciELO
  Cited by Google
  Similars in
SciELO
Similars in
SciELO  Similars in Google
 Permalink
INTRODUCTION
In Colombia, the largest production of fresh fruit from the oil palm (Elaeis guineensis Jacq.) is concentrated in the departments of Cesar, Atlántico, Guajira, Córdoba, Meta, Casanare, Caquetá, Magdalena, Nariño, Cauca, Santander, Norte de Santander, and Bolívar (Cardona et al., 2018). The department of Santander (central zone of the Colombian oil palm industry) ranks as the third department in terms of planted area, which highlights its economic importance at the national, regional, and local levels (Fedepalma, 2013). However, there are factors that limit the production and quality of the crop. Among the notable aspects is mineral nutrition, which is known to be responsible for high productivity during the production cycle. Therefore, it is of utmost importance that each nutrient is available in the soil solution in adequate quantities and concentrations (De Araujo, 2010; Kamireddy, 2023).
The validation of the nutritional status is carried out through plant tissue analysis as a complementary tool to soil analysis (Tullio and Rozane, 2022). This allows for the identification of the most limiting nutrients in the system and provides evidence for the timely and appropriate use of fertilizers, aiming to achieve high productivity and apply the minimum required quantities with low costs and environmental sustainability (Franco, 2007).
This nutritional diagnosis constitutes an efficient tool for detecting imbalances and assisting in the fertilization recommendation process. Typically, the diagnoses are developed based on the chemical analysis of foliar tissue and its subsequent comparison with optimal foliar levels (Critical levels or sufficiency ranges) (Texeira et al., 2007). Using this method, nutrients that fall outside these limits are considered to likely restrict the growth, production, and fruit quality (Martin-Prével, 1990; Lahav, 1995).
The planning, validation, and calibration of nutrient doses applied to the oil palm crop (Reis Junior et al., 2002) are carried out based on sampling and laboratory processing. Various methodologies have been suggested for determining nutritional imbalances and ensuring proper interpretation of the results, which, in conjunction with the achieved yields, lead to the optimization of crop productivity (Tullio and Rozane, 2022; Kamireddy, 2023)
Among the methods of nutritional diagnosis, the Diagnosis and Recommendation Integrated System (DRIS) proposed by Beaufils (1973) is a holistic nutrient content interpretation system developed to enhance the interpretation of the nutritional results, regardless of the plant's age. It classifies the elements according to their limitation in crop growth and development, allowing for universal use of the norms (Santana et al., 2008; Parent et al., 2020).
The advantage of this method lies in its ability to identify cases where crop production is limited by a nutritional imbalance, even when none of the elements fall below critical levels (Walworth and Sumner, 1987; Bangroo et al., 2010).
The DRIS method is based on calculating an index for each nutrient by comparing the relationships between an element and each of the other elements in the sample with the relationships developed for that same nutrient in a reference population (Guindani et al., 2009; Serra et al., 2012).
Currently, due to the efficiency in interpreting the results of chemical analysis of plant material for various crops, the integrated system of diagnosis and recommendation has gained widespread application worldwide. Since its inception with Beaufils' initial proposal, DRIS has been used for different plant species. Among the main species diagnosed by the DRIS method are: potato (Garza, 2000), maize (Youssef et al., 2013), soybean (Harger, 2008; Castamann et al., 2012), eucalyptus (Wadt, 1996), cotton (Serra et al., 2010), coffee (Partelli et al., 2007), sugarcane (Subiros and Salas, 1999), passion fruit (Carvalho, 2011), among others.
The DRIS method in Colombia has been developed for cut roses by Franco (2007) and for rubber cultivation by Chacón and Camacho (2013). Therefore, the aim of this study was to establish DRIS norms for oil palm cultivation under the conditions of the central zone of the Colombian oil palm industry.
MATERIALS AND METHODS
The research was conducted in commercial oil palm plantations, covering an area of 113 hectares planted in 2001 with IRHO material. The plantations are in the municipality of Sabana de Torres (Colombia), with geographical coordinates of 7°23'25'' N, 73°30'01'' W, at an altitude of 110 m a.s.l. The region experiences an annual precipitation ranging between 2000-4000 mm, with an average temperature exceeding 24°C (IGAC, 2003). The soil was classified as Fluventic Dystrudepts and is in the piedmont landscape. The topography consists of plateaus, hills, and moderately undulating surfaces with slopes ranging from 7 to 12% (IGAC, 2003).
The soil's chemical characteristic in the experimental area is acidic, with average pH values of 4.24. Aluminum saturation exceeded 50%, while the average base saturation was 35%, and aluminum content was 0.69 cmolc kg-1. Phosphorus levels were recorded at 32.39 mg kg-1. The exchangeable bases calcium (Ca), magnesium (Mg), potassium (K), and sodium (Na) had low values (0.52, 0.2, 0.14, and 0.05 cmolc kg-1, respectively), as well as the micronutrients, which were considered deficient in native contents.
Sampling and laboratory methodologies
The sampling was established using a rigid grid with 100×100 m, resulting in a total of 113 samples in an area of 113 ha, equivalent to one sample per hectare. Each point was georeferenced to locate the surrounding three palm trees to determine the sampling zone.
The plant tissue samples were taken following the methodology proposed by Cenipalma, specifically taking the leaflets from the middle part of the 17th leaf for adult plants. These samples were collected in May 2013, during a period of low precipitation and not close to fertilization, to reduce result variability as reported by Santacruz (2004). The samples were sent to the laboratory for nutrient quantification. For the analysis of foliar tissue samples, the contents of K, Ca, Mg, Na, Fe, Cu, Mn, and Zn were determined through dry digestion and atomic absorption; P and B were determined using colorimetry; N was determined through wet digestion and the Kjeldahl method, and S was determined using turbidimetry.
After collecting the samples, production data were recorded for each point. Considering that the production of oil palm is closely associated with rainfall, and with the aim of obtaining reliable data, six readings were conducted: three during the rainy season (March-April 2013) and three during dry periods (June-July 2013). The average of the six readings was multiplied by the planting density per hectare, which corresponds to 143 palm/ha. The obtained value was then multiplied by 24, as this is the number of harvests per year.
Determination of the reference population
The results of the chemical analysis of leaf tissue were organized together with the production records for each point. Subsequently, descriptive statistical analysis was conducted to obtain values for mean, standard deviation, and coefficient of variation. For production, quartiles were considered, where the population with the highest production, located in the upper quartile, was considered as the reference population, while the other quartiles represented the low production population. This provided a starting point for the establishment of the norms, as proposed by Chacón and Camacho (2013).
Development of DRIS norms
For the establishment of DRIS norms, the values of the results from the foliar tissue analysis of the reference population were taken into account, specifically those results related to productions equal to or greater than 31.1 t ha-1.
For the high productivity population, direct and inverse relationships between nutrients were calculated pairwise for the reference population. A direct relationship is one where the nutrient in question appears in the numerator (A/B), while an inverse relationship is one where the nutrient under study appears in the denominator (B/A). For each relationship, the mean (x), standard deviation (s), and coefficient of variation (CV) were calculated. The number of possible relationships (RP) is obtained using the following equation (1):
where, n was number of elements under study.
The determination of the norm to be used in the calculation of DRIS functions (A/B or B/A) was performed using the variance ratio method or F-value, defined as the ratio between the variances of the low productivity population (non-reference) and the high productivity population (reference). The norm of the relationship that had the highest variance ratio (S2) was chosen, following this procedure:
If:
Then: The reference that composes the norm is A/B.
If:
Then: The reference that composes the norm is B/A.
Where, i) When A/B is greater than or equal to a/b; ii) When A/B is less than or equal to a/b, where, A/B: Ratio of the sample; a/b: Ratio of the reference population, and CV: Coefficient of variation associated with the norm.
Establishment of DRIS indices
After calculating the functions, the calculation of the DRIS indices was performed using the general formula (2) proposed by Beaufils (1973), where for nutrient A:
Z: Number of functions corresponding to the nutrient index. With the established norms and after calculating the DRIS indices, the calculation of the Nutritional Balance Index (IBN) and the mean Nutritional Balance Index (IBNm) was performed, which consists of the sum of the absolute values of the DRIS indices obtained for each nutrient according to the following equation (3):
where, n was is the number of DRIS indices of nutrients involved in the analysis.
RESULTS AND DISCUSSION
Determination of the reference population
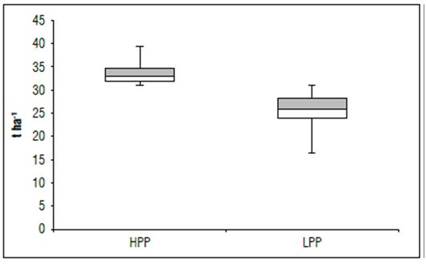
The production data ranging from 16.5 to 39.3 t ha-1, along with their respective foliar tissue nutrient levels, formed the database that was divided into two groups, considering the criterion for separating the high productivity population (reference) and the low productivity population as productions higher than 30.1 t ha-1, which corresponded to 25% of the samples, as suggested by Beaufils (1973).
This selection meets the conditions indicated by Letzsch and Sumner (1984), who consider that the high production population should consist of at least 10% of the observations in the global database, ensuring a high production population with significant differences from the low production population. This indicates that the proposed database for obtaining the norms is appropriate.
Figure 1 shows that the fresh fruit production data for the low productivity population, representing 75% of the data obtained, are located towards the upper limit, while the high productivity population shows the opposite pattern, with the same percentage of data located towards the lower limit, indicating a higher concentration of data in the second quartile, corresponding to productions between 32.98 and 34.64 t ha-1.
The values of means, standard deviations, and coefficients of variation for nutrient concentrations in foliar tissue, for the high and low productivity populations, indicate that, in general, the low productivity population mostly presents values similar to those obtained in the high productivity population, except for elements such as zinc, iron, and manganese (Tab. 1).
Table 1. Mean values, standard deviation, and coefficient of variation for nutrient concentration in foliar tissue for the high and low productivity populations.
| Nutrient | High productivity populations | Low productivity populations | ||||
|---|---|---|---|---|---|---|
| Mean | Standard deviation | CV (%) | Mean | Standard deviation | CV (%) | |
| N (%) | 2.85 | 0.14 | 4.99 | 2.85 | 0.08 | 2.78 |
| P (%) | 0.27 | 0.05 | 20.52 | 0.25 | 0.07 | 26.45 |
| K (%) | 1.02 | 0.19 | 18.2 | 1.06 | 0.21 | 19.74 |
| Ca (%) | 0.53 | 0.15 | 27.47 | 0.56 | 0.16 | 27.96 |
| Mg (%) | 0.28 | 0.09 | 32.25 | 0.27 | 0.08 | 29.97 |
| Cl (%) | 0.68 | 0.11 | 16.14 | 0.64 | 0.1 | 15.36 |
| Na (%) | 0.02 | 0.01 | 31.27 | 0.02 | 0.01 | 46.21 |
| Zn (mg kg -1) | 68.40* | 116.55 | 170.38 | 28.99* | 19.35 | 66.77 |
| Cu(mg kg -1) | 6.65 | 4.94 | 74.31 | 6.85 | 3.14 | 45.82 |
| Fe (mg kg -1) | 157.15* | 45.07 | 28.68 | 120.74* | 33.49 | 27.73 |
| Mn(mg kg -1) | 218.8 | 74.49 | 34.05 | 236.44 | 69.91 | 29.57 |
| S (%) | 0.27* | 0.03 | 10.46 | 0.25* | 0.03 | 11.81 |
| B (mg kg -1) | 23.09 | 9.48 | 41.08 | 23.92 | 8.22 | 34.36 |
* = Significance (P<0.05).
For both populations, the nitrogen content in foliar tissue had the lowest coefficients of variation, 5 and 3.2% respectively, demonstrating the stability of the element throughout the population.
In the case of Zinc, which is one of the elements that shows a difference in content between the two populations used as reference, a high variability can be observed in the high productivity population with a coefficient of variation of 170%. Therefore, this element may have a significant impact on the variability of fresh fruit production in Palm.
Diagnosis and Recommendation Integrated System (DRIS)
Determination of DRIS foliar norms
The mean values of the nutrient relationships for the high and low productivity populations, along with their respective coefficients of variation and variances, are shown in table 2. The criterion for selecting the norm between the nutrient pair (N/P or P/N) was based on the relationship between the variances of the productivity groups (Silveira, 2005). According to Payne et al. (1990), relationships between elements that have a high variance ratio provide greater reliability for nutritional diagnosis.
Table 2. Relationships and selected norms for IRHO oil palm in the central region of Colombia.
| Relationships | High productivity populations | Low productivity populations | |||||||
|---|---|---|---|---|---|---|---|---|---|
| Mean | F | CV (%) | S2 A | Mean | F | CV (%) | S2 B | S2 B/S2 A | |
| N/P | 11.16 | 2.25 | 20.20 | 5.08 | 11.98 | 2.66 | 22.21 | 7.07 | 1.39 |
| N/K | 2.90 | 0.61 | 21.17 | 0.38 | 2.81 | 0.68 | 24.15 | 0.46 | 1.22 |
| N/Cl | 4.30 | 0.70 | 16.40 | 0.50 | 4.53 | 0.68 | 15.09 | 0.47 | 0.94 |
| 100N/Zn | 7.95 | 4.18 | 52.56 | 17.46 | 11.88 | 3.91 | 32.93 | 15.30 | 0.87 |
| 100N/Cu | 62.63 | 39.50 | 63.07 | 1560.27 | 53.44 | 33.61 | 62.89 | 1129.42 | 0.72 |
| 100N/Fe | 1.95 | 0.57 | 29.07 | 0.32 | 2.55 | 0.75 | 29.57 | 0.57 | 1.76 |
| 100N/Mn | 1.43 | 0.42 | 29.78 | 0.18 | 1.35 | 0.74 | 54.79 | 0.55 | 3.02 |
| N/S | 10.45 | 1.11 | 10.66 | 1.24 | 11.61 | 1.32 | 11.37 | 1.74 | 1.403 |
| 100N/B | 14.23 | 5.70 | 40.08 | 32.51 | 13.58 | 5.65 | 41.60 | 31.91 | 0.98 |
| P/K | 0.27 | 0.09 | 33.32 | 0.01 | 0.26 | 0.13 | 49.33 | 0.02 | 1.98 |
| P/Cl | 0.40 | 0.12 | 29.25 | 0.01 | 0.40 | 0.11 | 27.90 | 0.01 | 0.88 |
| 100P/Zn | 0.75 | 0.48 | 63.54 | 0.23 | 1.05 | 0.48 | 45.92 | 0.23 | 1.03 |
| 100P/Cu | 5.65 | 3.36 | 59.35 | 11.26 | 4.90 | 3.93 | 80.31 | 15.46 | 1.37 |
| 100P/Fe | 0.18 | 0.07 | 37.49 | 0.00 | 0.22 | 0.08 | 36.43 | 0.01 | 1.40 |
| 100P/Mn | 0.14 | 0.06 | 43.37 | 0.00 | 0.12 | 0.07 | 58.09 | 0.00 | 1.38 |
| P/S | 0.97 | 0.21 | 21.80 | 0.04 | 1.02 | 0.25 | 24.35 | 0.06 | 1.36 |
| K/Ca | 2.01 | 0.52 | 25.74 | 0.27 | 1.97 | 0.44 | 22.16 | 0.19 | 0.71 |
| K/Cl | 1.53 | 0.36 | 23.50 | 0.13 | 1.69 | 0.43 | 25.55 | 0.19 | 1.43 |
| 100K/Zn | 2.74 | 1.36 | 49.53 | 1.84 | 4.38 | 1.61 | 36.72 | 2.59 | 1.40 |
| 100K/Cu | 22.24 | 14.77 | 66.42 | 218.20 | 19.44 | 11.90 | 61.24 | 141.70 | 0.64 |
| 100K/Fe | 0.69 | 0.24 | 34.41 | 0.06 | 0.95 | 0.34 | 35.78 | 0.11 | 2.01 |
| 100K/Mn | 0.50 | 0.16 | 31.28 | 0.02 | 0.50 | 0.32 | 62.87 | 0.10 | 4.04 |
| K/S | 3.72 | 0.69 | 18.64 | 0.48 | 4.36 | 1.15 | 26.46 | 1.33 | 2.76 |
| 100K/B | 4.96 | 1.80 | 36.31 | 3.25 | 5.09 | 2.56 | 50.40 | 6.57 | 2.02 |
| Ca/N | 0.19 | 0.05 | 28.01 | 0.00 | 0.20 | 0.06 | 27.99 | 0.00 | 1.09 |
| Ca/P | 2.15 | 0.79 | 36.99 | 0.63 | 2.44 | 0.95 | 38.79 | 0.89 | 1.42 |
| 100Ca/Zn | 1.40 | 0.66 | 47.50 | 0.44 | 2.28 | 0.86 | 37.82 | 0.74 | 1.68 |
| 100Ca/Fe | 0.36 | 0.12 | 33.63 | 0.01 | 0.50 | 0.20 | 40.18 | 0.04 | 2.81 |
| 100Ca/Mn | 0.26 | 0.07 | 28.94 | 0.01 | 0.27 | 0.21 | 79.11 | 0.05 | 8.11 |
| Ca/S | 1.94 | 0.48 | 24.69 | 0.23 | 2.29 | 0.66 | 28.96 | 0.44 | 1.91 |
| 100Ca/B | 2.64 | 1.36 | 51.59 | 1.85 | 2.68 | 1.35 | 50.56 | 1.83 | 0.99 |
| Mg/N | 0.10 | 0.03 | 33.62 | 0.00 | 0.10 | 0.03 | 29.47 | 0.00 | 0.74 |
| Mg/P | 1.05 | 0.30 | 28.86 | 0.09 | 1.11 | 0.24 | 21.27 | 0.06 | 0.61 |
| Mg/K | 0.28 | 0.10 | 36.25 | 0.01 | 0.28 | 0.12 | 43.42 | 0.01 | 1.38 |
| Mg/Ca | 0.57 | 0.28 | 49.09 | 0.08 | 0.54 | 0.28 | 50.70 | 0.08 | 0.98 |
| Mg/Cl | 0.42 | 0.14 | 33.29 | 0.02 | 0.43 | 0.13 | 29.90 | 0.02 | 0.86 |
| Mg/Na | 17.04 | 8.59 | 50.37 | 73.71 | 16.02 | 8.19 | 51.09 | 67.02 | 0.90 |
| 100Mg/Zn | 0.79 | 0.54 | 68.29 | 0.29 | 1.15 | 0.50 | 43.10 | 0.25 | 0.84 |
| 100Mg/Cu | 5.79 | 4.17 | 72.13 | 17.42 | 5.19 | 4.01 | 77.21 | 16.04 | 0.92 |
| 100Mg/Fe | 0.19 | 0.09 | 46.97 | 0.01 | 0.24 | 0.09 | 36.77 | 0.01 | 1.00 |
| 100Mg/Mn | 0.14 | 0.07 | 47.88 | 0.00 | 0.13 | 0.07 | 51.90 | 0.00 | 0.98 |
| Mg/S | 1.01 | 0.34 | 33.46 | 0.12 | 1.11 | 0.31 | 27.54 | 0.09 | 0.81 |
| 100Mg/B | 1.37 | 0.71 | 51.67 | 0.50 | 1.30 | 0.61 | 46.66 | 0.37 | 0.73 |
| Cl/Ca | 1.36 | 0.41 | 30.08 | 0.17 | 1.25 | 0.49 | 38.94 | 0.24 | 1.41 |
| 100Cl/Zn | 1.87 | 0.98 | 52.40 | 0.96 | 2.70 | 1.02 | 37.78 | 1.04 | 1.08 |
| 100Cl/Cu | 15.11 | 10.46 | 69.22 | 109.45 | 11.93 | 7.28 | 61.04 | 53.00 | 0.48 |
| 100Cl/Fe | 0.47 | 0.16 | 34.85 | 0.03 | 0.58 | 0.19 | 32.64 | 0.04 | 1.33 |
| 100Cl/Mn | 0.34 | 0.11 | 33.31 | 0.01 | 0.30 | 0.14 | 48.19 | 0.02 | 1.61 |
| 100Cl/S | 2.49 | 0.50 | 19.84 | 0.25 | 2.63 | 0.54 | 20.39 | 0.29 | 1.17 |
| Na/N | 0.01 | 0.00 | 30.66 | 0.00 | 0.01 | 0.00 | 45.73 | 0.00 | 2.73 |
| Na/P | 0.07 | 0.03 | 38.04 | 0.00 | 0.09 | 0.05 | 55.35 | 0.00 | 3.11 |
| Na/K | 0.02 | 0.01 | 31.16 | 0.00 | 0.02 | 0.01 | 51.43 | 0.00 | 3.16 |
| Na/Ca | 0.04 | 0.01 | 35.75 | 0.00 | 0.04 | 0.02 | 45.30 | 0.00 | 1.76 |
| Na/Cl | 0.03 | 0.01 | 34.84 | 0.00 | 0.03 | 0.01 | 46.35 | 0.00 | 2.4 |
| 100Na/Zn | 0.05 | 0.03 | 59.46 | 0.00 | 0.08 | 0.04 | 49.21 | 0.00 | 1.81 |
| 100Na/Fe | 0.01 | 0.01 | 42.61 | 0.00 | 0.02 | 0.01 | 47.20 | 0.00 | 2.45 |
| 100Na/Mn | 0.01 | 0.00 | 39.38 | 0.00 | 0.01 | 0.01 | 67.56 | 0.00 | 3.19 |
| Na/S | 0.07 | 0.02 | 31.67 | 0.00 | 0.08 | 0.04 | 45.70 | 0.00 | 3.17 |
| 100Na/B | 0.09 | 0.05 | 52.46 | 0.00 | 0.10 | 0.07 | 72.11 | 0.01 | 2.28 |
| Cu/100Ca | 0.13 | 0.09 | 66.26 | 0.01 | 0.13 | 0.07 | 55.49 | 0.01 | 0.71 |
| Cu/100Na | 4.57 | 5.73 | 125.22 | 32.82 | 3.91 | 2.58 | 66.00 | 6.65 | 0.20 |
| Cu/Zn | 0.17 | 0.13 | 79.16 | 0.02 | 0.28 | 0.14 | 49.95 | 0.02 | 1.09 |
| Cu/Fe | 0.04 | 0.02 | 56.26 | 0.00 | 0.06 | 0.03 | 49.10 | 0.00 | 1.55 |
| Cu/100S | 0.24 | 0.14 | 61.18 | 0.02 | 0.28 | 0.14 | 50.07 | 0.02 | 0.95 |
| Fe/Zn | 33.09 | 21.29 | 64.33 | 453.09 | 22.80 | 17.54 | 76.96 | 307.77 | 0.67 |
| Fe/Mn | 0.76 | 0.22 | 28.47 | 0.05 | 0.59 | 0.50 | 84.28 | 0.25 | 5.29 |
| Mn/Zn | 6.01 | 3.71 | 61.68 | 13.74 | 9.93 | 4.24 | 42.65 | 17.94 | 1.30 |
| Mn/Cu | 45.09 | 25.51 | 56.57 | 650.52 | 42.37 | 25.58 | 60.37 | 654.32 | 1.00 |
| 100S/Zn | 0.74 | 0.36 | 48.69 | 0.13 | 1.02 | 0.34 | 32.83 | 0.11 | 0.87 |
| 100S/Fe | 0.18 | 0.04 | 22.97 | 0.00 | 0.22 | 0.07 | 29.63 | 0.00 | 2.38 |
| 100S/Mn | 0.14 | 0.04 | 29.19 | 0.00 | 0.12 | 0.08 | 63.37 | 0.01 | 3.55 |
| B/100P | 0.90 | 0.36 | 40.34 | 0.13 | 1.01 | 0.42 | 42.11 | 0.18 | 1.36 |
| B/100Cl | 0.35 | 0.14 | 41.17 | 0.02 | 0.38 | 0.14 | 37.79 | 0.02 | 1.01 |
| B/Zn | 0.64 | 0.39 | 61.61 | 0.15 | 0.98 | 0.43 | 43.52 | 0.18 | 1.18 |
| B/Cu | 4.82 | 3.22 | 66.92 | 10.40 | 4.40 | 3.03 | 68.81 | 9.17 | 0.88 |
| B/Fe | 0.16 | 0.08 | 51.76 | 0.01 | 0.22 | 0.10 | 47.49 | 0.01 | 1.56 |
| B/Mn | 0.11 | 0.05 | 48.30 | 0.00 | 0.11 | 0.09 | 79.97 | 0.01 | 2.82 |
| B/100S | 0.84 | 0.34 | 39.66 | 0.11 | 0.97 | 0.34 | 35.17 | 0.12 | 1.03 |
CV: coefficient of variation, F (Sb/Sa): ratio of variances between high and low production populations, respectively. The elements N, P, K, Ca, Mg, Cl, Na, and S are presented in percentage, while the rest are in mg kg-1.
This procedure determines norms with greater precision (Caldwell et al., 1994), increasing the distinction between nutritionally balanced and unbalanced plants (Walworth et al., 1986; Walworth and Sumner, 1987). Out of the 156 possible relationships, 78 were selected based on the criterion of higher variance ratio. Comparing the norms with the relationships of the low-performance population shows that 53 have a lower variance, 52 have differences in the mean, and 42 have both characteristics. The coefficients of variation (CV) range from 10 to 125%, with 25 norms having a CV greater than 50%.
The large number of norms with differences either in variance or mean compared to the low-performance population suggests that the norms are reliable and can indicate productivity differences resulting from nutritional imbalances (Ruíz-Bello and Cajuste, 2002). Similarly, when there is a very low variance for a norm in the high-performance population (high F values, greater than 2) and the mean varies little (coefficients of variation less than 25%), it can be affirmed that the crop is susceptible to imbalance by even a small change in that element (Reis and Monnerat, 2002).
In the presented norms, the K/S and 100S/Fe relationships exhibit these conditions, suggesting that small changes in Sulfur concentrations have a high impact on yield. With the obtained norms, the calculation of functions was performed for each element and their respective DRIS indices, aiming to identify the possible positive or negative incidence due to deficiencies, excesses, or imbalances of each element according to the methodology reported by Beaufils (1973) and Parent et al. (2020). The DRIS indices can be interpreted as being in balance, excess, or deficient if they are equal to, greater than, or less than zero.
Based on the above, the interpretation of the nutritional diagnosis result indicates that the order of limitation, from least to greatest, is as follows: iron, zinc, sulfur, phosphorus, chlorine, magnesium, boron, sodium, potassium, calcium, copper, manganese, and nitrogen. The average value of the indices is presented in table 3.
Table 3. Foliar DRIS indices for the oil palm crop (Elaeis guineensis Jacq.) IRHO for the palm trees of Santander plantation.
| Nutrient | DRIS Index |
|---|---|
| N | 27.59 |
| P | -1.29 |
| K | 2.93 |
| Ca | 3.78 |
| Mg | -0.69 |
| Cl | -0.76 |
| Na | 2.64 |
| Zn | -6.80 |
| Cu | 5.25 |
| Fe | -7.14 |
| Mn | 5.74 |
| S | -2.05 |
| B | 0.99 |
| IBN | 67.67 |
| IBNm | 5.21 |
In the entire population, the indices of the macronutrients showed positive values for nitrogen (27.59), potassium (2.93), and calcium (3.78), and negative values for phosphorus (-1.29), magnesium (-0.69), and sulfur (-2.05). This could imply that low yields may be limited not only by nutritional deficiency but also by excess concentration, considering that nutrients have a nutritional balance closer to zero for their DRIS index (Sharma, 2005). Elements that are in excess conditions, such as nitrogen, potassium, and calcium, are typically supplied to plants through fertilization, taking into account that sources such as urea, potassium chloride, and liming materials are commonly used in the crop (González and Romero, 2010).
For the micronutrients copper and manganese, values higher than zero were found, with manganese having the highest index value of 5.74. Boron showed an index of 0.99, indicating relative equilibrium, likely due to frequent applications of this element in the crop (Arias and Munévar, 2004).
On the contrary, iron and zinc exhibited negative values of -7.14 and -6.80, respectively, indicating that the production of fresh palm fruit is being limited by the deficiency of these two elements.
CONCLUSION
Nutritional diagnosis using the DRIS technique revealed the following decreasing order of deficiencies based on foliar tissue concentrations: Fe>Zn>S>P>Cl>Mg>B>Na>K>Ca>Cu=Mn>N.
One of the main nutritional limitations identified is the excess of nitrogen, as well as the limitation due to zinc deficiency and its positive response to yield. Boron, one of the elements applied most frequently in palm areas, maintains a balanced foliar concentration.
Furthermore, it was found that any changes in sulfur concentration have a high impact on yield, as observed in the K/S and 100S/Fe norms.

