


 Inglés (pdf)
 Articulo en XML
 Referencias del artículo
 Enviar articulo por email
 Citado por SciELO
  Citado por Google
  Similares en
SciELO
Similares en
SciELO  Similares en Google
 Permalink
INTRODUCTION
Quinoa (Chenopodium quinoa), originally from the Andes, contains high nutritional value, whose importance is increasingly recognized in food security (Bazile et al., 2014). It presents potential for adaptation to various environmental conditions and different production arrangements, thanks to its genetic diversity (Anchico et al., 2020). Agroindustrially, quinoa is considered a functional food given the great benefits it provides to health and transformation processes (Sharma et al., 2021). This grain has high quality protein due to its content of essential amino acids, as well as micronutrients, vitamins, minerals, and phenolic compounds (Pereira et al., 2019; Anchico-Jojoa et al., 2023). Quinoa is presented as an option in integrated systems, given its high biomass production, which can reach up to 8 t ha-1, useful for soil protection and organic matter contribution. Additionally, the residues can generate possibilities for use in animal feed, integrating the systems in a broader way (Spehar et al., 2011; Fernández-Paredes et al., 2017). According to Burbano-Figueroa et al. (2022), greater crop diversity allows production systems to cope with the numerous risks and uncertainties involved in agricultural production.
In Colombia, the most commercially used varieties are Aurora, Piartal, Blanca Dulce de Jericó, and Tunkahuan (García-Parra et al., 2020). The department of Cauca is one of the most representative in terms of production, with approximately 1,453 ha, mainly located in the Colombian Massif (Montes et al., 2020). On the other hand, coffee production in Colombia has expanded in departments such as Cauca, Huila, and Nariño (FNC, 2018). However, climate change, rising production costs, and insufficient labor present threats to the conservation of coffee production systems (Ocampo and Álvarez, 2017). In that sense, it is necessary to propose the diversification of coffee systems, in which new production options are established through alternative crops with commercial and nutritional potential. This practice allows the recovery or reduction of coffee crop establishment costs and protects it from cold winds at night or temporary shading in periods of water deficit. These alternatives generate income and can reduce production costs during the first two years of coffee development (Moreno and Sánchez, 2013).
Taking the above into account, this research aimed to evaluate and compare the agronomic characteristics of 10 quinoa genotypes intercropped with the Castillo coffee variety at an altitude of 1,800 m in Popayan-Cauca with the Castillo coffee variety in conditions of Popayan (Colombia), in order to determine their potential for adaptation in intercropping systems in coffee-growing regions of Colombia.
MATERIALS AND METHODS
The research project was carried out in La Claridad rural district in the experimental farm La Prosperidad, 2 km from the city of Popayan (Colombia), altitude of 1,800 m, average temperature of 19°C, and 2°27'28" N and 76°37'18" W. It has a maximum temperature of 29°C in the months of July, August and September and a minimum of 10°C, with an average annual precipitation of 1,941 mm (CAMP, 2022). The soil in the experimental area is derived from volcanic ashes and is classified by the USDA as "Oxic Distropepts" (Inceptisols) (SGC, 2013). It has a pH of 5.74 and an organic matter content of 10.83% according to soil analysis. Coffee replanting was carried out in August 2019, and quinoa planting was done in July 2020.
Vegetal material
BRS Syetetuba: a variety commercially used in Brazil, presents a light pink hypocotyl, polyform leaves, an erect stem of green or purple color from which branching with differentiated inflorescences is detached. When it reaches its physiological maturity, the plant turns yellow, its grains are cylindrical and flat, with a white pericarp being involved in the perigonium that opens at maturity. It reaches an average grain yield of 2,300 and 7.5 t ha-1 of total biomass. It has a cycle of 120 d from emergence to harvesting point (Spehar et al., 2011). Genotype selected from this variety: BCX1, BCX2, BCX4, BCX5, and BCX6.
Tunkahuan: originated from a germplasm population in Ecuador's Carchi province. It has an erect growth, reaches an average height of 144 cm, a pivot root, a round stem of light green color, a clustered panicle of immature light green color and orange-yellow in maturation, white grain of 1.7 to 2.1 mm. It achieves yields of 2,200 kg ha-1 on average, its vegetative cycle lasts 180 d, so it is considered a semi-late variety, slightly susceptible to drought and frost, tolerant to excess moisture and hail (Nieto et al., 1992). Selected genotype: TUN.
Blanca Dulce de Jericó: originating from Boyaca and Cundinamarca (Colombia), it has a high posture, with open branches from the base, its panicle is pinkish white, and it is characterized as semi-late. It can have yields between 2,475 to 2,814 kg ha-1 at altitudes of 2,400 m in regions such as Nariño - Colombia (Sañudo et al., 2005). Selected genotype: BLA.
Piartal: originating from northern Ecuador, a purple-colored plant, reaches heights of 245 cm, opaque white grain of approximately 2 mm in diameter and is susceptible to mildew (Peronospora farinosa). Its vegetative cycle can take between 160 to 178 d at harvest time (Álvarez et al., 1990). Selected genotype: PRI.
Aurora: considered early, its cycle from sowing to harvest is less than six months. It has a low posture with a size of 90 to 130 cm, the panicle when it reaches maturity presents a white-pinkish hue, its branches are small, and its flowers are distributed in a semi-compact way (Sañudo et al., 2005). Selected genotype: AUR and SAN.
Experimental design: the experimental plots consisted of three rows planted in the coffee crop lanes in a zoca state. The experimental area was 406 m² (29×14 m), divided into four blocks (repetitions) of 29.0×1.5 m for an area per block of 43.5 m², each composed of 10 plots of 3.0×1.5 m and separated by 1 m between them (Fig. 1).
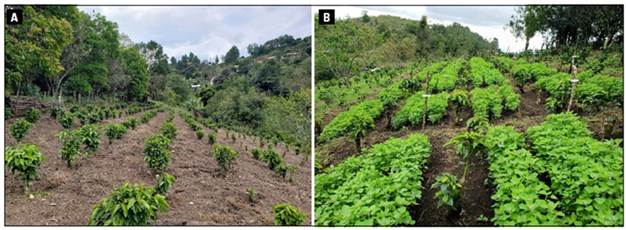
Figure 1. A, coffee crop in a fallow state; B, intercropped quinoa and coffee crop in a fallow state.
The experiment was conducted in completely randomized blocks. The plots consisted of five progenies of BRS Syetetuba (BCX1, BCX2, BCX4, BCX5, and BCX6), and five accessions (San José, Aurora, Piartal, Tunkahuan, Blanca Dulce de Jericó) obtained from evaluations at altitudes ranging from 1,100 to 1,800 m (Anchico et al., 2020). The sowing was done manually, using a trickle method with a density of 50 seeds per linear meter. Thinning was carried out 20 d later to achieve a final density of 30 plants per linear meter. One month before sowing, 150 g of dolomitic lime and 1 kg of organic fertilizer (lombricompost) per linear meter were applied. Fertilization was done according to soil analysis results and following the recommendations of Spehar (2007), which suggest applying N 60 kg ha-1, P 60-90 kg ha-1, and K 60 kg ha-1 per ton of grain produced. In that manner, for the entire cycle, 21 g of NPK/m2 in equal quantities, divided into two stages: the first at the time of planting and the second 45 d after planting.
Phenological evaluation of quinoa: the phenological cycle was evaluated in days after sowing (DAS) until each plot reached 50% of plants in each phase and codes of the BBCH (Anchico-Jojoa et al., 2021). The following parameters were analyzed: days to emergence, days to formation of the first, second, and third pair of true leaves, days to branching, days to initial panicle formation, days to panicle formation, days to initial flowering, days to flowering, days to formation of watery, milky, pasty grain, and days to physiological maturity.
Agronomic evaluation of quinoa
Plant height: 10 random plants were selected from each plot, and the measurement was taken from ground level to the apex of the inflorescence before harvest. The measurement was expressed in centimeters (cm).
Length of central panicle: 10 random plants were selected from each plot, and the length of the panicle was measured from the main vertex to the base of insertion. The measurement was expressed in centimeters (cm).
Panicle circumference: 10 random plants were selected from each plot, and the circumference of the main panicle was measured in the middle section. The measurement was expressed in centimeters (cm).
Dry matter yield: selected plants from the usable area were cut at the base and dried in natural conditions until reaching a constant weight. They were then weighed, and the result was extrapolated to kg ha-1.
Harvest index (HI): it was determined by dividing the weight of grains by the weight of dry matter of the selected plants from the usable area, obtaining a percentage representing the grain-to-plant ratio, using the formula 1:
Weight of 1,000 grains: according to the methodology of rules for grain analysis (Souza et al., 2017), a sample of pure seed was taken, and the weight of 1,000 grains was calculated in grams, using the following formula 2:
Eight repetitions of 100 seeds were used.
Dry grain yield/ha. After harvesting and undergoing the drying and cleaning process, the calculation of dry grain yield/ha was performed using the following formula 3:
Evaluation of coffee intercropped with quinoa and in monoculture: plant height, number of leaves per branch, and number of branches per plant, for coffee intercropped with quinoa and in monoculture at the zoca stage. An analysis of variance was conducted for the evaluated variables, and they were compared using the Tukey test with SPSS software. Additionally, Pearson's correlation coefficient was calculated.
RESULTS AND DISCUSSION
Phenological cycle
No statistical differences were observed during the vegetative phase (V0 to V5) according to the analysis of variance (P≤0.05). However, significant differences were detected during the reproductive phase (R5 to R12) (Tab. 1).
Table 1. Phenological cycle of quinoa intercropped with coffee at the zoca stage, in days after sowing (DAS).
| Genotypes | V0 | V1 | V2 | V3 | V4 | R5 | R6 | R7 | R8 | R9 | R10 | R11 | R12 |
|---|---|---|---|---|---|---|---|---|---|---|---|---|---|
| San José | 4.0 a | 16.0 a | 23.0 a | 27.0 a | 34.0 a | 40.0 a | 43.0 a | 50.0 a | 54.0 a | 68.0 a | 79.0 a | 89.0 a | 92.0 a |
| BCX 1 | 4.0 a | 16.0 a | 23.5 a | 27.2 a | 33.0 a | 44.0 b | 47.0 b | 54.7 ab | 59.0 b | 79.2 b | 83.7 b | 96.0 b | 99.0 b |
| Aurora | 4.0 a | 16.0 a | 23.0 a | 27.0 a | 34.5 a | 45.0 bc | 47.0 b | 56.5 bc | 60.7 b | 79.0 b | 89.0 c | 102.2 c | 106.5 c |
| Piartal | 4.0 a | 16.0 a | 23.5 a | 27.0 a | 34.5 a | 47.0 c | 50.0 c | 59.0 bcd | 61.0 b | 82.0 b | 96.0 d | 110.0 d | 113.0 d |
| BCX4 | 4.0 a | 16.0 a | 23.0 a | 27.0 a | 33.5 a | 51.0 d | 55.5 d | 60.5 cde | 67.7 c | 82.0 b | 89.5 c | 103.0 c | 106.0 c |
| BCX5 | 4.0 a | 16.0 a | 23.0 a | 27.0 a | 33.5 a | 54.0 e | 57.0 d | 62.5 de | 69.5 cd | 89.0 c | 96.0 d | 110.0 d | 113.0 d |
| BCX6 | 4.0 a | 16.0 a | 23.0 a | 27.0 a | 36.0 a | 56.2 f | 60.0 e | 62.0 de | 68.7 cd | 92.5 cd | 102.2 e | 110.0 d | 113.0 d |
| BCX2 | 4.0 a | 16.0 a | 23.0 a | 27.0 a | 33.0 a | 54.0 e | 57.0 d | 64.5 e | 71.2 de | 94.2 d | 102.7 e | 110.0 d | 112.7 d |
| Tunkahuan | 4.0 a | 16.0 a | 23.0 a | 27.0 a | 34.0 a | 53.5 e | 56.2 d | 65.0 ef | 68.7 cd | 89.0 c | 99.5 de | 110.0 d | 113.0 d |
| Blanca dulce | 4.0 a | 16.2 a | 23.5 a | 27.0 a | 36.0 a | 54.0 e | 57.0 d | 70.0 f | 73.7 e | 96.0 d | 110.0 f | 114.0 e | 118.0 e |
| Mean | 4 | 16.02 | 23.15 | 27.02 | 34.2 | 49.87 | 52.97 | 60.47 | 65.42 | 85.09 | 94.76 | 105.42 | 108.62 |
| CV (%) | 5.89 | 5.87 | 7.45 | 9.65 | 9. 83 | 12.09 | 16.67 | 18.58 | 17.45 | 16.40 | 14. 30 | 11.64 | 11.10 |
| F | 1 | 1 | 0.80 | 1 | 2.78 | 165.61* | 141.65* | 28.282* | 93.36* | 103.40* | 114.33* | 1091.86* | 1997.89* |
V0: emergence, V1: first pair of true leaves, V2: second pair of true leaves, V3: third pair of true leaves, V4: branching, R5: beginning of panicle initiation, R6: panicle development, R7: onset of flowering, R8: flowering, R9: watery grain, R10: milky grain, R11: doughy grain, R12: physiological maturity. Means followed by the same letters do not show significant differences according to the Tukey's test (P≤0.05). *Significant differences at a 5% probability level. CV (%): coefficient of variation.
Based on the Tukey's mean comparison test (P≤0.05), differences were found among genotypes for the phenological cycle, with a duration ranging from 92 to 118 d until physiological maturity (Tab. 1). This allows determining earliness according to the classification scale proposed by Wahli (1990), who considers materials as early when their fruiting days are less than 130 d. On the other hand, all quinoa genotypes emerged within 4 d, which is consistent with the data obtained by Anchico et al. (2020) under similar conditions. Additionally, Montes et al. (2018) reported emergence within 3 d at an average temperature of 7 to 12.5°C when evaluating the genotypes Aurora, Tunkahuan, and Blanca dulce de Jericó. López et al. (2008) reported emergence for ‘Piartal’ at 7 d at an altitude of 2,400 m, with average temperatures of 16°C and an annual precipitation of 1,100 mm. Thus, it can be determined that the germination time of quinoa can vary depending on the genotype and environmental conditions (Boero et al., 2000), highlighting its adaptability potential to different environments. It is known that the effects of temperature on plants are substantial and often lead to variations in germination, growth, and/or crop yield (Anchico-Jojoa et al., 2021). Moreover, quinoa is an efficient water user and tolerant to soil moisture deficiency, achieving acceptable yields with precipitation ranging from 100 to 200 mm (FAO, 2011).
Statistically significant differences were observed among genotypes from the beginning of panicle formation (R5). ‘San José’ was the first to initiate this stage at 40 d after sowing (DAS), followed by ‘BCX6’ at 56 DAS (Tab. 1). Delgado et al. (2009) reported panicle formation for the genotypes Piartal, Blanca dulce de Jericó, and Tunkahuan at 64, 77, and 72 d, respectively. Similarly, López et al. (2008) reported averages of 66 d. These results differ from those obtained in the present study, where the ‘Piartal’, ‘Tunkahuan’, and ‘Blanca dulce de Jericó’ showed panicle initiation at 47, 53, and 54 d, respectively, likely due to the materials being evaluated under lower altitude and higher temperature conditions. Likewise, the genotypes originating from BRS Syetetuba showed earliness in panicle formation, confirming that quinoa is highly sensitive to temperature due to thermal accumulation processes (Anchico-Jojoa et al., 2021).
Regarding the evaluation of days to flowering, a range of 54 to 73 DAS was observed. Studies conducted by Montes et al. (2018) at 3,023 m a.s.l. with the ‘Aurora’, ‘Tunkahuan’, and ‘Blanca dulce de Jericó’ reported averages of 126 DAS for flowering. Variability in flowering initiation and flowering times was evident among genotypes, allowing for the selection of materials for specific environments (Bonifacio et al., 2004). The quinoa cycle under the conditions of this research ranged from 92 to 118 d, with the San José genotype being the earliest and ‘Blanca dulce de Jercó’ the latest. Studies conducted in Colombia by Montes et al. (2018) showed quinoa cycles ranging from 154 to 213 d at temperatures between 7 and 12.5°C. Overall, all genotypes showed earliness, attributed to their sensitivity to climatic conditions (Bertero and Ruíz, 2008; Anchico-Jojoa et al., 2021). Some studies mention that quinoa adapts to a wide range of environments through considerable phenological plasticity, which is determined by environmental conditions (García-Parra et al., 2020).
Agronomic components
The analysis of variance for agronomic components showed statistical differences for most of the evaluated variables (Tab. 2). The Tukey's mean comparison test (P≤0.05) allowed for grouping between three and seven groups depending on the evaluated variable (Tab. 2). For plant height, the San José genotype was the smallest, classified as having a low height according to the scale proposed by Sañudo et al. (2005), where plants over 2 m in height are considered tall, 2.0-1.5 m as medium, and less than 1.5 m as low stature. Taking this into account, 80% of the evaluated quinoa genotypes are considered low stature, which is consistent with the results obtained by Anchico et al. (2020). Similarly, the studies by López et al. (2008) show similar results for ‘Blanca dulce de Jericó’ (155.70 cm), ‘Piartal’ (123.45 cm), and ‘Tunkahuan’ (116.55 cm). However, in other studies conducted in Brazil by Spehar et al. (2011) for the BRS Syetetuba genotypes, average heights of 1.8 m were obtained, classifying them as medium stature.
Table 2. Agronomic components: plant height (PH), panicle length (PL), panicle perimeter (PP), grain yield (GY), dry matter yield (DM), weight of 1,000 grains (WTH), and harvest index (HI), of 10 quinoa genotypes intercropped with coffee in the zoca stage.
| Genotypes | PH (cm) | PL (cm) | PP (cm) | GY (kg ha-1) | DM (kg ha-1) | WTH (g 1,000) | HI (%) |
|---|---|---|---|---|---|---|---|
| San José | 102.3 a | 25.8 a | 23.3 ab | 1120.0 a | 4195.0 a | 2.0 a | 27.0 ab |
| Blanca dulce | 159.8 d | 30.4 ab | 23.2 ab | 1475.0 ab | 8050.0 ab | 2.3 ab | 18.5 a |
| Aurora | 123.9 abc | 29.0 ab | 24.4 b | 1545.0 ab | 5910.0 ab | 2.5 bc | 26.3 ab |
| BCX 1 | 118.9 ab | 29.1 ab | 20.9 ab | 1620.0 ab | 5520.0 a | 2.6 bcd | 28.9 ab |
| Tunkahuan | 137.5 bcd | 26.0 a | 19.3 ab | 2100.0 ab | 8255.0 ab | 2.8 cd | 25.6 ab |
| BCX4 | 146.1 cd | 33.9 ab | 23.3 ab | 2490.0 ab | 8325.0 ab | 2.9 d | 30.1 ab |
| BCX2 | 147.6 d | 29.5 ab | 20.1 ab | 2585.0 ab | 9090.0 ab | 2.7 cd | 28.4 ab |
| BCX5 | 151.5 d | 25.0 a | 17.6 a | 2800.0 b | 8585.0 ab | 2.7 cd | 32.3 b |
| Piartal | 146.9 cd | 38.3 b | 24.6 b | 2885.0 b | 10905.0 b | 2.8 cd | 29.1 ab |
| BCX6 | 149.2 d | 31.3 ab | 19.2 ab | 2900.0 b | 9160.0 ab | 2.9 d | 31,0 ab |
| Mean | 138.37 | 29.83 | 21.59 | 2152.00 | 7799.50 | 2.62 | 27.96 |
| CV (%) | 6.2 | 4.3 | 5.2 | 6.5 | 7.2 | 2.1 | 6.3 |
| F | 13.41* | 3.93* | 3.64* | 4.32* | 3.72* | 13.87* | 2.08* |
Means followed by the same letters do not differ significantly according to the Tukey test (P≤0.05). *Significant differences at a 5% probability level. CV (%): coefficient of variation.
Regarding the length and perimeter of the panicle, important characteristics for determining grain yield (Bazile et al., 2014), values between 25.05 and 38.05 cm and between 17.63 and 24.63 cm, respectively, were reached. The analysis of variance detected statistical differences, where the longest panicle length was found in the ‘Piartal’ with 38.35 cm, similar results to those obtained by Anchico et al. (2020) and López et al. (2008) for the same material. On the other hand, the BCX5 and San José genotypes showed a shorter panicle length with 25.05 and 25.78 cm, respectively.
Significant differences were detected among the genotypes in terms of grain yield. This characteristic is highly influenced by the environment (Bertero et al., 2004). In this sense, the genotype-environment interaction (G×E) can determine crop yield and its characteristics, suggesting the importance of considering this factor for genotype selection (Bertero et al., 2004). In this research, the best yields were obtained with ‘BCX5’, ‘BCX6’ and ‘Piartal’, while the lowest yield was obtained with ‘San José’ (Tab. 2). Studies conducted by Delgado et al. (2009) showed that the ‘Tunkahuan’, ‘Blanca dulce de Jericó’, and ‘Piartal’ obtained similar grain yields of 1,901, 2,090, and 2,360 kg ha-1, respectively.
For the variable dry mass yield, the genotypes Piartal and BCX6 showed the highest values with 10,905 and 9,160 kg ha-1, respectively. This provides options for various uses of crop residues in integrated coffee systems.
The weight of 1,000 grains (WTH) was calculated, ranging from 2.0 to 2.9 g, where genotypes BCX6 and BCX4 showed the highest values at 2.9 g (Tab. 2). SESAN (2013) indicates that the WTH in quinoa varies between 1.93 and 3.35 g, with an average of 2.30 g. The selected progenies of Syetetuba according to Spehar et al. (2011) range from 2.5 to 3.3 g, coinciding with the results of this research. For the genotypes Piartal and Tunkahuan, values of 2.8 g were found, which coincide with the range reported by Veloza et al. (2016) and López et al. (2008).
Regarding the harvest index (HI) variable, values ranging from 18.5 to 31.0% were obtained, with the genotypes Blanca dulce de Jericó and BCX6 showing the minimum and maximum percentages, respectively. Similarly, BCX1, BCX2, BCX4, BCX5, and BCX6 had HI values above 28.9% (Tab. 2), consistent with the results reported by Spehar et al. ( 2011) and Anchico et al. (2020).
Correlation analysis was performed for all the traits, where plant height and dry matter yield showed a significant correlation (r=0.787) (Tab. 3), indicating that greater plant height corresponds to higher dry matter yield. Bhargava (2007) reported similar findings, suggesting that indirect selection processes could be effective for these traits in quinoa.
Table 3. Pearson correlation of agronomic components: plant height (PH), panicle length (PL), panicle perimeter (PP), grain yield (GY), dry matter yield (DM), weight of 1,000 grains (WTH), and harvest index (HI) of 10 quinoa genotypes intercropped with coffee in the zoca stage.
| Variable | PH | PL | PP | GY | DM | WTH | HI |
|---|---|---|---|---|---|---|---|
| HP | 1 | 0.461** | 0.025 | 0.586** | 0.787** | 0.470** | -0.125 |
| PL | 1 | 0.652** | 0.379* | 0.666** | 0.336* | -0.152 | |
| PP | 1 | -0.057 | 0.241 | -0.259 | -0.321* | ||
| GY | 1 | 0.713** | 0.673** | 0.623** | |||
| DM | 1 | 0.548** | -0.066 | ||||
| WTH | 1 | 0.381* | |||||
| HI | 1 |
* significant correlation P≤0.05. ** significant correlation P≤0.01.
A significant correlation was also found between dry mass yield and grain yield (r=0.713), facilitating the selection process, which can be oriented towards either of the two traits. Furthermore, considering the use of dry matter for animal feed and the production of various products (Bazile et al., 2014), the selection processes of quinoa can be directed towards dual-purpose characteristics. Additionally, a close relationship was found between the weight of a weight of 1,000 grains and grain yield (r=0.673), suggesting that future projects can focus on grain size to potentially achieve higher yields in intercropping designs. Regarding the harvest index, a significant correlation was identified with grain yield (r=0.623), with the genotype BCX6 presenting the highest percentage, which can be used for future intercropping with coffee.
In the evaluation of coffee in the intercropping system with quinoa, it was observed that there were no significant differences when compared to the coffee monoculture system (P≤0.05) (Tab. 4). Therefore, no influence of quinoa on coffee development in the bean stage was evidenced.
Table 4. Analysis of variance for the following characteristics: plant height, number of leaves per branch, and number of branches per plant, for coffee cultivation intercropped with quinoa and in monoculture at the bean stage.
| Variable | Plant height | Number of leaves per branch | Number of branches per plant |
|---|---|---|---|
| F value | 1.98 | 0.53 | 1.25 |
| P value | 0.118ns | 0.748ns | 0.316ns |
ns not significant according to the F test (P≤0.05).
CONCLUSIONS
The intercropping of quinoa with coffee cultivation emerges as a viable option that can enhance food security and sovereignty for small and medium-scale farmers.
The BCX6 with 2,900 kg ha-1 and Piartal with 2,883 kg ha-1 genotypes are promising for intercropping designs with coffee plantation renovation, zoca stage.
There was a significant contribution of dry biomass from quinoa cultivation to the coffee system, ranging from 4,195 to 10,905 kg ha-1. This represents a significant value in terms of coverage and organic residue input.
The evaluated genotypes showed considerable genetic variability, which allows for focused selection processes aimed at obtaining desirable characteristics for the production of quinoa intercropped with coffee.

