


 English (pdf)
 Article in xml format
 Article references
 Send this article by e-mail
 Cited by SciELO
  Cited by Google
  Similars in
SciELO
Similars in
SciELO  Similars in Google
 Permalink
Prologue
(Gutierrez, Schraw, Kuch, and Richmond, 2016) published an article that provided evidence that two distinct types of mental processes were used in the process of metacognitive monitoring. They found that the best fitting structure of latent variables contained, at the second level, processes involved with general accuracy and separate processes involved with general error. These second level processes were in turn subsumed by a third level process they called “general monitoring.” These findings were significant in that the preponderance of research in metacognition focused on increasing accuracy whereas these findings support the idea that reducing inaccuracy or error is also important. Thus, they provided empirical evidence for the existence of two latent dimensions, one corresponding to accuracy and one corresponding to error, a conclusion that was conjecture in previous work on metacognitive monitoring.
In addition, the best-fitting model also supported the idea that learners begin their metacognitive journey using an arsenal of domain-specific strategies. As they encounter new learning domains, they continue to develop domain-specific strategies which become part of their repertoire. At some point, a few of the strategies may be found to be useful in domains other than the one in which they were first employed, thus creating a set of strategies useful in more than one domain (i.e., domain-general strategies).
In the present study, we replicated the experiment of (Gutierrez et al., 2016). In addition, we further advanced the idea of two latent metacognitive factors by conducting an experiment which predicted differences due to the existence of the two latent factors. We did this by examining the relationship between time to judge test items and an individual’s metacognitive monitoring.
Introducción
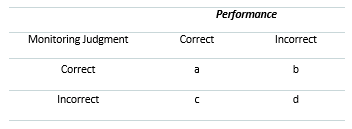
A 2 x 2 matrix such as that shown in Table 1 is frequently used in metacognitive monitoring to record the relationship of correct and incorrect performance versus correct and incorrect judgment (Boekaerts & Rozendaal, 2010; Efklides, 2008; Gutierrez et al, 2016; Winne & Nesbit, 2009). Of note, cell b reflects incorrect performance that is judged to be correct. These outcomes have been characterized as overconfidence (Koriat, 2012; Pieschl, 2009; Stankov, 2000; Stankov & Crawford, 1996). Cell c reflects correct performance that is judged as incorrect. These outcomes have been characterized as underconfidence (Dinsmore & Parkinson, 2013).
We will refer to the contents of cell b and cell c as overconfidence and underconfidence, respectively. The reader may find additional detail about these and other fundamental metacognitive concepts in the original study (see Gutierrez et al., 2016, for more detailed information).
A Confirmatory Test of Five Models
Both the original and the present study examined the domain-specific and domain-general monitoring hypotheses by comparing five different structural models using a hierarchical confirmatory factor analysis (CFA) framework. The non-hypothesized portion of the model consisted of three multiple choice tests of 15 items each covering Vocabulary, Probability, and Paper Folding.
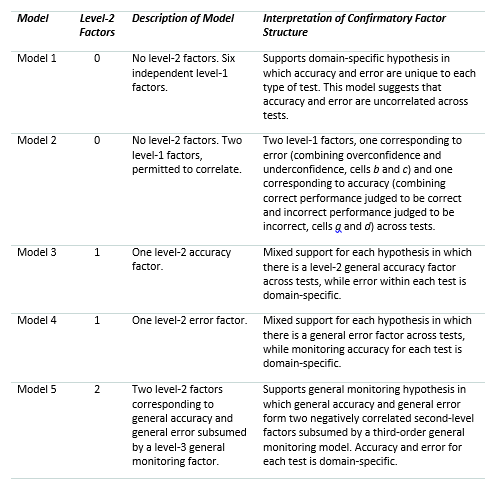
The five models are based on the 12 manifest variables produced by scores from the performance-judgment array in Table 1 (cells a - d) for each of the three tests (Vocabulary (V), Probability (S), and Folding (F)). These variables comprise Level-0. Level-1 corresponds to latent variables derived from the 12 manifest variables and implies the presence of domain-specific monitoring. Level-2, if present, corresponds to latent variables derived from level-1. Level-2 factors run across domains and can be thought to be reflective of domain-general monitoring. Level-3, which only appears in Model 5, corresponds to latent variables derived from level-2 and reflects a general, overall monitoring factor.
Table 2 summarizes the five models tested and includes the predictions each model makes about the role of accuracy and error factors as well as the relation of domain specificity and domain generality.
The Present Study
Our first objective was to cross-validate the findings of (Gutierrez et al., 2016). The original study of (Gutierrez et al., 2016) examined the domain-specific and domain-general monitoring hypotheses by comparing the five different theoretically-driven models using a three-level hierarchical confirmatory factor analysis (CFA) framework. In line with their prediction, we expected Model 5 (see Figure 1), the general monitoring model, to yield a statistically significantly better fit to data than the other four models, as it did in the original study.
Based on implications of the proposed two-factor monitoring model, our second objective was to validate these findings by conducting an experiment in which error and accuracy are treated as separate latent dimensions. We did this by investigating the relationship between time to judge test items (i.e., develop metacognitive judgments) and an individual’s metacognitive monitoring within and across the three domains-V, S and F. More specifically, time in developing judgments in each cell of Table 1 was collected for all participants in each of the three domains. Hence, we were able to use time to judge performance in each cell (i.e., a, b, c, and d) as predictors of raw frequencies within each of the four cells. This provides a fine-grain analysis of the role of time to judge performance within each cell in predicting raw frequencies within each cell. Thus, we used processes within (Gutierrez et al., 2016) model to explore time influences on how monitoring operates. Previous research (e.g., Gutierrez & Price, 2017; Kolić-Vehovec et al., 2010; Lundeberg & Mohan, 2009) showed that gender influences metacognitive monitoring, especially underconfidence and overconfidence. More specifically, females tend to be underconfident in their performance whereas males tend to be overconfident. We, therefore, used gender as a covariate in the analyses related to this research.
Because very little previous research has provided guidance with respect to the relations between time to judge test items and metacognitive monitoring processes, we opted to avoid developing specific hypotheses regarding these relations and instead allowed the observed data to reveal patterns of relations among the monitoring accuracy and error components initially uncovered by (Gutierrez et al., 2016) and further supported by our data. Nevertheless, we expected that individuals who spent more time to judge their item-by-item performance should exhibit increased accuracy in their metacognitive monitoring relative to those who spent less time, due to additional time to reflect and more deeply contemplate what they know/do not know about the topics the test items are assessing.
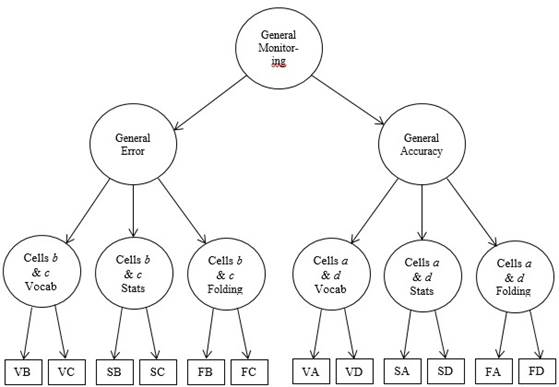
Figure 1 Model 5: The general monitoring model. The first letter in the rectangles representing the manifest variables indicate the domain-V = vocabulary, S = probabilities/statistics, and F = paper folding-and the second letter represents each cell in the 2 x 2 matrix-cell a (correct performance judged to be correct), cell b (incorrect performance judged to be correct), cell c (correct performance judged to be incorrect) and cell d (incorrect performance judged to be incorrect).
Method
Participants
Participants in the present study included 174 U.S. college undergraduates from introductory psychology classes. Four participants withdrew from the experiment after completing only the first few items and were excluded. The remaining 170 (102 female, 68 male) participants completed the entire experiment. Participants received one-hour research credit for their participation and were 18 years of age or older.
Materials
Performance and confidence judgments
Three 15-item multiple-choice tests were used that assessed vocabulary knowledge, probability estimation, and mental paper-folding ability. The tests were selected based on the Radex model (Marshalek et al., 1983), which suggests that vocabulary knowledge assesses a crystalized ability, while paper folding and basic mathematical computations assess fluid abilities. The three test scores were expected to be correlated no higher than .30, suggesting they assess separate cognitive abilities.
The Appendix provides an example of each type of item. The vocabulary and probabilities test items each included four plausible options, only one of which was correct. The paper folding test items included five plausible options, only one of which was correct. The test items were identical to those used by (Gutierrez et al., 2016) in the original study. They had developed the vocabulary and probabilities tests in their own previous research, whereas the paper folding items were taken from (Ekstrom, French, and Harman, 1976). The means and standard deviations for the vocabulary, probabilities, and paper folding tests were 10.77 and 2.13, 12.67 and 1.82, and 12.84 and 2.10 respectively, which corresponded to 60%, 64%, and 64% correct responses for the three tests. For the present sample of 170 participants, the Cronbach’s coefficients by test were as follows: vocabulary α = .71; probabilities α = .78; and paper folding α = .84.
Procedures
The three 15-item multiple-choice tests of performance were delivered online in a designated computer lab in which a researcher was present at all times. Participants worked alone on the computer and were not allowed to use scratch paper or calculators. General instructions were presented first, followed by brief instructions for each of the three tests immediately before the test began.
Within the 15-item test block for each test, only one item and its possible solutions appeared on the screen per each mouse click. Directly beneath each response, the participants indicated whether they judged the response to be correct (i.e., yes or no). Each of the 15 scores on each test was assigned to one of the four cells in Table 1. Individuals were given up to 70 seconds to select their response for each item to assure that each participant had approximately the same amount of time to answer test items. No individual responses were lost because of the time constraint.
Data Analysis
Data collected from the 170 research participants were evaluated for univariate normality using skewness and kurtosis values and histograms with normal curve overlay (Tabachnick & Fidell, 2013) as well as multivariate normality using Mardia’s Normalized Estimate (Bentler, 2005). All 12 variables, including 4 cells (a, b, c, and d) x 3 tests (vocabulary, probability, and paper folding) approximated univariate normality (all skew and kurtosis values were less than the absolute value of 1). Data were also screened for univariate outliers using box-and-whisker plots. No cases were deemed outliers; thus, all 170 cases were retained for analysis. Nevertheless, data demonstrated slight multivariate kurtosis, and thus, maximum likelihood robust (MLR) statistics were requested in lieu of the normal distribution statistics. MLR procedures provide adjusted fit indices (e.g., S-B χ2, *CFI, *NNFI, *IFI, and *RMSEA and its *CI90%) that correct for moderate-to-severe violations of multivariate normality. Additionally, MLR procedures adjust/correct standard errors and the statistical significance of the unstandardized factor loadings, considering multivariate non-normality (Kline, 2005).
Other assumptions such as homoscedasticity (i.e., box plots and scatterplots suggested a homoscedastic distribution among variables) were met. No multicollinearity was found in the data using multicollinearity and singularity testing procedures requested via the regression syntax command for collinearity diagnostics.
We began by specifying CFA model parameters for each of the five models summarized in Table 2 using EQS 6.3 (Bentler, 2005). All higher-order models were specified following standard procedures; that is, the fit of the first -order factors was evaluated prior to testing the second-order. This approach significantly obviates the likelihood of model misspecification, as level-1 and higher-order structures are evaluated separately. The models were compared using the Satorra-Bentler scaled chi-square difference test (S-B Δχ2) for overall best fit to the observed data. Because MLR statistics correct for multivariate non-normality, comparing the models using a non-scaled, normal distribution Δχ2 is inappropriate (Satorra, 2000). Presumably, the model with the highest fit indices and lowest residuals would be a statistically significant improvement over all other models. We accounted for auto-correlation in the data by correlating the residuals of relevant manifest and latent variables, as recommended by (Kline, 2005) for data that are dependent, and thus, taking into consideration within-person shared variance of cells a-d of Table 1.
Goodness-of-fit indices (*NNFI, *CFI, *IFI) ≥ .90 suggest an adequately fitting model, and those ≥ .95 suggest excellent fit of the model to observed data. With respect to residuals, standardized root mean square residual (SRMR) values ≤ .08 suggest reasonable errors in estimating model parameters and root mean square error of approximation (*RMSEA) values ≤ .08 suggest that the model parameters approximate those of the population adequately, and those < .05 suggest good fit to the data (Byrne, 2006; Kline, 2005). Dillon-Goldstein’s rho (ρ) was also used to assess the overall or composite reliability of the model. Rho measures how well the manifest/indicator variables, as a block, represent the latent variable in which they are hypothesized to load. Like the interpretation of Cronbach’s alpha, higher values for rho indicate greater model reliability, with .70 serving as the lower-bound for adequate model reliability (Werts, Linn, & Jöreskog, 1974).
Results
Replication of the General Monitoring Hypothesis of (Gutierrez et al., 2016)
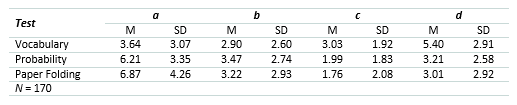
Table 3 contains the descriptive statistics of the raw frequencies in Table 1 for each type of test in the present study.
Table 3 Means and Standard Deviations of the Cells in the 2x2 Matrix for Vocabulary, Probability, and Paper Folding Tests.
As in the original study, results showed that Model 1, in which error and accuracy are unique to each test, and each of these factors were allowed to correlate, was the poorest fitting model to the observed data and had the most degraded fit indices and highest residuals. Factor correlations between the latent variables (overconfidence factor, underconfidence factor as well as domain-specific accuracy factors associated with cells a and d - that is, accuracy for vocabulary, probabilities, and paper folding tests, respectively) for Model 1 ranged from r = .25 to r = -.47. The highest correlation (r = -.47) was between the overconfidence and underconfidence factors.
Model 2, with two level-1 factors - one comprised of overconfidence and underconfidence (cells b and c) and the other comprised of accuracy (cells a and d) across the three tests - yielded better fit indices than Models 1, 3, and 4. The inter-factor correlation coefficient between the error and accuracy factors was moderate and negative (r = -.61).
Model 3, with general accuracy at level-2 but domain-specific error within tests, and Model 4, with general error at level-2 but domain-specific factors within tests at level-1, demonstrated nearly identical fit to the data, although Model 4 exhibited slightly lower residuals. Like Model 1, both Models 3 and 4 demonstrated relatively poor fit to the data, even though both exhibited higher fit indices and lower residuals than Model 1.
Model 5 - with two level-2 factors corresponding to general accuracy and general error across tests and a general monitoring factor at level-3 - resulted in very good fit to the observed data, with fit indices ≥ .95 and low residual statistics, which were both within acceptable range.
Comparing the five models, Model 5 provided the closest approximation to the observed data and population estimates of parameters. With respect to model reliability, rho coefficient comparisons suggested that Model 5 was high and within acceptable range and the most reliable, with Models 1, 2, 3, and 4 demonstrating various degrees of unreliability. Although the model reliability of Model 2 was approaching adequate reliability (ρ = .69), the proposed Model 5 (see Table 4) exhibited significantly superior model reliability (ρ = .91). This indicates that the factor structure specified in Model 5 most adequately represents the variances and covariances in the observed data. Models 1, 2, 3, and 4, on the other hand, exhibited degraded reliability because the models were mis-specified relative to the observed data. Overall, the parameters of Model 5 most reliably represented the latent factor structure of metacognitive monitoring based on the data. This supports the finding of (Gutierrez et al., 2016), and thus, provides a cross-validation of their general monitoring model.
Table 4 Model Fit Statistics of Nested Models.
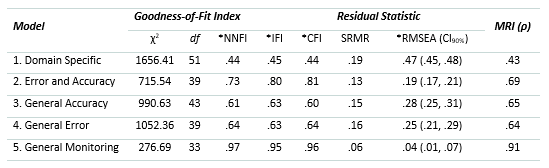
N = 170
Note. Asterisks (*) indicate that the statistics are adjusted for multivariate non-normality. NNFI = Non-normed fit index; IFI = Incremental fit index; CFI = Comparative fit index; SRMR = Standardized root mean square residual; RSMEA = Root mean square error of approximation and its 90% confidence interval (CI90%); MRI = Model reliability index.
All Model 5 parameters for the level-1 factors were within range and statistically significant. Statistically significant factor loadings ranged from .50 to -1.00. At the second-order level, the factor loadings associated with cells a and d, which represent accuracy for each of the three tests, respectively, and cells b and c, which represent error for each of the three tests, respectively, were all statistically significant and ranged from .42 to 1.00. The factor loadings associated with the third-order general monitoring factor were 1.00 and -.98 for general error and general accuracy, respectively. Overall, Model 5 showed low residuals and excellent fit indices. Table 5 presents the correction of the scaling, the difference in degrees of freedom between the five models compared, and the results of the S-B scaled Δχ2 tests. Findings show that Models 2, 3, 4, and 5 are a significantly better fit to the data than Model 1. In addition, Model 5 provided a statistically significant improvement when compared to Models 2, 3, and 4.
Table 5 Satorra-Bentler Scaled χ2 Difference Test Results Between Nested Models.
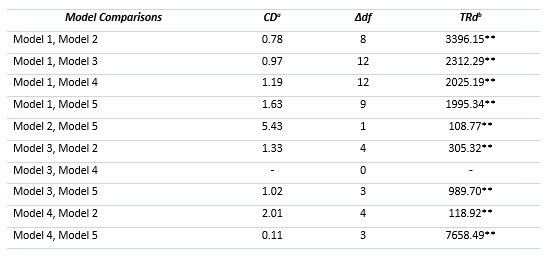
Note. In all model comparisons, the model on the left is the comparison model and the model on the right is the alternative model. General accuracy and general error cannot be compared because they have no difference in degrees of freedom.
a Difference in test scaling correction
b S-B scaled Δχ2 test statistic (T; TRd represents the mathematical equation used to calculate T)
** S-B scaled Δχ2 test is significant at p < .001
Figure 2 shows the final parameter estimates of Model 5, which provided an excellent fit when considered separately (i.e., excellent goodness of fit, low residuals, model reliability), and a statistically better fit compared to Models 1, 2, 3, and 4. Factor loadings at the zero-order level consistently showed that, albeit related, cells a and d in the general accuracy factor and cells b and c in the general error factor are inversely correlated. This provides additional empirical evidence that overconfidence and underconfidence (i.e., error) and correct judgments judged to be correct and incorrect judgments judged to be incorrect (i.e., accuracy) involve different metacognitive processes. While this pattern was not as conclusive in (Gutierrez et al., 2016) sample based on the evidence they provided, it was consistent in our sample of college undergraduates. This has important implications for metacognitive monitoring research. Moreover, at the second-order, general accuracy and general error are inversely correlated, as theoretically expected, and in agreement with the original study. Further, as with the original study, we did not conduct a multi-group higher-order CFA to examine gender differences in this replication portion of the present study to maintain consistency with the original (Gutierrez et al., 2016) study.
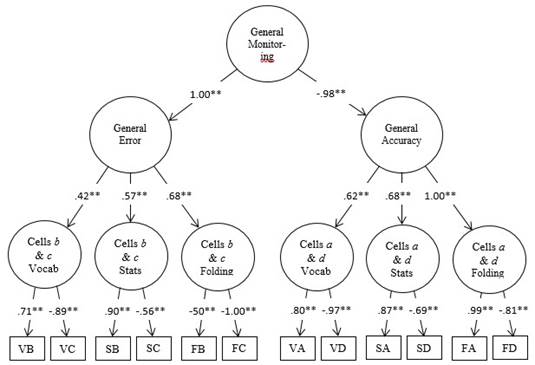
Figure 2 Proposed third-order CFA model of the 2 x 2 matrix of raw frequencies for vocabulary, probability, and paper-folding tests. The cells b & c and the cells a & d factors represent domain-specific error and accuracy judgments respectively. The first letter in each of the manifest variables represents the name of the test and the second letter represents the specific cell in the 2 x 2 matrix.
Summary of Findings of Cross-Validation of (Gutierrez et al., 2016)
Our replication of (Gutierrez et al., 2016) study confirmed their findings. Not only did the findings of our sample of undergraduate students mirror their results with respect to the fit indices of the five proposed models (with slight variations), but the general monitoring model (Model 5) was the best fitting model to our observed data as well. Further, congruent with their Δχ2 comparisons, the general monitoring model showed superior fit to our observed data when compared to the four alternative models. This provides additional evidence for (Gutierrez et al., 2016) hypothesis that metacognitive monitoring is a process that is influenced by both domain-specific and domain-general processes, as opposed to either one or the other alone. Nevertheless, as in the original study, our replication revealed that a third-order general monitoring factor subsumes lower-order general accuracy and general error factors and even lower-order encapsulated error and accuracy factors within tasks. Yet, an important distinction between our findings and those of Gutierrez and colleagues is that, unlike results of their sample of undergraduates, we found consistent inverse relations in both sectors of accuracy and error. More specifically, we found a consistent pattern in our sample in which overconfidence (cell b) and underconfidence (cell c) within general error, and correct performance judged to be correct and incorrect performance judged to be incorrect within general accuracy, were inversely related latent processes. This may indicate that learners indeed engage in distinct cognitive processes when not only forming accurate and erroneous judgments but when forming even finer-grained judgments within each of those latent dimensions.
A Further Extension: The Role of Time in Forming Metacognitive Judgments
The findings from both studies point to the existence of separate mental metacognitive processes involved in metacognitive error and metacognitive accuracy. Given this new framework, and to extend the findings of (Gutierrez et al., 2016), we created an experiment in which error and accuracy are treated as separate latent dimensions. We examined the relation between the time it takes a subject to judge their response to a test item and the subject’s metacognitive monitoring, while controlling for the effect of gender (male, female). For the gender variable, the “female” group served as the reference group because we dummy coded this group as “0” and males as “1”. The subject data (N=170) used in this study also captured the time it took for a subject to respond to a test item and judge the correctness of his or her response. We then used that duration to examine its relationship to metacognitive outcomes reflected in cells a, b, c, and d. We examined this relationship for all three tests (vocabulary, statistics, and paper folding) used in this study.
Data Analysis
We conducted a series of hierarchical linear regressions. The Bonferroni adjustment to statistical significance was used to control for the familywise Type I error rate inflation. Moreover, data were tested for requisite statistical assumptions including univariate normality via skew and kurtosis values and screened for outliers using box-and-whisper plots. Results of data screening revealed moderate kurtosis in the following variables: time to make judgments for vocabulary a, b, and d cells; time to make judgments in the statistics and paper folding a cells; and the raw frequencies of vocabulary b cell. An outlier analysis on these variables indicated 12 extreme outliers. We proceeded by eliminating one outlier at a time and re-evaluating normality and to test if additional outliers were uncovered. After elimination of the 12 outliers, all variables approximated a normal distribution, with skew and kurtosis values less than the absolute value of 1. Further, no additional outliers were detected. Other requisite assumptions (e.g., homoscedasticity, linearity, and lack of collinearity in the data) were also met, and hence, data analysis for this research objective proceeded with 158 cases.
In all hierarchical regressions, gender was entered at Block 1; time to form metacognitive judgments for the accuracy cells - a and d - were entered in Block 2; and the time to form judgments for overconfidence (cell b) and underconfidence (cell c) were entered in Block 3. The raw frequencies within each cell (a, b, c, and d) by test (vocabulary, statistics, and paper folding) served as the criterion in each analysis respectively. The effect size for the regression analyses was reported as R2. (Cohen, 1988) specified the following interpretive guidelines for R2: .010-.299 as small; .300-.499 as medium; and ≥ .500 as large.
Table 6 Hierarchical Linear Regression Results of Time to Form Judgments by Cell (a, b, c, and d) as Predictors of Raw Frequencies in each Cell by Test Domain (Vocabulary, Statistics, and Paper Folding).
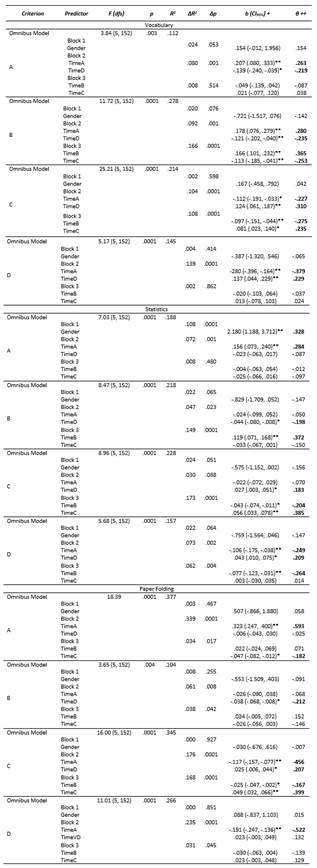
N = 158 * p < .05 ** p < .01
Note. For the gender variable, the “Female” group served as the reference category in the dummy coding scheme. ΔR 2 = The change in R 2 for each individual block of variables (i.e., incremental variance of each block). Δp = The statistical significance of the change in R 2 of each individual block of variables (i.e., statistical significance of incremental variance).
+ Unstandardized regression coefficient and its 95% confidence interval.
++ Standardized regression coefficient. All statistically significant standardized coefficients are highlighted in bold
These analyses reveal two important findings. First, there were distinct predictive patterns uncovered across the three domains we tested, although some patterns were similar.
In Table 6, in the vocabulary domain, there were several findings of note:
Only Time to Judge cell a (TimeA) and Time to Judge cell d (TimeD) were significant predictors of the raw frequencies in cell a. Furthermore, TimeA was a positive predictor while TimeD was a negative predictor.
Interestingly, Time to Judge cell a (TimeA) and Time to Judge cell d (TimeD) significantly predicted the raw frequencies of cells b (overconfidence) and c (underconfidence). However, the reverse pattern was not true: TimeB and TimeC did not predict the raw frequencies of cells a and d.
In the cell b criterion block, Time to Judge cell a (TimeA) was a positive predictor. In the cell c (underconfidence) criterion block, TimeA was a negative predictor. The reverse pattern was true for TimeD which was a negative predictor of cell b (overconfidence) and a positive predictor of cell c (underconfidence). Neither TimeB nor TimeC were predictors of the raw frequencies in cell a or d.
One conclusion from these findings is that students use correct judgments to guide their activities when remedying incorrect judgments, but incorrect metacognitive judgments are not used to replace accurate ones.
In the statistics domain, there were also several findings of note:
Regarding raw frequencies in the statistics domain, findings showed that gender was a significant positive predictor, such that males had more frequencies in cell a than females
Unlike raw frequencies in the vocabulary domain, only Time to Judge cell a (TimeA) in the statistics domain significantly positively predicted raw frequencies in cell a. Again, even within accuracy, cells a and d were inversely related in the statistics domain as were cell b (overconfidence) and cell c (underconfidence) within error.
In the raw frequencies in cell b (overconfidence), only Time to Judge overconfidence (TimeB) was a significant positive predictor whereas only Time to Judge cell d (TimeD) was a significant negative predictor. A similar predictive pattern was evident for the raw frequencies of cell c (underconfidence) in the statistics domain, albeit Time to Judge cell b (TimeB) was a significant negative predictor and Time to Judge cell c (TimeC) was a significant positive predictor.
In the raw frequencies in cell d, Time to Judge cell a (TimeA) (negatively), Time to Judge cell d TimeD (positively), and Time to Judge cell b (negatively) were significant predictors within the statistics domain.
Even though some of the predictive patterns were similar across vocabulary and statistics domains, unique patterns emerged for both. In the case of the statistics domain, TimeD appears to have a complex relation with the error cells b and c, as it negatively predicted cell b frequencies and positively predicted cell c frequencies. The same was not the case for TimeA. Another interesting pattern is that only TimeA significantly positively predicted cell a frequencies whereas TimeA (negatively), TimeD (positively), and TimeB (negatively) significantly predicted cell d frequencies, again pointing to the complex dynamic between cells b and d within this domain. Thus, whereas the relation between accuracy and error were clearer in the vocabulary test, it was more complex in the statistics test.
In the paper folding domain, there were several findings of note:
In the raw frequencies in cell a, only Time to Judge cell a (positively) and Time to Judge cell c (negatively) were significant predictors.
As to raw frequencies in cell b, only Time to Judge cell d (negatively) was a significant predictor whereas neither Time to Judge cell b (TimeB) nor Time to Judge cell c (TimeC) - both representative of metacognitive error - were significant predictors.
The patterns shift drastically for the raw frequencies of cell c in which Time to Judge all four cells - a (negatively) and d (positively), as representing metacognitive accuracy; and b (negatively) and c (positively), as representing metacognitive error - were significant predictors.
Finally, with respect to raw frequencies in cell d, only Time to Judge cell a (TimeA) was a significant predictor (negative) whereas neither Time to Judge cell d (TimeD) nor Time to Judge the two error cells (cells b and c) were significant predictors.
Again, as in the statistics domain, the paper folding domain exhibits a more complex relation between accuracy and error, except in a different pattern. Whereas cell b and cell d shared a unique relation in the statistics domain, cell a and cell c do the same in the paper folding domain. Interestingly, only TimeD predicted cell b frequencies while TimeB and TimeC did not. As to cell c frequencies, Time to Judge all cells (TimeA, TimeB, TimeC, and TimeD) were significant predictors. Finally, only TimeA significantly predicted raw frequencies of cell d, whereas as the others did not. This is noteworthy because, albeit an aspect of accuracy, only its counterpart, TimeA, predicted cell d frequencies whereas TimeD did not.
In summary for our first important finding, it appears that only the vocabulary domain showed clear-cut patterns between accuracy and error whereas the statistics and paper folding domains demonstrated more complex patterns of relations between the two aspects of metacognitive monitoring.
Second, and of special importance for the framework proposed by (Gutierrez et al., 2016), there were also distinct predictive patterns among the frequencies of the accuracy cells - a and d - and the error cells - cell b (overconfidence) and cell c (underconfidence) and underconfidence across the three domains we evaluated. This further supports the mixed findings of the domain-general versus domain-specific argument in metacognitive monitoring and it provides additional support for the conclusion that metacognitive general accuracy and general error are not only distinct at a broader level but also on a finer grain within general accuracy and within general error, as both cell a (correct performance judged to be correct) and cell d (incorrect performance judged to be incorrect) are inversely related and behave differently as a function of domain. The same pattern is true for cell b (overconfidence, or incorrect performance judged to be correct) and cell c (underconfidence, or correct performance judged to be incorrect). Thus, metacognitive accuracy and error within and across themselves exhibit dynamic, complex relations, at least in the three domains in which we investigated these phenomena.
Discussion
(Gutierrez et al. original study, 2016) evaluated five competing theoretical models with respect to the domain-specific versus domain-general monitoring hypotheses. They compared the 12 raw scores (i.e., cells a - d x type of test) to assess the goodness-of-fit of the five explanatory models. In the present study, the hypothesized Model 5 was the best fitting model when compared to the other four models. This finding is theoretically important because both the original and the present studies examined the dimensionality of the four monitoring outcomes (e.g., accuracy [cells a and d], overconfidence [cell b] and underconfidence [cell c]) and concurrently addressed whether metacognitive monitoring utilizes higher-order domain-general processes.
As reported in the original study as well as the present study, Model 5 was the best fitting model. Model 5 shows two general factors reflecting both accuracy and error. In addition, Model 5 postulates a third-level general monitoring factor which includes both general factors of accuracy and error.
Model 5, as presented in Figure 2, does not discount the importance of domain-specific knowledge and monitoring skills. As presented in the original study, domain-specific knowledge and monitoring skills are important elements in metacognitive monitoring.
We propose that the two-factor model determined by (Gutierrez et al, 2016) and reiterated in the present study (Figure 2), represents an improvement over previous conceptual models of metacognitive monitoring. The two-factor model provides a more detailed portrayal of the structure of metacognitive processes than models previously advanced (e.g., Koriat & Levy-Sardot, 1999; Nelson & Narens, 1990; Pieschl, 2009; Veenman et al, 2006).
Model 5 also shows that domain-general processes affect metacognitive monitoring above the level of domain-specific monitoring and imply a progression from domain-specific to domain-general metacognitive skills over time.
Another finding from the original study which was also observed in the present study was that a comparison of the four individual scores within Table 1 provided a more detailed understanding of the role of underconfidence and overconfidence in monitoring as well as the relation between them. Both types of errors loaded on a single general error factor at level-2 in Model 5, a finding consistent with the view that judgments of learning utilize a general confidence factor (Boekaerts & Rozendaal, 2010; Koriat 2012; Stankov & Lee, 2008). In addition, the underconfidence and overconfidence factors correlated negatively at nearly -1.0, indicating that as one type of error increases, the other type decreases. This suggested that individuals tend to be either consistently underconfident or overconfident, a trend which has been shown to be affected by gender as well such that females tend to exhibit underconfidence whereas males tend to show overconfidence in performance (e.g., Gutierrez & Price, 2017). It is unsurprising that the general accuracy and general error factors at level-2 are inversely related, as individuals with high accuracy tend to commit fewer performance judgment errors. Thus, part of the process of developing domain-general accuracy is related to eliminating error from one’s judgments. Interestingly, while the level-1 cells b and c factor for vocabulary indicated an inverse correlation among the two manifest cells, these same cells for the probabilities and paper folding factors were positively correlated. This suggested that the types of erroneous metacognitive judgments learners make may vary by domain or task, or possibly by domains based on either crystallized or fluid intelligence. Precisely how skilled learners engage in these processes is unclear. These are important topics for future research.
As in the original study, these findings suggest that more efficient improvement in metacognitive monitoring will be achieved by producing interventions that focus on improving accuracy and reducing error, but not both concurrently.
Any lack of conclusive findings in previous work on metacognitive monitoring training (e.g., Bol et al., 2005; Bol et al., 2012; Hacker et al., 2008; Gutierrez & Schraw, 2015; Gutierrez de Blume, 2017) to improve relevant learning skills such as performance and calibration accuracy may have been the result of including strategies that were intended to both increase accuracy and decrease error. This may have diluted or undermined the effect of the intervention as a whole, as test statistics and effect sizes may have been muddled by the inclusion of diverse strategies targeted at multiple metacognitive processes.
Implications and Future Research
Future research should capitalize on the more detailed two-factor model presented in the original and present studies with emphasis on the two different metacognitive processes. The findings from both studies indicate that future interventions should focus on specific latent aspects of monitoring such as decreasing overconfidence or increasing accuracy, but not concurrently. In addition, the second experiment reported in this study highlighted the need to tailor future research and interventions not just at the level of accuracy vs. error but even more deeply - that is, targeting cell a or d as a component of accuracy, or b or c as a component of error, as they are distinct subcomponents of each.
Future research should also examine more specifically the developmental trajectory from domain-specific metacognitive monitoring skills to domain-general, as some learners may in fact exhibit different levels of fluency with domain-general skills. This begs the question, “do individuals begin by developing domain specific metacognitive monitoring skills as children and, as they mature, do they then begin to develop more domain-general monitoring skills?” If this progression is accurate, age, as an indicator of cognitive and metacognitive development, should be significantly and positively correlated with level of fluency of individuals’ domain-general metacognitive monitoring skills.
Thus, cohort studies that employ longitudinal designs could follow children ages 8-10 through young adulthood, and even beyond, to elucidate answers to this question. Studies on the development of metacognition reveal that rudimentary metacognitive skills are present as early as 5-7 years of age (Ghetti & Angelini, 2008; Krebs & Roebers, 2010; Lyons & Ghetti, 2011; Roderer & Roebers, 2010). More advanced metacognitive skills such as control and monitoring, however, begin to surface in children between 8-10 years of age (Roebers et al., 2009). For educators, this line of inquiry is utilitarian insofar as it could yield educational interventions to aid in the development of more advanced domain-general metacognitive monitoring skills among learners.
It is important to replicate both the original and present studies using different types of metacognitive judgments (e.g., feeling of knowing, judgments of learning, judgments of performance, ease of learning) to determine whether there are general accuracy and general error factors embedded within them as well. Previous research indicates that different judgment tasks are uncorrelated, suggesting they rely on distinct and possibly discrete cognitive processes (Kelemen et al., 2000; Ozuru et al., 2012). The fact that the original and present studies, using two separate samples of students from the same population, have shown that learners may invoke different cognitive processes when forming accurate versus erroneous judgments - highlights the need for further inquiries incorporating different types of judgments.
As mentioned previously, the types of erroneous metacognitive judgments learners make may vary by domain or task, by domains based on either crystallized or fluid intelligence, or, quite possibly, by a statistical interaction of gender x task type. Precisely how skilled learners engage in these processes is unclear and should be examined. One approach would be to use a broader set of cognitive abilities. For example, (Schraw and Nietfeld, 1998) used a battery of eight tests, including tests designed to assess crystalized and fluid ability (Marshalek et al., 1983), and reported a general accuracy factor. Unfortunately, they did not test for a general error factor or include a multi-level, hierarchical model in their analyses.
Limitations
While we believe that our study contributes substantively to the literature on self-regulated learning and metacognition as well as the relation between metacognitive skills (self-regulation, metacognitive knowledge and regulation, and metacognitive monitoring), it is not without limitations. Even though we used sophisticated statistical modeling techniques such as hierarchical regression and higher-order confirmatory factor analysis, our research design was correlational and predictive in nature, and thus, it prevented us from making stronger, causal claims regarding the dynamics of the phenomena under investigation. Even though we employed more objective measures such as performance and metacognitive monitoring, we also relied on self-report measures of self-regulation, metacognitive knowledge and regulation. Individuals, even adults, may not always be the best raters of their own skills and personality traits, and thus, this reliance on self-report measures may have biased our results. Participants’ metacognitive judgments were dichotomous (yes or no) in both studies while other studies have used scales of relative confidence (0 to 100%) (e.g., Dunlosky & Hertzog, 2000; Nietfeld & Schraw, 2002), which may produce more fine-grained results. Finally, some of our observed effect sizes and standardized regression coefficients were modest, and hence, findings associated with those effects should be interpreted against that backdrop.
Conclusions
(Gutierrez et al., 2016) provided evidence for the existence of general accuracy and general error factors in metacognitive monitoring. The article had been based on an experiment conducted in 2013 involving 205 subjects with analyses conducted using raw frequencies. We replicated the experiment enlisting 170 new participants from the same population. The experiment conditions were otherwise identical. The original study found level-1 domain-specific accuracy and error factors which loaded on second-order domain-general accuracy and error factors, which then loaded on a third-order general monitoring factor. These findings were repeated in the present study. The results of both studies suggest that metacognitive monitoring consists of two different types of cognitive processes: one that is associated with accurate monitoring judgments and one that is associated with error in monitoring judgments. In addition, both studies support the idea that domain-specific metacognitive skills and domain-general metacognitive skills are concurrent and valid processes being parts of general metacognitive monitoring. The two-factor model offered in both studies provides a more detailed portrayal of the structure of metacognitive processes than models previously advanced (e.g., Koriat & Levy-Sardot, 1999; Nelson & Narens, 1990; Pieschl, 2009; Veenman et al, 2006).
Given this new framework, we next devised an experiment in which error and accuracy were treated as separate latent dimensions. We found that metacognitive processes used in building correct judgments were used to remedy incorrect judgments, but not vice-versa, further supporting the existence of separate metacognitive processes for error and accuracy.

