


 Inglês (pdf)
 Artigo em XML
 Referências do artigo
 Enviar este artigo por email
 Citado por SciELO
  Citado por Google
  Similares em
SciELO
Similares em
SciELO  Similares em Google
 Permalink
INTRODUCTION
"Prediction" or "estimation" of breeding values (EBVs) is considered a very important procedure in the animal breeding and genetic improvement fields of livestock, especially when the main objective of these procedures is to arrange candidates in the herd (e.g., bulls or rams). The progeny test is a method under which the breeding values of an individual are estimated by using the mean of his offspring through half -sibs or full -sibs, or both 1. The CC method represents a significant qualitative advance in the accuracy of genetic assessments because of their ability to take into account the phenotypes which are expressed under environmental conditions 2. Unlike the other common methods, estimation of breeding values based on CC of herd mates method takes into account only one trait and also depends basically on the value of the heritability of the studied trait, but it neglects the economic value of the trait against other traits and does not allow the excellent trait to compensate for the less errant qualities trait in the animal 3. In terms of animal breeding, the method of CC has achieved great benefit, by allowing the artificial insemination centers (AI) to investigate the genetic distinction of bulls whose straws are distributed over a wide geographical area, bypassing countries and continents 4.
It well known, within the various mating systems, Holstein - Friesians have a high superiority in individual and maternal additivity for milk yield (MY) traits 5,6. In literature, many studies have examined the estimation of genetic and non-genetic parameters for daily milk yields (DMY), milk fat yield (MFY), milk protein yield (MPY), milk fat percentages (MFP), milk protein percentages (MPP) and milk lactose percentage (MLP) 7,8,9,10,11,12. The production of the Holstein -Friesian cows of milk varies from country to country and even from one place to another in the same country, according to the welfare standards and prevailing environmental conditions, for example, in Sudan, MY amount reached to 3358 kg per season 13, while in Sweden the amount reached to 6529 kg 14 and in Britain reached to 5533 kg 15.
Hence, the aim of our study was to estimate and evaluate the breeding values of traits of 305-day milk (305 -DMY), milk protein percentage (MPP), milk fat percentage (MFB) and milk lactose percentages (MLP) by using the CC method of herd mates. Also, study the genetic and phenotypic relations and genetic superiority of sires and their performance and effects on the productivity of their daughters in different Syrian dairy farms.
MATERIAL AND METHODS
Breeding plan, management and chemical analysis of milk components. The study was conducted on the imported Holstein- Friesian breed in Syria. Sires and their daughters, which are under study, were monitored and tracked by records available in eight dairy farms (409 records). The daughters (409 cows) were chosen as a result of the artificial insemination of ten sires (parent stock) according to the term of half-sibs' relation and divided into eight herds according to their distribution across the farms as shown in the following table (Table 1):
The sires were renumbered and encoded with symbols A, B, C, D, E, F, G, H, I and J. The eight dairy farms were also re-encoded according to numbers 1 to 8. According to the veterinary medical reports, all the studied and selected cows were in good health and most of them completed their first productive season (parity) and were at about the same age (±6 month). The cows were kept under different environmental conditions on the farm. Daily cow's rations were balanced according to the Institute National of Research Agronomy feeding system (INRA). All cows were milked twice a day. The amount of milk has been adjusted to 305 days for cows that have not completed their parity according to Van Vleck and Henderson 16. Milk samples were collected and analyzed in the third, fifth and ninth months of the parity for each daughter cow. Combined milk from morning and evening milking was placed in a small sterile bottle (100 ml/sample) and supplemented with 2ml acetone (dimethyl ketone). Basic variables of milk, i.e. fat, protein, and lactose contents were examined on Milkoscan FT-104.
Data and statistical analysis. Data related to 409 records were collected and arranged by a sophisticated computer and subjected to statistical analysis. Least- mean squares of studied traits, variance components, heritability, genetic and phenotypic correlations were calculated according to the statistical method of two-way of unbalanced design according to the Restricted (or Residual, or Reduced) Maximum Likelihood method (REML) based on the following model:
Where:
Yijk is the progeny record k resulting from j dam which was mated with i sire.
µ is the overall mean.
α is the random effect of i sire.
βij is the random effect of j dam which was inseminated by the i sire.
eijk is the random genetic and phenotypic deviations that resulting from an individual difference within sires (vector of random error) which is presumably =0.
The heritability coefficient was calculated according to the following equation:
h2 = (4 as2)/(o-s2+o-e2 )
Where:
σs 2 is the genetic variation of the sires.
σs 2+ σe 2 is the phenotypic variation of the sires.
The genetic correlation coefficient (rG) was calculated according to the following equation:
Where:
CovxyG is the genetic covariance of traits X and Y between sires.
σ2SxG is the genetic variance of trait X between sires.
σ2 SyG is the genetic variance of trait Y between sire.
The phenotypic correlation coefficient (rP) was calculated according to the following equation:
Where:
CovxyP is the phenotypic covariance of traits X and Y between sires.
σ 2 SxP is the phenotypic variance of trait X between sires.
σ 2 SyP is the phenotypic variance of trait Y between sire.
The breeding value of sires (EBV)was assessed in CC method according to the following general equation:
ccEBV = 2 (STA) = 2 (SGD) (b)
Where:
STA is the Sire Transmitting Ability.
SGD is the Sire Genetic Deviation.
SGD = Σ(D)(n))/(ΣW) = (Σ(D)((Xc- Xh)/(ΣW)
Xc is the mean of the trait of daughters of studied sire.
Xh is the mean of the trait of daughters of rest sires.
W is the coefficient of weight.
W= (n1 n2 )/(n1 + n2)
n1 is the total number of daughters of studied sire.
n2 is the total number of daughters of the rest sires.
b is a slope relating to sire and the mean of n of its offspring.
b = (h2)(ΣW) / (4+(ΣW - 1) h2)
Duncan's multiple range test (DMRT) was used for multiple comparisons of each trait 17. The data were analyzed using the SAS 9.2 statistical package 18.
RESULTS
According to the relationship between sires and half-sibs offspring in the herd, the fifth sire daughters (E Sire) outperformed their counterparts in the 305-DMY trait (p = 0.001), MPP (p = 0.001) and MFP (p = 0.04) where the values of least mean -squares were 5701.44 kg, 3.55, and 3.88% respectively (Table 2). As for MLP trait, the rates of this trait were very similar across the groups of daughters and ranged from 4.76 (B Sire) to 4.80(C Sire) with no significant difference. According to the daughters's distribution in different farms, the highest value of 305-DMY was in Farm 5 (p = 0.04), followed by the Farm 1 (5403.48 and 5335.07 kg respectively), while the quantities were very close to each other in the rest of the farms. Daughters in Farm 7 achieved the highest value in MPP trait (p = 0.007) followed by the order Farms 3 and 5 (3.54,3.48 and 3.48% respectively). As for the rest traits, no significant differences were noticed among groups of daughters (Table 2).
Table 2 Least-square means and standard error (se) of 305 -DMY (kg), MPP, MFP and MLP of daughters according to their sires and farm.
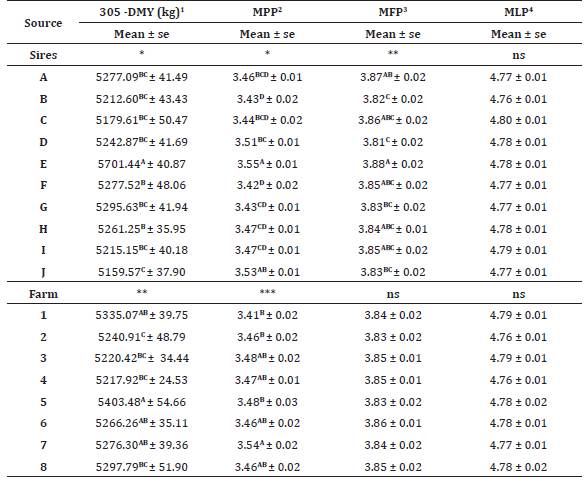
Means with different superscript are different at assigned specific probability, *: p=0.001, **: p=0.04, ***: p=0.007, ns: not significant, 305-DMY1: 305-Day Milk Yield (kg), MPP2: Milk Protein Percentage, MFP3: Milk Fat Percentage, MLP4: Milk Lactose Percentage.
The values of heritability (h 2 ) of 305-DMY, MPP, MFP and MLP traits at daughters were 0.33,0.54,0.43 and 0.47 respectively (Table 3), while the values of genetic correlation coefficients were very low and negative in general except the correlation between MPP and MLP (0.88). Most of the phenotypic correlations among studied traits were also very low except the correlation between MPP and MFP (0.84).
Table 3 Values of heritabilities (h 2), genetic correlation coefficients (above the diagonal) and phenotypic correlation coefficients (below the diagonal) of 305-DMY, MPP, MFP and MLP traits across groups of daughters.
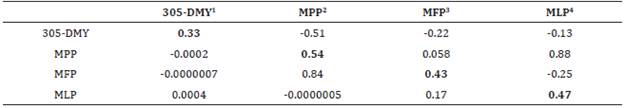
05-DMY1: 305-Day Milk Yield (kg), MPP2: Milk Protein Percentage, MFP3: Milk Fat Percentage, MLP4: Milk Lactose Percentage 3
The contents of Table 4 show the values of SGD, STA and ccEBV of 305 -DMY (kg) for groups of sires daughters, where the fifth sire daughters (E Sire) outperformed their contemporary mates in these values (184.4 ,127.23 and 254 kg respectively) followed by the order the daughters of A Sire (85.97,63.62 and 127.24 kg respectively).
Table 4 Values of b, SGD, STA and ccEBV of 305 -DMY1 (kg) trait for groups of sires daughters
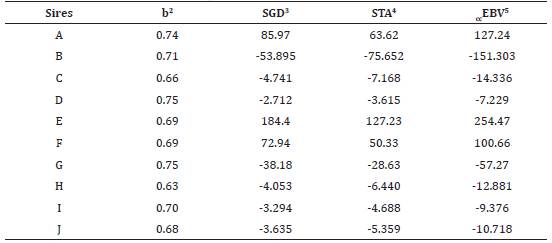
305 -DMY 1: 305-day milk yield (kg), b2: the weight coefficient slope, SGD3: Sire Genetic Deviation, STA4: Sire Transmitting Ability, ccEBV5: contemporary comparison Estimated Breeding Value.
As for MPP trait, it has been noticed that daughter of B Sire achieved the highest values of SGD, STA and ccEBV comparing to other groups (0.33,0.411 and 0.822 % respectively), while the rest of the values were very close to zero only a little for the rest of the daughters (Table 5).
Table 5 Values of b, SGD, STA and ccEBV of MPP1trait for groups of sires daughters
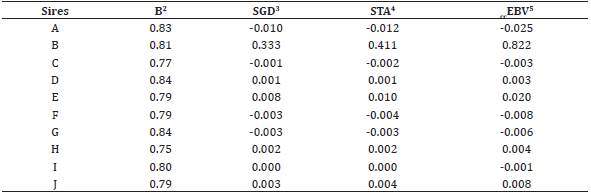
MPP1: milk protein percentage, b2: the weight coefficient slope, SGD3: Sire Genetic Deviation, STA4: Sire Transmitting Ability, ccEBV5: contemporary comparison Estimated Breeding Value.
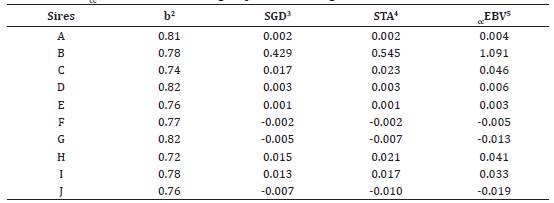
Also, as for the MFP trait, daughter of B Sire accomplished the highest values of SGD, STA and ccEBV comparing to other groups (0.32,0.42 and 0.857 % respectively), while the rest of the values were also very close to zero only a little (Table 6). The values of SGD, STA and ccEBV at the same sire daughters (B Sire) rose slightly relative to the MLP trait, the values were 0.429,0.545 and 1.09% respectively (Table 7).
Table 6 Values of b, SGD, STA and ccEBV of MFP1 trait for groups of sires daughters
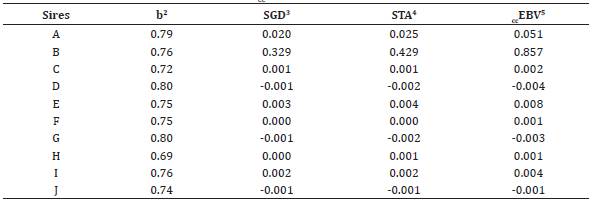
MFP1: milk fat percentage, b2: the weight coefficient slope, SGD3: Sire Genetic Deviation, STA4: Sire Transmitting Ability, ccEBV5: contemporary comparison Estimated Breeding Value
The values of SGD, STA and ccEBV at the same sire daughters (B Sire) rose slightly relative to the MLP trait, the values were 0.429,0.545 and 1.09% respectively (Table 7).
DISCUSSION
In fact, there is a great diversity in the methods that are concerned with estimating the breeding values of sires for the various productive and reproductive traits, but these methods differ greatly among them in terms of principle, requirements, style and resulting values taking into consideration the advantages and disadvantages of each method. The CC method is not a basic substitute for conventional animal breeding but can be a powerful complement.
In the current study, it was noted that the daughters of the fifth sire (E Sire) excelled in the ccEBV of the 305 -DMY trait where the value exceeded the general production level by 254 kg (Table 4) followed by the order the daughters of A and F Sires with a difference didn't exceed 155 kg. This was accompanied by a superiority in the same path in the 305 -DMY trait for the same sires mentioned (Table 2) supported by the estimated high value of heritability coefficient (Table 3) for this trait. But the ccEBV of MPP, MFP and MLP traits were outperformed by the daughters of B Sire. The estimates of milk production in first lactation parity for 305 -DMY in our study (Table 2) were lower than those reported by Buckley et al 19 and Pritchard et al 20 who reported that 305 -DMY of Holstein-Friesian breed were 6557 kg and 7480.06 kg, respectively. MPP and MFP in our study (Table 2) were little close to the values attained by Calus et al 21 in Australian Friesian (MFP 3.87%) and by Gorjanc et al 22 in Brown Swiss (MFP 3.89%, MPP 3.22%) and Slovenian Simmental (MFP 3.92%, MPP 3.26%). While MLP values in our study were lower than the value 5.12% that were attained by Sneddon et al 7. With regard to our findings on genetic and phenotypic correlations, they were very similar to those of Sneddon et al 7 while the values of heritabilities were lower than those in our study, where the values for 305-DMY, MPP, MFP and MLP traits were 0.22, 0.32, 0.35 and 0.25 respectively. Also, the heritabilities were less than our findings for those reported by Welper and Freeman 23, Roman et al 9 and Pryce and Harris 11.
Our mentioned results indicate that there is a clear genetic superiority among the studied sires, on the other hand, there were also a clear difference in the amounts of studied traits based on source of farm, although the amount of milk decreased relatively compared to the random factor source (sire) in daughters in different groups. Many studies emphasized the role of environmental factors, farm, health, nutritional conditions and management in the productive and reproductive performance of cows which in the end either increases or decreases production 24,25. According to basic principle of CC method which includes the study of one independent trait in estimation, we find that the daughters of sires, whose breeding values were declining in the traits of 305 -DMY, have excelled in the breeding values of other traits, where the daughters of B Sire have excelled in the MPP, MFP and MLP traits (Tables 5, 6 and 7). In general, according to the multiple relationships that dominate the different traits of the milk product and its components such as genetic, phenotypic and environmental correlations, it is granted, that this leads to different breeding values. Some important considerations may be the reason for the low productivity of cows in the first lactation parity in our study, where cows in the first lactation parity of production cannot fully show their genetic abilities, cows may be incomplete growth or their organs are not developed to the extent required 26. Despite the modest performance of daughters in the first productive parity, this gives a very basic and important consideration in the process of selecting sires, as it is expected that productivity among daughters will rise significantly to high levels in the subsequent productive parities, taking into account the mating system that occur within the breed, such as inbreeding, it is necessary looking at the rates of mating, which may give rise to some problems generated by the homozygosity 27. Anyway, the wide range in the ccEBV of the 305 -DMY trait of the studied sires gives an impression about the wide range of additive genetic variation, which is very important in the selection programs, thus, setting a strategy for the genetic improvement processes by preserving the superior sires and their daughters in order to benefit from their offspring later for the purpose of herd sustainability and carrying out the replacements in an appropriate way. In our study, an opposing relationship has been emerged during the rise in the breeding values of MPP, MFP and MLP traits and the decrease in those values for the 305 -DMY trait or the contrary at daughters of studied sires. In most literature studies, generally, this opposing may create a kind of controversy and preference for these traits among breeders, some food industrial establishments, or even the government institutions plan. Where the goal, sometimes, is to plan to acquire manufacturing destinations such as cheese and butter, or otherwise, depending on the economic value and prices of milk and its components and yield size 28.
In conclusions from the current study, it was concluded that there was a clear difference in ccEBVs and high differences in additive genetic variation among the studied traits of milk and its composition that can be used in the process of subsequent selection and other breeding purposes.

