


 Inglés (pdf)
 Articulo en XML
 Referencias del artículo
 Enviar articulo por email
 Citado por SciELO
  Citado por Google
  Similares en
SciELO
Similares en
SciELO  Similares en Google
 Permalink
The Spanish government used the institution of the mission in an attempted process of social engineering designed to transform the socio-economic and political organization of indigenous peoples living on the fringe of its American territories, and to convert them to Catholicism. The goal was to create politically autonomous communities of sedentary agriculturalists resembling those in regions such as central Mexico. This transformative agenda worked best with groups that already practiced agriculture and exhibited a more or less sedentary way of life. However, the transition proved difficult, if not impossible, due to non-sedentary groups who shared a different set of values based on gender roles, and the ways in which men achieved social status. The values of the successful hunter and warrior stressed by many non-sedentary groups shaped men's access to social status, which in turn defined distinct gendered labor roles. Women, for example, generally collected wild plant foods, something which became a source of conflict with missionaries who expected men to work in agriculture in tasks which closely resembled the gendered work of women. The missionaries often failed to grasp the logic of the organization of non-sedentary groups, and attempted to enforce changes which, in many instances, men found unacceptable.
In 1768, the reform-minded royal official José de Gálvez attempted to convert the non-sedentary Guaycurus of southern Baja California into an agricultural workforce as part of a plan to make marginal missions economically self-sufficient. The plan backfired, however, since royal officials ended up hiring non-indigenous laborers to work the mission fields, which defeated the purpose of trying to economize at a time of reform (Jackson, "The Guaycuros"). Similarly, efforts to congregate and evangelize the hunter-gatherers Pames and Jonaces in the Sierra Gorda region of Mexico failed for nearly two hundred years, when sixteenth century missions were established among sedentary communities of central Mexico. It was only in the 1740s and 1750s that Franciscan missionaries were able to successfully congregate the Pames, but only with the support of soldiers who forcibly relocated the natives to the missions. The Jonaces, on the other hand, continued to resist such forced change unto their way of life (Jackson, "Demographic patterns").
The Jesuits in South America experienced similar difficulties with non-sedentary indigenous peoples. The Jesuit province of Paraquaria covered an extensive territory in what today are the countries of Argentina, Bolivia, Brazil, and Paraguay. The Guaraní and the groups that evolved into the Chiquitanos through a process of ethnogenesis were agriculturalists who practiced swidden agriculture, and the Jesuit missions established among these groups played an important role in their evangelization program. However, there were also non-sedentary groups that the Jesuits attempted to evangelize, and the Black Robes encountered similar difficulties in the attempt to convince non-sedentary groups to change their way of life. The Chaco region was one porous border between indigenous agriculturalists and non-sedentary groups, and the Jesuit-established missions in the seventeenth and eighteenth centuries which attempted to evangelize the different groups living there. The Banda Oriental (modern Uruguay) and Rio Grande do Sul, which was a border zone contested by Spain and Portugal, was a second example. The ethnic group in this area, the Guenoa Minuanos, and the Jesuit efforts to evangelize them is the subject of this article, with special reference to the mission of San Francisco de Borja.
Several groups including the Yaros, the Charrúa, and the Guenoa Mi-nuanos interacted with the Jesuit missions established among the Guaraní as raiders, while they also engaged in trade (Bracco, "Charrúas, bohanes"; Levin-ton, "Guaraníes y charrúas"; Levinton,"Las estancias"). The bands of Charrúa interacted primarily with the Jesuit mission los Reyes Yapeyú, established on the west bank of the Uruguay River in 1627. Similarly, Guenoa Minuanos engaged in trade with the missions of La Cruz, Yapeyú, and Santo Tomé, as reported in the 1670s (Bracco, "Los guenoa"). Some entered the missions.
In 1702, the Jesuits established a short-lived mission named San Andrés de Yaros following a 1701-1702 military campaign directed against the non-sedentary indigenous groups living in the Banda Oriental who had allied with the Portuguese during the War of Spanish Succession (1701-1713), and raided the Jesuit missions.1 The mission collapsed when the natives abandoned the mission (Levinton, "Las estancias" 36). The Jesuits congregated small numbers of non-sedentary indigenous peoples into the missions amongst the Guaraní following the 1701-1702 military campaign. For example, the Jesuits reported the resettlement of 46 non-Christians on Corpus Christi mission (Jackson, "Demographic Patterns"). In the same year the Jesuits settled 40 Yaros on Candelaria mission. The Black Robes reported that they catechized the adults daily in the morning and in the afternoon (BNB, CA, "Annua de los dos Pueblos de la Candelaria y de S. Cosme y S. Damian en 1702"). The conflict with the non-sedentary groups in the Banda Oriental continued for several more years. A 1705 report noted continued raids by Yaros and other groups on mission livestock (BNB, CA, "La Carta Annua"). The conflict escalated in 1707 and 1708 as non-Christian Guenoa Minuanos, Yaros, and Bohanes allied with the Portuguese continued to raid mission and the Spanish livestock, attacked mission residents, and sheltered fugitives from the missions. In one incident hostile natives attacked a raft from Santo Tomé mission. They also attacked mission Estancias, including those of La Cruz and Yapeyú. In the last attack the raiders killed 13 and took another 26 women and children hostage. In November of 1707 the Jesuits sent a force of 250 mission militia from La Cruz, Yapeyú, and San Francisco de Borja to pursue and punish the raiders, a move which decisively defeated the hostile Guenoa Minuano bands (BNB, CA, Medrano y de Borja "Estado y motivos").
Periodic hostilities continued with the non-sedentary indigenous groups through the end of the eighteenth century. Military campaigns in 1749, 1750, and 1751 forced hundreds of Charrúa to settle on a Franciscan mission named Concepción de Cayastá located at what had been the first site of Santa Fe on the eastern bank of the Paraná River (Bracco, "Charrúas y aculturación"). Guenoa Minuanos also sought refuge on the missions following the campaigns. Similarly, some 650 infieles sought refuge on La Cruz, Yapeyú, and San Francisco de Borja in 1794, and this group included 130 Guenoa Minuanos (Bracco, "Los guenoa" 44).
This article examines the resettlement of Guenoa Minuanos on two missions located east of the Uruguay River in what today is Rio Grande do Sul. They were San Francisco de Borja established in 1682 at a site near the east bank of the Uruguay River. It had been a visita of Santo Tomé mission, but the Jesuits elevated the community to the status of an independent mission as a part of its geopolitical campaign to occupy present-day Rio Grande do Sul, following the 1680 Portuguese establishment of Colonia do Sacramento (Jackson, Regional Conflict). The Jesuits established Jesús María de los Guenoas in 1690 at a site close to San Francisco de Borja. It operated as an independent mission community until 1720 when the Jesuits merged the two missions following the severe 1718-1719 smallpox epidemic.
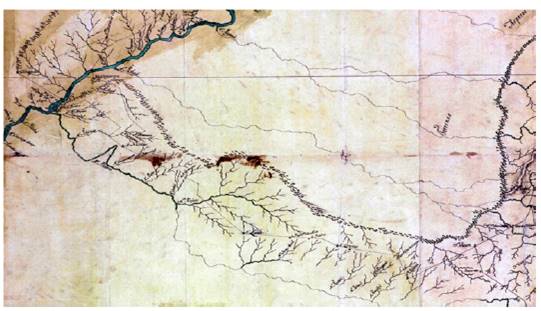
Source: Courtesy of the Geography and Map Division, Library of Congress, Washington, D. C.
FIGURE 1 Plano topográfico que comprende una parte del Montegrande, el Río Yacuy, los establecimientos y misiones del Uruguay, los yervales que actualmente poseen los indios guaranías y el curso del mismo Uruguay desde la boca del verdadero Pepiri o Peguiri hasta el paso que llaman de Concepción. A contemporary map showing the Jesuit missions located east of the Uruguay River.
The population of Jesús María was open, which means that the Jesuits congregated non-Christians into the missions. The Jesuits reported the baptisms of 21 adults in 1690 when the mission was first established, 10 in 1691, 14 in 1693, 31 in 1695, one in 1700, 23 in 1705, and 11 in 1708 (BNB, CA,Annua de las Doctrinas del Paraná y Uruguay... del año de 1693, Annua de las Doctrinas del Paraná y Uruguay... del año de 1694; Estado de las reducciones del Paraná de este año de 1698; Annua Doctrinas del Uruguay del año de 1698; Anuas de las Misiones del Uruguay del año de 1700; Estado de las Doctrinas del Uruguay al fin del año de 1705; Estado de las Doctrinas del Uruguay al fin del año de 1706; Estado de las Doctrinas del Uruguay del año de 1715; Estado de las Doctrinas de Paraguay del año de 1716; Estado de las Doctrinas de Paraguay del año de 1717; Jackson, Demographic Change 248). However, the fluctuation in the population (see Figure 2, Appendices: Table 1) suggests a similar pattern to that of established missions among other non-sedentary indigenous groups such as those in the Chaco region. The Guenoa Minuanos settled on the mission, but some left thereafter. The pattern of fluctuations in the population suggests the failure of the Black Robes to convince the natives to abandon their traditional way of life, particularly the social norms that defined gender roles between men and women.2 The mission censuses recorded a population of 324 when the Jesuits established Jesús María in 1690. This number reached a record high of 357 in 1714, it stood at 238 in 1717, and then dropped to 238 in 1719 following the smallpox epidemic of 1718-1719. The 1720 mission census showed the mission merged with San Francisco de Borja, and the 1724 population count did not record the mission at all.
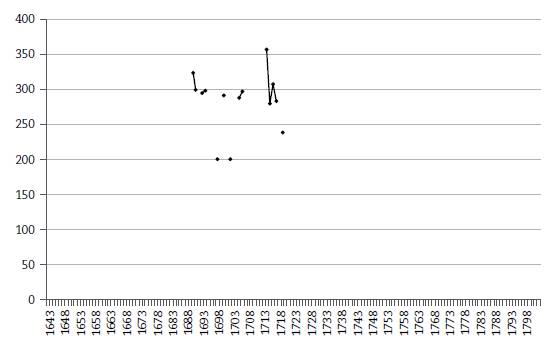
Source: Made by the author based on tables included in the appendices.
FIGURE 2 The Population of Jesús María de los Guenoas Mission, 1690-1719
Following the closing of Jesús María the Jesuits made several attempts to establish missions for the Guenoa Minuanos. In 1727, a Guenoa Minuano band requested the establishment of a new mission in their own territory. Similarly, the Black Robes founded two missions, one in 1746 and another one in 1750, in the Banda Oriental, present-day Uruguay. The second was located close to Montevideo (Bracco, "Los guenoa" 37, 39). However, the majority of Guenoa Minuanos settled on the Guaraní missions, and particularly on San Francisco de Borja.
A 1732 document summarized the number of baptisms recorded on San Francisco de Borja between 1682 and 1732 (see Figure 3, Table 3) (BNB, CA, Relación de los Bautismos del Pueblo de San Francisco de Borja, desde el año de su fundación en 1687 hasta el presente año de 1732). The summary records baptisms of 402 non-Christian adults the Jesuit had settled on the mission in the first two decades following the establishment of the mission, and again in the 1720s and 1730s following the merger of the population of Jesús María. The document recorded the baptism of the children of the recently congregated adults in the list of baptisms of párvulos, or children under the age of about ten. Moreover, the document noted the baptism of another 1,952 individuals who had settled on Santo Tomé and San Francisco de Borja, and of most, if not all of whom were Guenoa Minuanos (see Figure 4). This pattern shows that the Jesuits baptized Guenoa Minuanos at both missions, but Jesús María was an exclusively Guenoa community. The Jesuits continued to congregate Guenoa Minuanos on San Francisco de Borja mission during the rest of their tenure on the mission, although the process of congregation did not always go smoothly. In 1730, for example, 40 members of one band settled on the mission, but other band members refused to do so following an altercation with another indigenous group that resulted in several deaths. However, the band members promised to return to the mission once they had exacted blood revenge from the group they had clashed with (Bracco, Los guenoa 38). The Guenoa Minuanos continued to adhere to their traditional values and way of life.
Source: Colegao de Angelis, Biblioteca Nacional, Rio de Janeiro, Brazil.
FIGURE 3 A 1732 summary of baptisms recorded on the San Francisco de Borja mission from 1682 to 1732
Guenoa Minuanos constituted a large part of the population of San Francisco de Borja. A 1743 report noted that a third of the people living on the mission were Guenoa Minuanos (Bracco, Los Guenoa, 38). By 1743 the mission had a population of 3,871, and the number of Guenoa Minuanos lied between 1,200 and 1,300 (see Table 4). The Jesuits congregated several non-sedentary groups on other missions. During the seventeenth century, for example, the Jesuits congregated Charrúa on Yapeyú mission. In the years 1665-1666 the Black Robes settled some 250 on the mission and 500 Yaros in 1701 during the campaign against the non-sedentary groups in the Banda Oriental (Jackson, Demographic Change 16). The Jesuits recorded one baptism of a non-Christian adult there in 1693, while 19 were recorded in 1698. The missionaries stationed on Corpus Christi congregated bands of a non-sedentary group known as Guañanas in 1702, 1724, 1730, and 1754. By 1759 there were 112 Guañanas living on the mission in separate cacicazgos in addition to 4,530 Guaraní (Jackson, Demographic Change 101-102). The Jesuits also reported the baptism of a few non-Christian adults at other missions. At Jesús, for example, there were 11 in 1691, 31 in 1695, and 2 in 1702. In 1702, it was 10 adults and older children at Loreto, (BNB, CA,Annua del pueblo de Loreto de 1702). Seven at San Ignacio, and 18 at San Francisco Xavier in 1708. However, San Francisco de Borja most likely had the largest population of non-sedentary groups of the 30 missions amongst the Guaraní.
Demographic Patterns on the San Francisco de Borja Mission
Several factors framed demographic patterns in San Francisco de Borja and other missions. One was the ease of communication on the river highways that facilitated commerce; yet another was the spread of contagion (see Figure 4). Epidemics spread to the missions about once every generation or every 20 years. A second factor was the Jesuit urban plan on the missions. The Black Robes instituted a policy of congregating the entire population of a given mission into nucleated settlements that in many instances had populations of more than 3,000, 4,000, 5,000, or in one case more than 8,000. The Jesuits had rows of buildings with multiple apartments to house the mission residents (see Figure 5). The mission's urban plan facilitated the spread of contagion across the population. Moreover, mission populations had moderate to high birth rates, which meant there were large numbers of potentially susceptible hosts when epidemics spread through the missions. Given the high population densities, there were epidemic death rates of as high as 50 percent of the population in any given mission. However, mission populations rebounded or recovered following epidemic outbreaks with the formation of new families and particularly high birth rates.

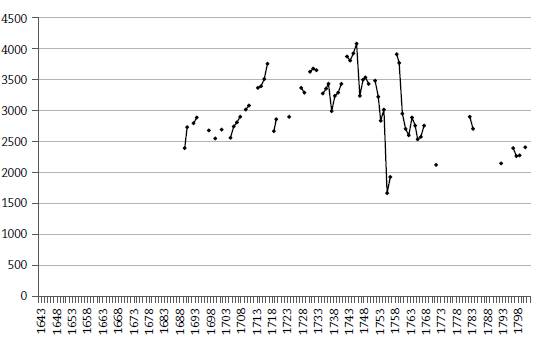
Source: Made by the author based on tables included in the apendices.
FIGURE 5 Population of San Francisco de Borja Mission, 1687-1801
The first existing census of San Francisco de Borja mission recorded a population of 2,396 in 1690. This amounts to the population transferred in 1682 to establish the mission, including the recently congregated Guenoa Minuanos. A measles epidemic in 1695 caused elevated mortality, and the numbers dropped by more than 200 from 2,888 recorded in 1694 to 2,688 in the next existing census in 1698. However, the numbers grew over the next two decades with moderate to high birth rates and the congregation of small numbers of non-Christians. The population totaled 3,757 in 1717 (see Figure 6).
Source: Made by the author based on tables included in the apendices.
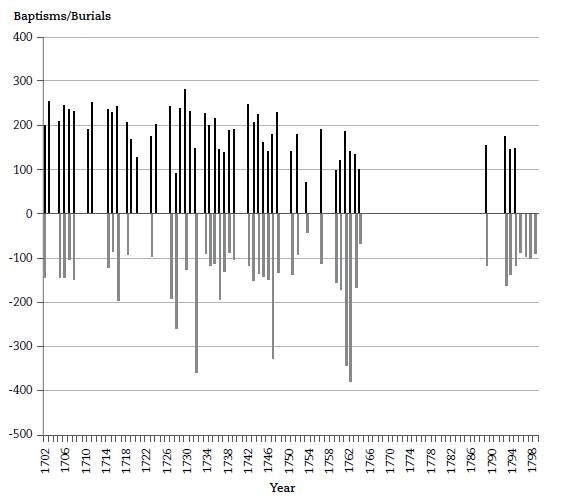
FIGURE 6: Baptisms and Burials at San Francisco de Borja Mission, 1702-1803
A severe smallpox epidemic spread through the missions in 1718-1719, and the heaviest mortality at San Francisco de Borja mission appears to have ocurred in the first year of the outbreak. This was a full generation following the previous outbreak in 1695. The population experienced a net decline of some 1,000 people. The numbers dropped to 2,673 in 1719. It was at this point that the Jesuits merged the population of Jesús María and San Francisco de Borja, and directed efforts to congregate Guenoa Minuanos from San Francisco de Borja.
The population was 2,861 in 1720 following the merger, and continued to grow during the following decade. In non-crisis years there were more births and baptisms than burials (see Figure 8). The population totaled 3,769 in 1732 on the eve of a series of mortality crises that included crop failure, famine, and epidemics. In the years 1733-1740, some 90,000 people died in the missions. However, the population of San Francisco de Borja did not suffer catastrophic mortality during the crises of the 1730s; it was actually one of the missions that experienced population growth during the decade. The highest recorded mortality rate was a CDR of 97.6 per thousand population in 1733; in the years 1733, 1735-1740 the Jesuits recorded 1,264 baptisms against 1,085 burials, a net increase of 179. The numbers fluctuated during the decade, and stood at 3,291 in 1740. The population of the mission continued to grow in the 1740s and early 1750s. In the years 1741, 1744-1750 the Black Robes baptized 1,585 and recorded 1,253 burials, a net growth of 332. The mission population was 3,430 in 1741, and grew to 4,081 in 1746, and subsequently to 3,232 in 1753 (see Table 4).
Source: Made by the author based on tables included in the appendices.
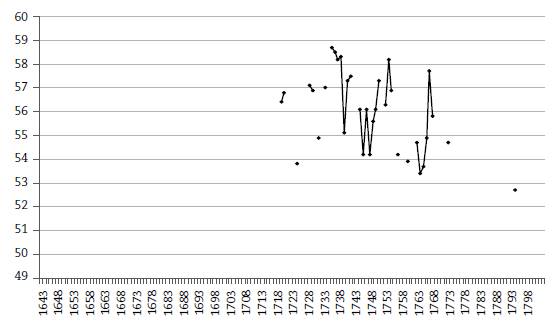
FIGURE 7 Females as a percentage of the total population of San Francisco de Borja Mission, 1719-1793
Source: Made by the author based on tables included in the apendices.
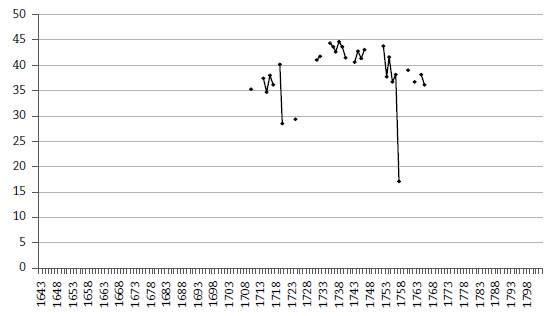
FIGURE 8 Párvulos as a percentage of the total population of San Francisco de Borja Mission, 1710-1765
In 1750 Spain and Portugal signed the Treaty of Madrid that specified the boundaries of their territories in South America. Under the terms of the Treaty, Spain transferred the sites of the seven missions located east of the Uruguay River to Portugal in exchange for Colonia do Sacramento. The residents of the seven eastern missions resisted the transfer, while a number of non-Christian Guenoa Minuanos joined the uprising. A joint Spanish-Portuguese army defeated the rebels in 1756, and Spanish officials implemented the plan to transfer the populations of the seven missions to the remaining missions west of the Uruguay River. The Jesuits relocated the bulk of the population of San Francisco de Borja across the Uruguay River to Santo Tomé. Not only was there an historical connection between the two communities, but the population of Santo Tomé had also experienced heavy mortality rates during the 1730s. From a high of 3,593 recorded in 1732 the numbers dropped to 1,699 in 1739. The population of Santo Tomé rebounded and grew to 2,499 in 1753, but still had not recovered to pre-crisis levels, affording thus space to accommodate the refugees from San Francisco de Borja. In 1756, 1,641 had relocated to Santo Tomé, and this number increased to 3,721 in 1750. However, the population reoccupied the San Francisco de Borja mission site fairly quickly following the abrogation of the Treaty of Madrid in 1761. By the end of 1763 those at Santo Tomé had returned to the mission site, and by the end of the following year another 253 who had been settled in six missions located in what today is southern Paraguay had also returned (Jackson, Demographic Change 73-74).
An outbreak of smallpox at San Francisco de Borja during the summer of 1764-1765 was spread by a Spanish army that had invaded the Portuguese settlements in Rio Grande do Sul. The Jesuits recorded 341 burials in 1764 (a CDR of 131.1 per thousand population), and 378 burials in 1765 (a CDR of 130.7 per thousand population). In the years 1763-1765 the Jesuits recorded 451 baptisms against 889 burials, a net difference of -438. The mission population dropped to 2,546 recorded in 1766 (see Table 4). Mortality was relatively light compared to other missions, and remained consistent with the pattern documented during the crises of the 1730s of moderate death rates when compared to the catastrophic mortality (in excess of 250 per thousand population) at many of the other missions. It is possible that the Jesuits in the mission were able to isolate their population from the neighboring missions through a more effective quarantine plan, given its location east of the broad Uruguay River.
Fluctuations in the population of the mission during the years following the Jesuit expulsion from Spanish dominions in 1767 and population shifts resulted primarily from migration. While it recorded 2,131 in 1772, 2,403 in 1797, and 2,413 in 1801 on the eve of the Luso-Brazilian conquest of the territory of the seven eastern missions. As already noted above, numbers of non-Christian Guenoa Minuanos and other non-sedentary groups from the Banda Oriental continued to seek refuge within the mission communities, particularly in San Francisco de Borja. There is a register of baptisms and burials for San Francisco de Borja for the early years of the nineteenth century. Spanish surname priests continued to administer the ex-mission, and recorded entries in the register in Spanish, not in Portuguese. An epidemic in 1809-1810 killed several hundred at San Francisco de Borja, but overall the population continued to grow and rebounded following the outbreak of the unidentified contagion ( Jackson, Demographic Change 166).
The Gender and Age Structure
Unlike the populations of missions on other frontiers of Spanish America, the populations of the missions among the Guaraní proved to be resilient, and rebounded or recovered following epidemic outbreaks. The Guaraní-Guenoa Minuano population of San Francisco de Borja proved to be no different. Several factors explain the ability of the mission populations to recover. One was the gender structure. Women and girls constituted the majority of the mission population during the eighteenth century, even following epidemic mortality. This meant that there was a pool of women available for the formation of new families. Moreover, Guaraní and Guenoa Minuano women married at a relatively young age soon after puberty, and on average, had a child about every two years. Moreover, there were no economic limitations to family formation or to procreation, enabling women to have many children.3 Figure 7 shows the number of women and girls as a percentage of the total mission population. Females constituted more than 52 percent of the total. More women generally died from diseases such as smallpox and measles because of the TH-2 immunological response, as occurred, for example, during the 1764-1765 smallpox epidemic. However, women still remained the majority.
The mission populations exhibited high fertility and mortality rates. This meant that death rates tended to be high, but in non-crisis years birth rates were higher still. Moreover, the mission populations were young, meaning that young children constituted a large percentage of the total population; families also tended to be large. This can be seen, for example, in the number of párvulos, the category used for children under the age of ten, as a percentage of the total population. In non-crisis years young children constituted between 30 and 45 percent of the total population (see Figure 8). Severe epidemics killed many of young children, shifting the age structure of the mission population. This can be seen in the case of the 1718-1719 smallpox epidemic. Párvulos constituted 40 percent of the mission population in 1717, but dropped to less than 30 percent in 1719 following the heavy mortality. However, high birth rates and the continued congregation of non-Christians contributed to an increase in the number of young children and the restoration of the pre-epidemic age structure.
By Way of Conclusion: Non-Sedentary Indigenous Peoples and Missions as places of refuge
The Jesuits and other missionaries encountered considerable difficulty in trying to convince non-sedentary and non-agricultural peoples to settle in missions and to change their way of life by adopting a sedentary lifestyle as agriculturalists. The missionaries failed to understand the logic of gendered values that defined social status, and environmentally-adapted ways of obtaining sustenance. European-style agriculture entailed a change in the gendered division of labor that did not appeal to many groups. However, some non-sedentary groups used the missions as places of refuge for children, women, and the elderly while men went off to war or to hunt. An example of this was the Jesuit Chaco mission San Fernando de Abipones founded in 1750. The demographic profile of the mission population and the patterns of the administration of the sacraments show an absence of most men. The equestrian Abipones men acquired their status by way of their abilites as hunters and warriors, and most likely, found agriculture to have been closed to the gendered work of collecting wild plant foods performed by women. Ironically, the Jesuits hired non-Abipones to do work in the mission (Jackson, Demographic Change; Salinas, "San Fernando").
A second example is that of the non-sedentary bands collectively known as the Karankawas that lived on the Gulf Coast of present-day Texas. The Franciscans established three missions in the region: Espíritu Santo (1722), Rosario (1754), and Refugio (1793). The Karankawas practiced seasonal transhumance between prairie and coastal sites. The evidence shows seasonal fluctuations in the populations of the missions as the neophytes left and returned to the missions. There were also shifts in the age and gender structures of the missions with the comings and goings of the neophytes (Jackson, "Congregation").
A baptismal register from Refugio mission in the years 1807-1828 recorded the baptisms of 145 natives, and documented evidence of baptisms of children that were born away from the mission from parents previously baptized at the mission. There is also evidence of the underreporting of burials, since many Karankawas died away in the mission, a case also seen at the San Fernando de Abipones mission (Jackson, "Congregation" 16-17). The Karankawas fit the missions into their seasonal pattern of migration, entereing and leaving the missions at will. In October of 1795, for example, at the time of the migration to the coast, there were 56 natives on Refugio and 82 absent. Returning to the mission required young children to be baptized. (Jackson, "Congregation" 16-17).
The Guenoa Minuanos were an ethnicity politically and socially organized in small bands. Some bands opted to enter the missions, and particularly San Francisco de Borja. If the Jesuits there had handled the settlement of Guenoa Minuanos as those at Corpus Christi did with the Guañanas, they would have wound up in cacicazgos under their own leaders. It was significant that the Black Robes attracted large numbers of Guenoa Minuanos to the mission; it is therefore conceivable that these bands were geographically closest to that mission which, perhaps, saw the greatest benefit from an alliance with the Jesuits.
The Banda Oriental and Rio Grande do Sul lied over a contested borderland between Spain and Portugal, while indigenous groups such as the Guenoa Minuanos, Yaros, and Charrúa took sides in the struggle. The 1707-1708 military campaign shows that some Guenoa Minuanos bands enacted an alliance with the Portuguese rather than with the Spanish, continued to uphold their way of life, yet incorporated the Spanish colonial regime. Military campaigns in 1750-1751 and again in 1794 forced some bands into the missions, although the question of how long they may have remained is still unanswered. The Guenoa Minuanos who settled on San Francisco de Borja and other missions may have done so to avoid other forms of exploitation, particularly, enslavement by the Portuguese. In this regard the missions served as a hideaway.

