


 Inglês (pdf)
 Artigo em XML
 Referências do artigo
 Enviar este artigo por email
 Citado por SciELO
  Citado por Google
  Similares em
SciELO
Similares em
SciELO  Similares em Google
 Permalink
Scholars have constructed models to explain demographic patterns among the indigenous populations of the Americas following the establishment of sustained contact with the Old World after 1492. Alfred Crosby hypothesized the model of what he called “virgin soil” epidemics, the first epidemics that broke out in the Americas, which he characterized as having had catastrophic mortality levels in the range of more than 50 or 60 percent of a given population. However, according to the model, indigenous populations that survived the initial epidemics gradually built up immunities to old-world pathogens. There was an initial die-off and reduction in populations but then, as indigenous peoples built up immunities, the population numbers grew again. Henry Dobyns took this interpretation forward to argue that epidemics spread like miasmic waves across the Americas, and that mortality rates were uniform across regions and populations (“An appraisal of techniques”; Their number become thinned). However, the evidence that Dobyns presented was more qualitative and descriptive. He did not consider documented patterns of contemporary early modern European populations that could be applied to interpretations of patterns in the Americas, such as the rebound or recovery of populations following epidemics through the formation of new families and increased birth rates. Rather, Dobyns hypothesized a continuous population decline. However, in a detailed study of Spanish Tucson in what today is Arizona, Dobyns documented patterns that are distinct from his hypothesized model (Spanish Colonial Tucson).
The Jesuit missions established after 1609 among groups known as the Guarani, in the Río de la Plata region of South America, provide a microcosm of demographic patterns among the indigenous populations in the Americas in the early modern period, and provide compelling evidence to challenge the contemporary wisdom propounded by Crosby, Dobyns, and others. Different scholars have examined demographic patterns of the Jesuit missions among the Guarani. Ernesto Maeder was one of the first to compile population figures on the missions and characterize demographic patterns (Livi-Bacci and Maeder, La población de las misiones; La población guaraní de las misiones). Maeder later collaborated with Italian historical demographer Massimo Livi-Bacci to present a new interpretation of trends in the Guarani missions (Livi-Bacci and Maeder, “The Missions of Paraguay”). While Livi-Bacci brought unique insights from his previous studies of European historical demography, there were flaws in their interpretation and in the methodology (Jackson, “The population”). Ignacio Telesca analyzes post-Jesuit expulsion populations but focuses primarily on the province of Paraguay and does not reconstruct the vital rates of the populations (“Tras los expulsos”). Some scholars offer interpretations of what they believe to be demographic patterns of the missions among the Guarani based on the same assumptions regarding post-1492 indigenous demographic patterns. There was considerable variation in patterns between the individual missions, and presenting composite population figures of all of the missions is meaningless in terms of understanding demographics (Sarreal 239). Demographic patterns of the Yapeyú mission, which is the subject of this article, is a case in point of variations between missions. It is also more useful to calculate the vital rates of populations overtime, rather than to present population figures and calculate the percentage differences between those figures, as Sarreal does (142).
Upon closer examination, the trend of demographic patterns of the missions among the Guarani challenges the assumptions made by several generations of scholars regarding the indigenous populations of the Americas based on the hypotheses of Crosby and Dobyns. These were high fertility and high mortality populations, meaning that many died, but in non-epidemic years birth rates were higher than death rates. Periodic epidemics spread about once a generation to the missions from the urban centers of the Rio de la Plata region such as Buenos Aires, and in some instances caused catastrophic mortality that reached more than 50 percent of the population of a given community, in the range of what has been hypothesized for “virgin soil” epidemics. The methods available to combat contagion were limited and included the practice of quarantine in temporary plague hospitals located away from the main mission community. However, the mission populations generally recovered following epidemic outbreaks. There were an increased number of marriages, indicating the formation of new families, and high birth rates. In the eighteenth century, smallpox was the most lethal killer of Guarani, and there were outbreaks of the contagion in 1718-1719,1738-1740 (in conjunction with famine conditions), and 1763-1765 (Jackson, Demographic Change and Ethnic Survival; Regional Conflict and Demographic Patterns).
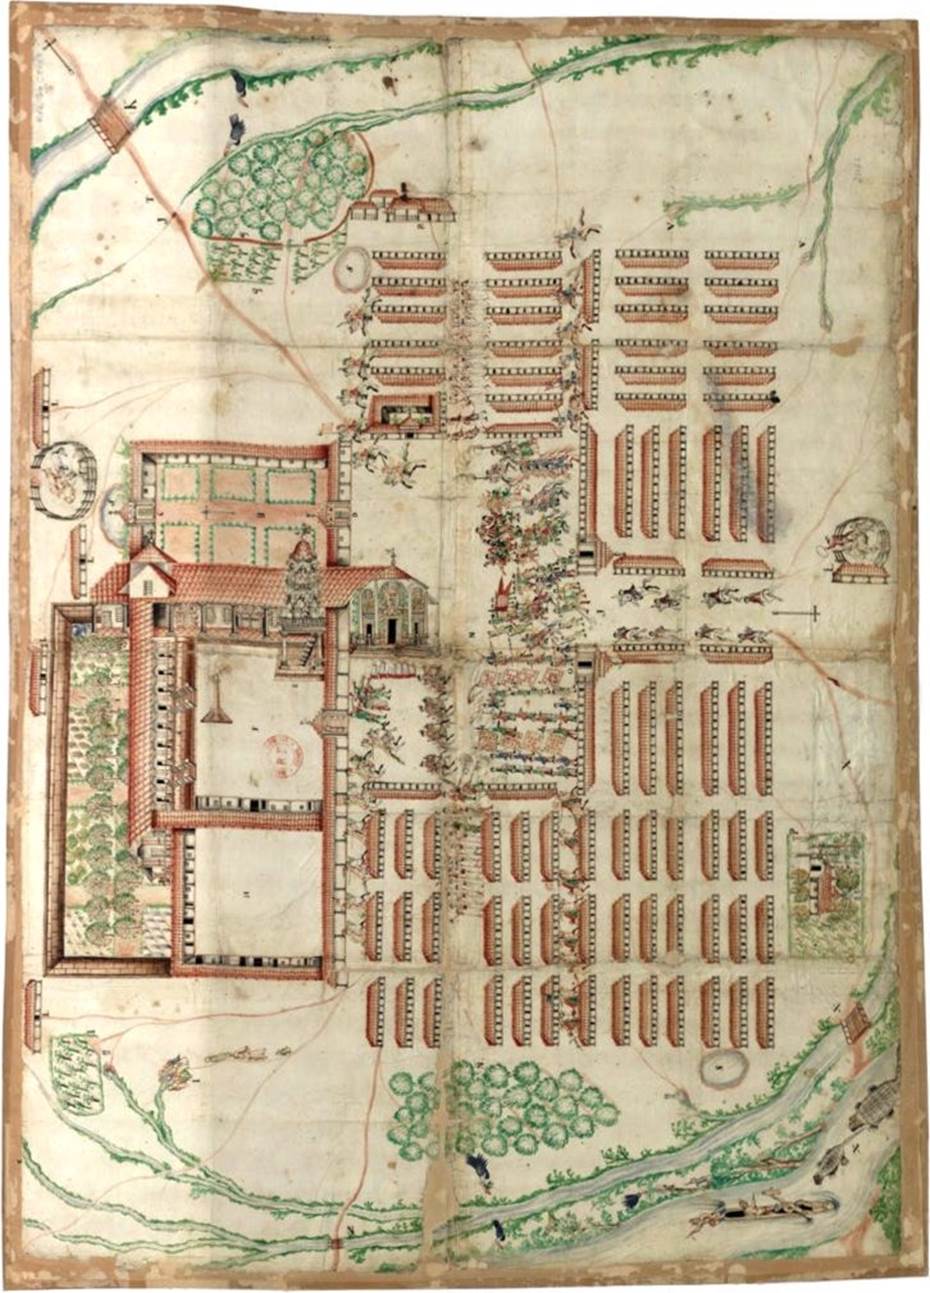
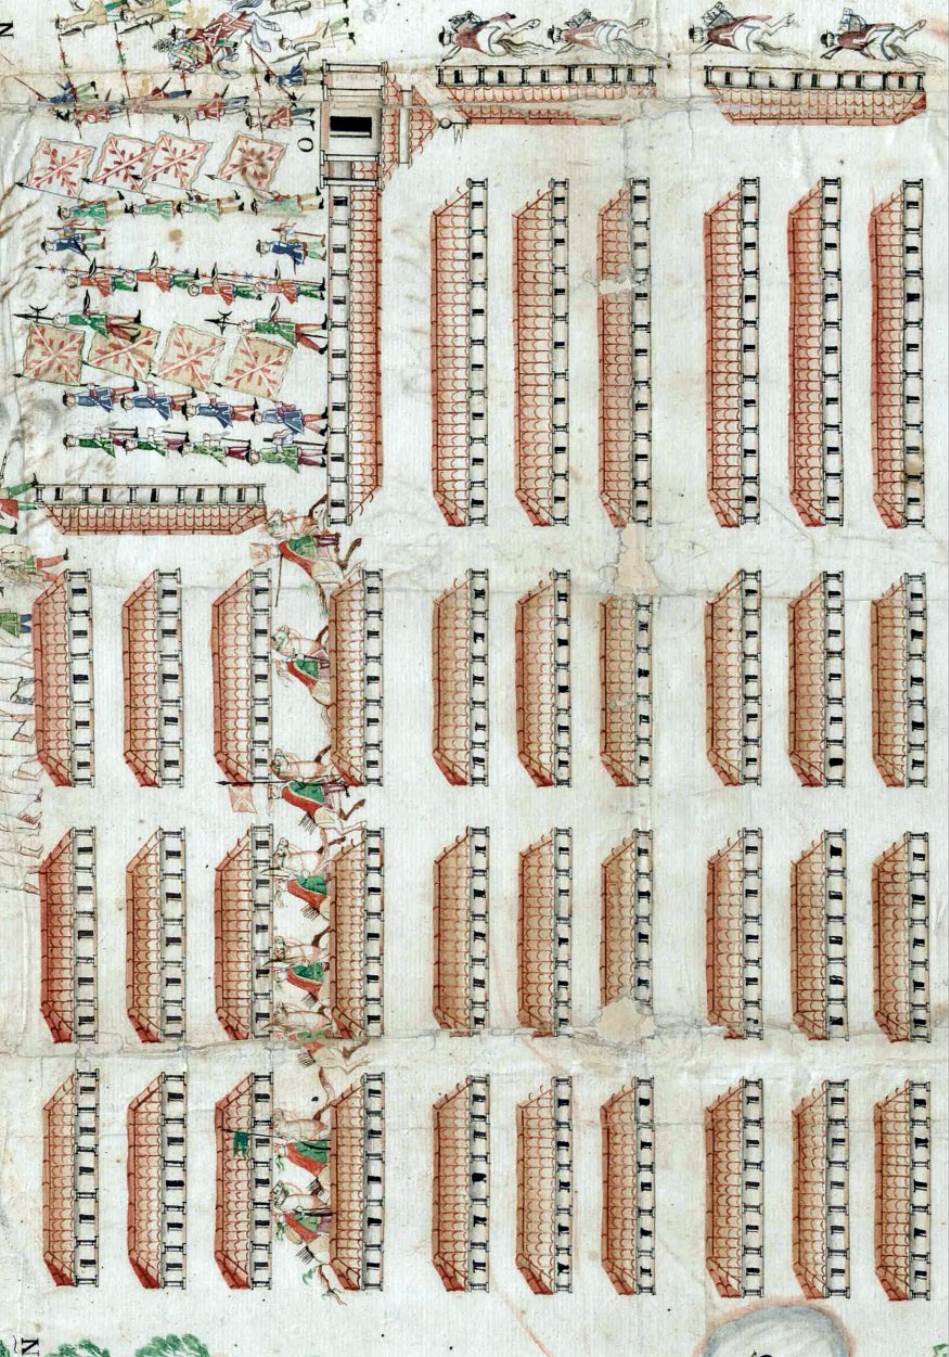
Several factors contributed to the pattern of periodic catastrophic mortality crises. One was the ease of communications on the river highways in the region, particularly on the Paraná and Uruguay Rivers (see Figure 3). A second was the pattern of regional conflict as Spain and Portugal contested control of the Rio de la Plata borderlands during most of the seventeenth and eighteenth centuries, and the mobilization of thousands of mission militiamen to participate in the conflict. Armies on the move facilitated the spread of contagion. A third factor was the Jesuit urban plan. The Jesuits congregated thousands of Guarani in spatially compact villages. They had rows of structures built with multiple small apartments to house Guarani families. Living as they did in close proximity to each other also facilitated the spread of contagion. The fully developed mission complex at Yapeyú was typical of the mission urban plan.
The general pattern described above characterized the demographics of the Jesuit missions among the Guarani, but at the same time there was variation in patterns of the individual missions. For example, some mission communities experienced catastrophic epidemic mortality during epidemic outbreaks, while neighboring communities did not. For example, San Lorenzo mission, located east of the Uruguay River, experienced a crude death rate of 557 per thousand population during a particularly lethal smallpox epidemic in 1739, while the crude death rate at neighboring San Miguel and Santo Ángel Custodio missions was only 32.2 and 52.4 per thousand population respectively. The populations of the two missions continued to grow during a period of catastrophic mortality in other communities. Nuestra Señora de los Reyes Yapeyú mission offers an extreme example of demographic patterns of the missions and is the subject of this article. During the last half century of the Jesuit tenure on the missions, the population of Yapeyú did not experience catastrophic mortality. Rather, between 1720 and 1771, the population experienced robust growth rates and on the eve of the Jesuit expulsion in 1767, Yapeyú was the most populous of the 30 missions among the Guarani.
Source: Bibliothéque Nationale de France, Paris.
Figure 1 A c. 1753 diagram of San Juan Bautista mission that shows a typical mission urban plan. Title: Pueblo de San Juan que es uno de los del Uruguay que se intentan entregara Portugal.
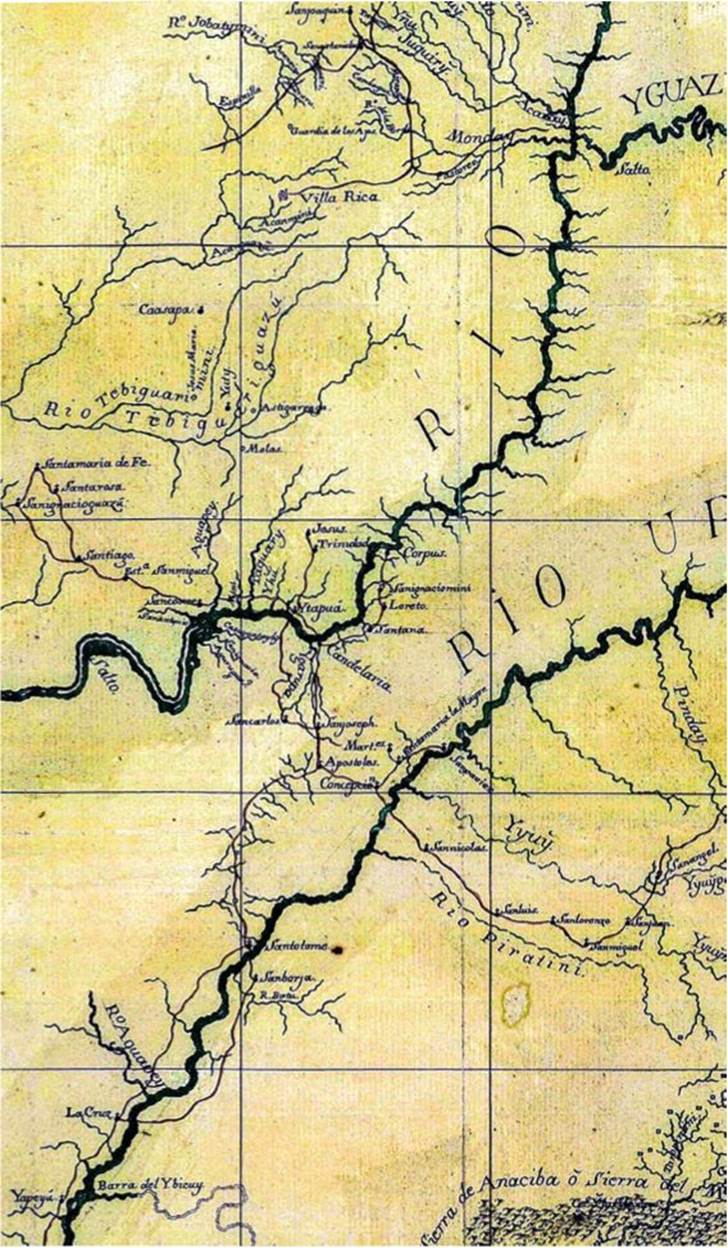
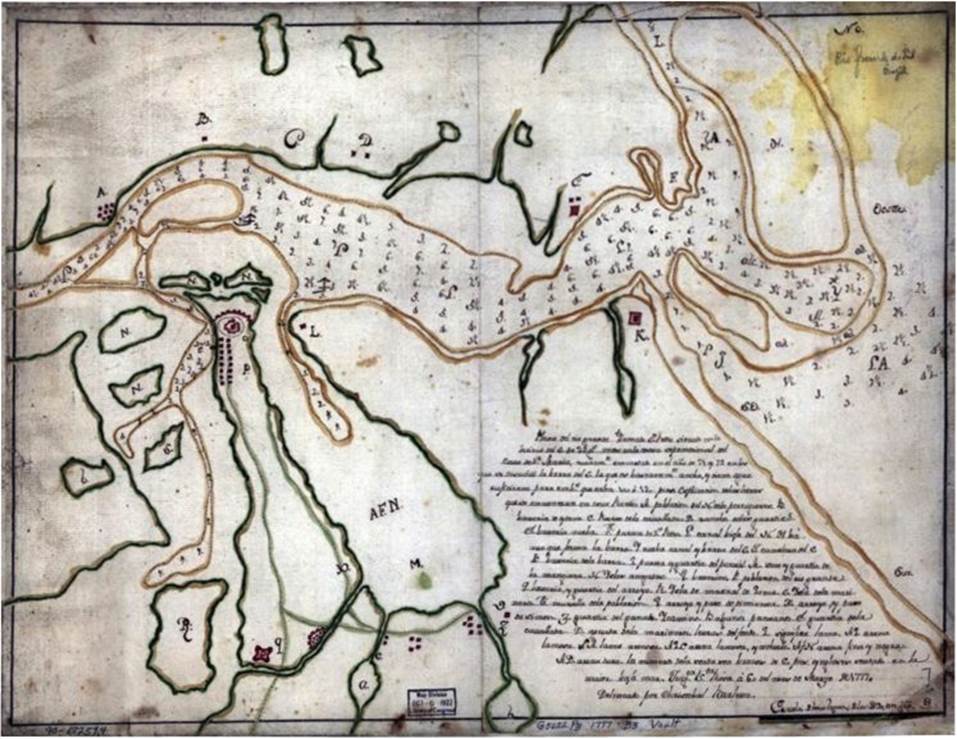
Source: Plano corografico de los reconocimientos pertenecientes a ia demarcación del Art. 80. del Trato. Preliminar de Limites de 11 de octe. De practicados por las segundas subdivisiones española y portuguesa en orden a desatar los dudas suscitadas entre sus respectivos comisarios: region of Panará River and Uruguay River. [178-?, 1780] Map. Retrieved from the Library of Congress, www.ioc.gov/item/2003682610/.
Figure 3 Detail of a contemporary map showing the location of the Jesuit missions and the Paraná and Uruguay Rivers.
The mission also had a fully developed urban complex similar to that of other missions. An undated and unsigned document and diagram found in the Archivum Romanum Societatis lesu depicted the typical urban plan of the Jesuit Guarani missions, and the document also described the types of structures and construction materials of the different buildings (ARSI, Dibujo de un Pueblo)2. The document described the churches as being large structures that generally measured 70-80 varas (1 vara = .0864 meter)) in length, and 26-28 in width, and in some cases 90 x 30 varas. Most had three naves, whereas the church at Concepción had five naves and was 86x40 varas. They were built of stone or a combination of stone and adobe with one to two varas of stone construction, as in the case of the San Juan Bautista mission church. The monumental church dominated the mission complex and fronted on the plaza or main square. The square was the center of communal life, and the document reported that the plaza generally was 160 square varas. The streets in the mission community reportedly were 16-18 varas in width. Other architectural elements included the colegio complex with residences for the Jesuit missionaries, a kitchen, storerooms, and workshops. Adjoining the church there was generally a free-standing bell tower and cemetery divided into four sections for the burials of men, women, boys, and girls (ARSI, Dibujo de un Pueblo)
There was also the cabildo and housing for the Guarani which usually consisted of long barracks-like structures with multiple small apartments. The Jesuits congregated thousands of Guarani and the spatially compact mission villages had a high population density. The same document described housing in general terms, which was generally not built with the same quality as other structures in the complexes. In some cases, as at Trinidad and San Ignacio Mini, housing was built of stone. Others had stone walls to a height of about a vara, and the rest adobe. They had stone or wooden columns to support the tile roofs with overhangs that protected the walls from rain and provided shade. The document reported that the apartments were generally three varas wide. A comment below the diagram suggests that the author may have based the diagram on information from the Joint Boundary Commission of the late 1750s. (ARSI, Dibujo de un Pueblo).
A second document written by Jaime Oliver, S.J. at about or shortly after the Jesuit expulsion described the Yapeyú mission church and provided general information on the demographic patterns of the missions. At the time of the Jesuit expulsion, Oliver was at La Fe mission located today in what is southern Paraguay. He was born in Palma (Mallorca) in 1733 and arrived at the Guarani missions in about 1750. In 1755 he was in Montevideo, but then returned to the missions. He survived the trip into exile, and died in Rome in 1813, one year before the restoration of the Society of Jesus (Storni 203). Oliver merits attention because he wrote a description of the missions in about 1768 that recorded many details including numbers related to the demographic patterns of the missions. He also wrote about high infant mortality and offered an explanation of how an eighteenth-century cleric came to grips with the deaths of many young children. Finally, he described the Yapeyú mission church. He noted that, “La [iglesia] del Pueblo de Yapeyú es capaz como p[ar]a 7974 almas q[u]e tiene el Pueblo/The [church] that the Pueblo of Yapeyu has is adequate for the 7974 souls the Pueblo has.” The figure 7,974 was the population in 1767 (Oliver, Breve Noticia).
Oliver apparently had access to internal documents. He reported that between 1610 and 1766, the Jesuits had baptized 702,786 natives, and in 1768 the total population of the 30 Guarani and two Tarima missions was 92,641. The Jesuit also noted that in the 51 years between 1717 and 1768, 186,375 young children classified as párvulos had died. He took solace in the belief that the baptized children went to heaven. Oliver wrote, “From that said it can be inferred that if in 51 years 186,375 [young children] flew to Heaven with the grace of baptism, in the 105 previous years how many thousands of thousands of párvulos ascended to Glory” (Breve Noticia 207). The Guarani mission populations suffered chronically high infant mortality exacerbated by periodic catastrophic epidemic mortality. Nevertheless, despite the pattern of high infant mortality, the mission populations grew because more children survived than died. Geography played an important role in the spread of contagion, and the mission urban plan, with thousands of people living in a restricted space, further facilitated the spread of contagion.
Sacramental registers of baptisms, marriages, and burials are useful in reconstructing the vital rates of historic populations. However, these records on the missions among the Guarani have largely disappeared because the region of the missions became a war zone in the two decades following the beginning of the independence movement in 1810, and marauding armies destroyed most of the missions. Nevertheless, other sources can be employed in the reconstruction of the vital rates of mission populations such as censuses that summarized the number of baptisms, marriages, and burials. During the eighteenth century, the missions among the Guarani were closed populations which meant that the Jesuits no longer congregated non-Christians on the missions, and the Jesuits distinguished between baptized infants and the small number of non-Christians congregated on the missions.
In the second half of the seventeenth century and the eighteenth century, Jesuit censuses and other records evolved, and by the 1720s took standardized form. The Jesuits prepared an αnuα or report for each mission that was in turn sent to the head of the missions who had a general report prepared. The most complete, consecutive record of these reports exists for Yapeyú, and are found in the e Coleção De Angelis, Biblioteca Nacional, Rio de Janeiro, Brazil. In the seventeenth century, the missionaries did not always provide complete information in their reports, such as the population or the number of sacraments administered. In 1678, for example, the report on Yapeyú did not include the size of the mission population. During most of the seventeenth century, the reports were prepared in a narrative format and included demographic information. It was not until the 1690s that the reports also included tables that summarized population data, and it did not become standard practice until the early eighteenth century. In some instances, the Jesuits prepared separate reports on the Paraná and Uruguay missions among the Guarani, and in some cases neither have survived. This occurred, for example, in 1705, 1711, and for several years in the 1690s, such as 1695. Nevertheless, the available sources allow for the reconstruction of the vital rates and demographic patterns of Yapeyú. It was common during the early modern period for people to try to avoid being enumerated in censuses prepared for tax purposes, or to identify men for military service, or to avoid paying clerical fees for the administration of the sacraments, or to refuse to visit the official state-sanctioned church because of religious dissent. None of these factors contributing to under-registration in sacramental records or censuses were important in the Jesuit mission censuses.
Demographic Patterns of Nuestra Señora de los Reyes Yapeyú Mission
The Jesuits established Nuestra Señora de los Reyes de Yapeyú on the banks of the Uruguay River in 1627. During the course of the seventeenth century, the population of the mission stagnated and experienced low growth rates. The Jesuits initially congregated Guarani speakers known as Charrúas, but in later years resettled non-Christians from non-Guarani groups. For example, in the years 1665-1666, the Jesuits congregated some 250 non-Christians at Yapeyú, and some 500 Yaros around 1701. In 1647, the population was 1,600 and this grew over the next four decades to 2,477 in 1682. The numbers dropped to 1,865 in 1691, most likely as a consequence of an epidemic. The mission population dropped following a severe 1718-1719 smallpox epidemic. The mission population dropped from 2,873 in 1717 to 1,871 in 1719, a net decline of some 1,000. In the aftermath of the epidemic, the Jesuits transferred the population from San Francisco Xavier mission to Yapeyú. The Jesuits relocated some 2,400 people, most likely in 1722 or 1723. The population of Yapeyú increased from 1,871 in 1719 and 1,856 in 1720 to 4,352 in 1723 and 4,360 in 1724. The population of San Francisco Xavier, on the other hand, suffered light mortality during the epidemic. It was 5,600 in 1717, dropped to 5,352 in 1719, and 5,280 in 1720. It dropped further to 3,409 in 1724 following the population transfer (Jackson, Demographic Change 90-91). The Guarani from San Francisco Xavier retained their separate identity in their own clans, which the Jesuits enumerated separately from the clans of the original population of Yapeyú (AGN, Yapeyú Tribute Census, c. 1759).
The population of the mission grew during the 1720s and 1730s, and did not experience heavy epidemic mortality during the mortality crises of the 1730s and particularly the 1737-1740 smallpox outbreak. Some 90,000 Guarani died between 1733 and 1740 as a result of disease and famine conditions. The relative geographic isolation of Yapeyú mission permitted the Jesuits to implement effective quarantine measures, and thus isolate the mission from outside contact to prevent the spread of contagion. While the populations of the other missions experienced periodic epidemic mortality, the population of Yapeyú grew over the next half century, which was a distinct pattern from most of the other missions.
There is a continuous record of baptisms and burials between 1723 and 1754 showing that the Jesuits baptized 12,886 against 8,545 burials, a net difference of 4,341. The population grew from 4,352 in 1723 to 7,997 in 1756. In the eight years between 1756 and 1767 for which there is a record, the Jesuits baptized another 3,421 against 3,124 burials, a net difference of 297. The population totaled 7,974 in 1767 and 8,510 in 1768 (see Table 1) (Jackson, Demographic Change 91). The increased mortality during this period was most likely a consequence of troop movements, the movement of people following the implementation of the Treaty of Madrid, and the suppression of an uprising on the seven missions located east of the Uruguay River, as well as troop movements during the ongoing conflict for control of Rio Grande do Sul. However, the population of Yapeyú did not suffer catastrophic mortality during the severe 1763-1765 smallpox outbreak.
Epidemics did occur at Yapeyú in the last half century of Jesuit tenure but did not reach catastrophic levels as at the other missions. Royal officials mobilized thousands of mission militiamen in the early 1730s, and an epidemic spread to the missions in 1732-1733 from the militia camp located on the Tebicuari River. In 1732,476 died at Yapeyú (crude death rate of 84 per 1,000), and 733 in 1733 (crude death rate of 128.5). In contrast, 1,192 died at San Ignacio Guazú (crude death rate of 324.7), 2,678 at La Fe (crude death rate of 396.4), and 2,263 at Santa Rosa (crude death rate of 414.6) (Jackson, “La población”). These were the missions located closest to the militia camp. A second was the 1748-1749 measles epidemic on the missions that first broke out on Santa Rosa mission which suggests transmission from Asunción. It was also a milder epidemic when compared to the 1737-1740 smallpox outbreak. The Jesuits recorded 545 burials at Yapeyú in 1749 (crude death rate of 81) and 249 burials at Santa Rosa in 1748 (crude death rate of 195.8). The largest numbers of deaths were at Santiago where 1,003 died in 1749 (crude death rate of 216.5), 657 at San Miguel (crude death rate of 95.2), 454 at La Cruz (crude death rate of 176.3), and 430 at San Nicolás (crude death rate of 101.3). The crude death rate also exceeded 100 per thousand population at Ytapúa, Trinidad, and San Carlos (Jackson, “La población”).
At the point of the Jesuit expulsion in 1767-1768, Yapeyú was the most populous Jesuit mission. The population was 7,974 in 1767 and 8,510 in 1768. However, it was a population that was extremely vulnerable to contagion, and particularly to smallpox. It had been two generations, or a total of 49 years since the last catastrophic smallpox outbreak on the mission in 1718. Two generations had grown with little or no exposure to the malady. The last measles epidemic had been a generation before in 1749. The civil administration that replaced the Jesuits stressed the production of income to cover the costs of administration, which also meant greater contact with the larger region and less concern for protecting the population of the mission from contagion. The implementation of the so-called “comercio libre,” or freer trade within the Spanish trading system, created new opportunities for the Río de la Plata region. One such opportunity was the export of hides and tallow to Spain. Hide exports totaled 177,656 in the years 1768 to 1771 and increased to 1,258,008 in the years 1777 to 1784 (Jackson, Missions 155). Yapeyú was a major producer of hides, and civil administrators had the mission herds culled for hides and tallow. The large-scale slaughter of cattle was reflected in drops in the number of animals reported in mission inventories. At the time of the Jesuit expulsion, Yapeyú counted 62,679 head of cattle, but this number decreased to 34,508 in 1778. The number of cattle grew with the replenishment of the mission herds from the large number of feral animals in the Banda Oriental. In January of 1779, for example, the civil administrator of Yapeyú contracted Estevan Garcia de Zuñiga to round up feral cattle for the mission, paying four reales for each animal (BN, García de Zuñiga et al.). The mission counted 72,800 animals in 1783. As the export of hides grew in the 1780s and 1790s, the civil administrators culled the Yapeyú herds. In April of 1790, the mission counted 70,436 head of cattle on three estancias and 76,000 in September of the same year, which grew to 80,000 in 1794, and then dropped to 68,000 in 1796 on six estancias, 14,021 in 1800, and 4,273 in 1804 (BN, Lauro Núñez; BN Simón de León; Sarreal 210).
There were ongoing troop movements following the Jesuit expulsion as Spain and Portugal contested control over Colonia do Sacramento and Rio Grande do Sul, particularly in the 1770s up to the signing of the Treaty of San Ildefonso in 1777. The movement of troops helped spread contagion (see Figures 8 and 9). The result was a particularly catastrophic epidemic in 1770-1772 that killed some 5,000 Guarani and that had a crude death rate in excess of 600 per thousand population. The mission population dropped from a reported 8,510 in 1768 to 3,322 four years later (see Table 1). A detailed 1771 tribute census (see Table 2) documented the profile of the population of Yapeyú during the lethal smallpox epidemic. In non-epidemic years, the mission populations evidenced large families and large numbers of families with more than two children. However, the 1771 census showed that 39 percent of the couples had no children and 46 percent only one or two children which, if the pattern had persisted overtime, would have resulted in merely maintaining population levels or a slow decline. This profile indicates that many children died during the outbreak. The number of orphans was also high: 442 male and 398 female children. There was one other indicator of the consequences of heavy smallpox mortality, which was the number of those widowed: 278 widowers and 101 widows. This pattern was unusual because in non-epidemic years, the number of widows outnumbered widowers, and men frequently remarried following the loss of a spouse. The smaller number of female orphans and widows also reflected higher mortality among women and girls which was a consequence of the TH-2 Immunological response. The Immunological response of females to diseases such as smallpox and measles Is different than that of males and contributes to higher mortality among females. Higher mortality among girls and women also led to shifts In the gender structure of the mission populations (Jackson, Demographic Change 82-83, 91-92).
Source: Barletta, Christobal. Plano del Rio Grande tilamado Sn. Pedro situado en la latitud del S. de 23 gs. más en la costta septemtrional del Cauo de Sa. Maria, nuebamte. emmedado en el año de 71 y 72 en losque se descubrió la barra del S. la que es bastantemte. ancha y tiene agua suficientte para embs. que calen 10" o 12" pies. [1777] Map. Retrieved from the Library of Congress, <www.loc.gov/item/90682594/>. Call Number G5622.P3 1777. B3, Library of Congress Geography and Map Division, Washington, D. C. In the public domain.
Figure 8 A 1777 map of the central part of Laguna de los Patos showing settlements and fortifications. This was the arena of conflict in the 1760s and 1770s.
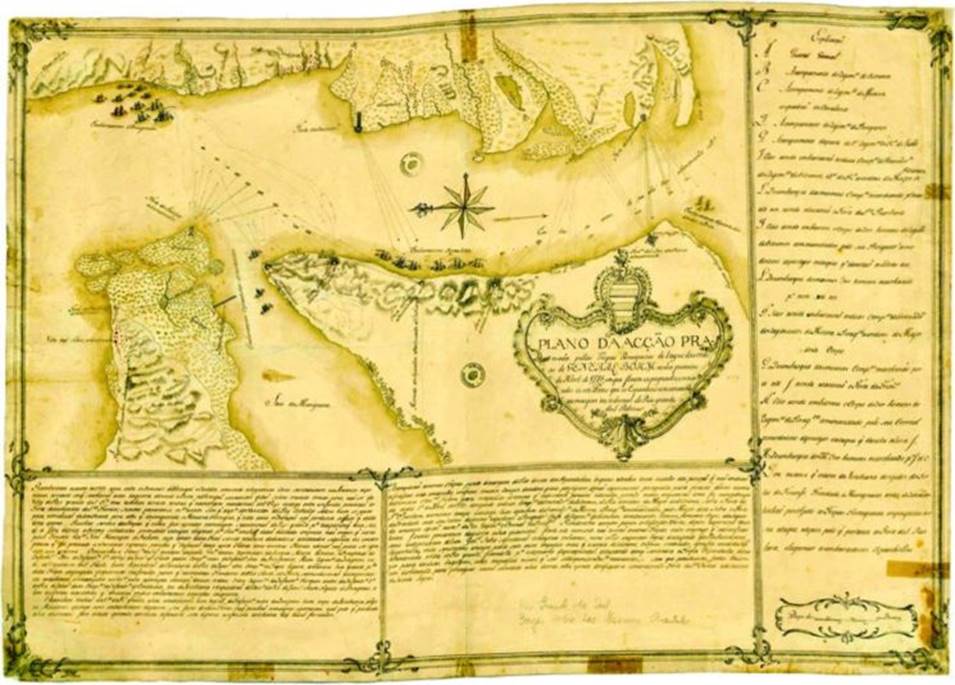
Source: http://bibliotecadigital.bibna.gub.uy:8080/jspui/handle/123456789/5051
Figure 9 A contemporary Portuguese map of the attack of April 1,1775 on Spanish positions in the Laguna de los Patos region. Plano de accao practicada pellas tropas Portuguezas de bayxo das ordens do General Bohm no día primeiro de abril de 1775 em que foram expugnados, e evacuados os sete fortes que os Espanhoes conservarao na margen meredional do Río Grande de S. Pedro. Retrieved from Biblioteca Nacional de Uruguay, 1776.
The population recovered following the epidemic and increased to a reported 4,739 in 1784 and 5,170 in 1793. There is a record of a second epidemic during the period of civil administration. Burials totaled 777 in 1797 (crude death rate of 172.3 per thousand people). This was the highest death rate on the ex-missions for which there is a record (Jackson, Demographic Change 164-165). The population dropped to 3,990 at the end of 1797, but then increased again to 4,095 in 1799, and 4,669 in 1802 (Jackson, Demographic Change 198). Large scale out-migration was also a factor in population changes in the post-expulsion period.
Gender Structure of the Mission Population
The general mission censuses provide data to calculate a gender structure in broad terms of females as a percentage of the total population. Although there was variation between missions, most missions evidenced a pattern of more women and girls than men and boys. Yapeyú mission provides a typical case study (see Table 3 and Figure 10). In a sample of 33 years, females constituted the majority, as high as 56 percent prior to the Jesuit expulsion and 58 percent following the expulsion and the exodus of Guarani from the missions. The survival of women and girls, even in years of catastrophic mortality, ensured a large enough pool of potential brides, and was an important factor in recovery following mortality crises and growth in non-crisis years. The sex ratio of men to women became greater following the Jesuit expulsion in 1767, and a pattern of migration from the mission in which more men left than women.
Contemporary native populations living on missions on other frontiers of Spanish America evidenced gender imbalances that were a significant factor in population decline. This was particularly the case in populations of nomadic hunters and gatherers congregated on missions that proved to be demographically fragile. Extreme cases can be seen in the missions of Baja and Alta California. In some cases females constituted less than half of the total population, and as little as a third of the population. At Santa Cruz mission in California, for example, the Franciscan missionaries baptized 1,133 females between 1791 and 1832. In the latter year, only 87 women and girls survived on the mission out of a population of 284, or only 31 percent of the total. Mortality was particularly high among women of childbearing age, and by the 1820s and 1830s there was a very small pool of marriage partners, birth rates were low, and infant mortality rates were extremely high. The gender imbalance was generalized throughout the Baja California and California missions, particularly once the missionaries had largely completed the resettlement of surrounding native populations to the missions that had replenished their population during periods of active congregation (Jackson, Indian Population 108-116). When the number of non-Christians brought to live on the Baja California and California missions dropped, the inviable mission populations declined in numbers. Although mortality rates were high among infants and children living on the Paraguay missions, enough children survived to adulthood to form their own families and have their own children. Moreover, children under age ten constituted a relatively large percentage of the total population. In contrast, native populations living on the Baja California and California missions evidenced age imbalances, and few children survived to adulthood as high mortality wiped out each succeeding generation. At Santa Rosalia de Mulegé mission in Baja California, for example, less than 10 percent of a sample of 143 children born on the mission between 1771 and 1821 survived to age ten. Some 50 percent died before reaching their first birthday, and another 33 percent of the total died between age one and five (Jackson, “Demographic Patterns” 95).
Age Structure
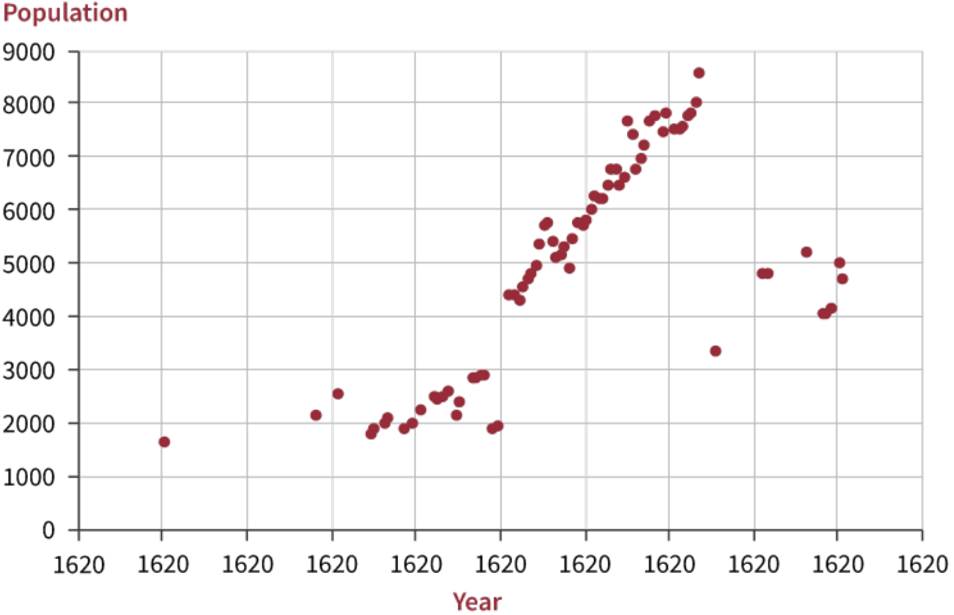
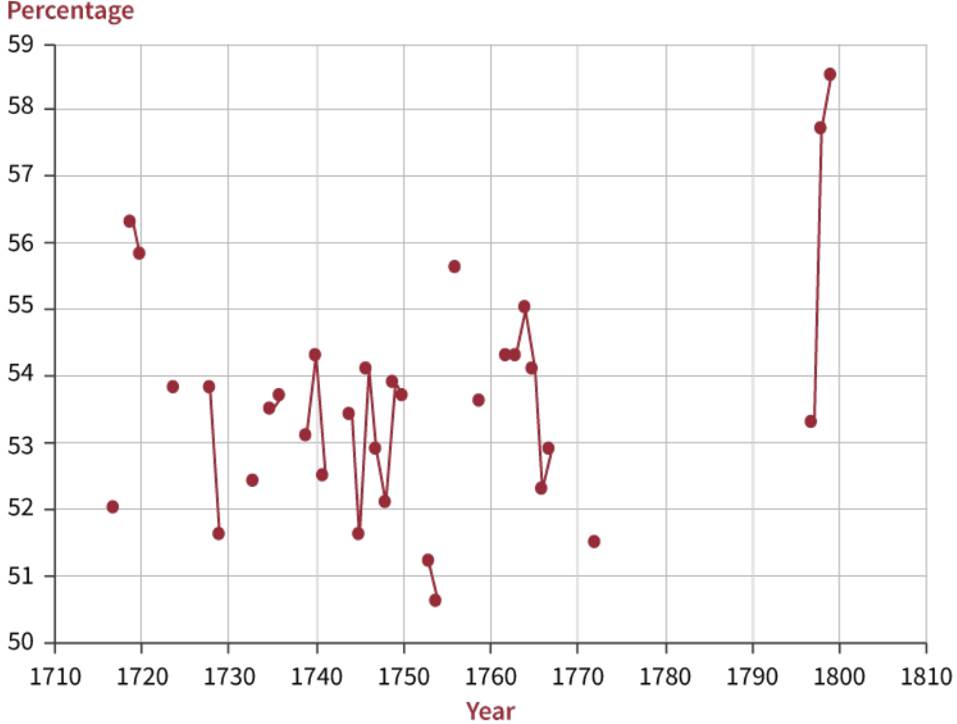
The Jesuit mission censuses recorded broad age categories for the Guarani mission populations. One category was párvulo which identified young children up to the age of nine or ten. The censuses written in Latin used the terms pueri (boy) and puella (girl), which corresponded to the term párvulo. The mission populations were characterized by robust birth rates and large numbers of children. One way of showing this is the number of pueri and puella as a percentage of the total population (see Figure 11)
Source: Made by the author
Figure 11 Children as a Percentage of the Total Population of Yapeyú Mission.
In non-crisis years, young children constituted a low of 28 percent to a high of 41 percent of the population of Yapeyú mission. The effects of epidemics on the age structure can be documented. For example, large numbers of young children died during the lethal 1718-1719 smallpox outbreak. In 1717, young children constituted 33 percent of the population. This dropped to 17 percent in 1719 and 14 percent in 1720. In total numbers, this was a decline from 951 in 1717 to 308 in 1719, and 261 in 1720. In the same years, the mission population dropped from 2,873 in 1717 to 1,871 in 1719, and 1,886 in 1720. The same occurred asa result of a measles epidemic in 1748-1749. In 1747, young children numbered 2,678 or 40 percent of the population. The total mission population dropped from 6,741 in the same year to 6,301 at the end of 1749. Measles mortality was heaviest among pueri and puella. The number of young children declined to 1,760 in 1749 or 28 percent of the total (see Table 4). Moreover, in most years burials of párvulos constituted the vast majority of total burials, and in a number of years were in excess of 80 percent of total burials. In crisis years, burials of párvulos also accounted for as many as a quarter of the total number of young children at the end of the previous year (see Table 5). However, high birth rates in non-crisis years contributed to the rebound or recovery of the population.
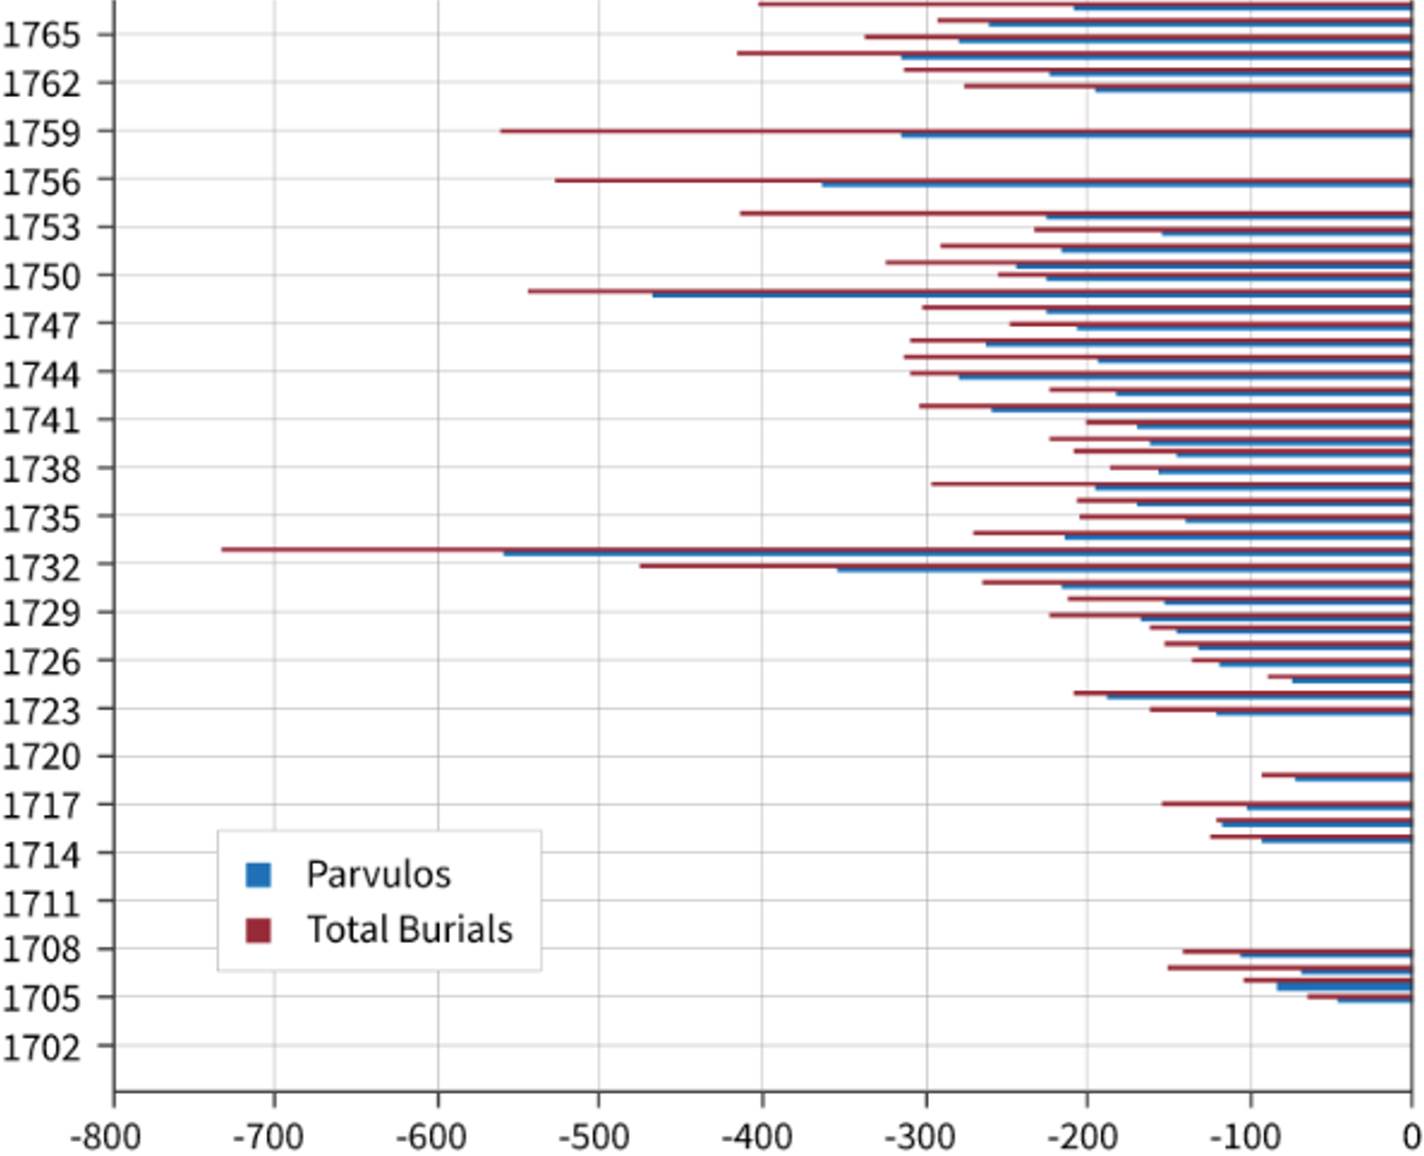
Source: Made by the author
Figure 12 Burials of Párvulos and Total Burials Recorded at Yapeyú Mission.
The pattern at Yapeyú stands in marked contrast to other populations such as the missions of Baja and Alta California on the northwestern frontier of New Spain (Mexico), which had a different demographic profile. The indigenous populations of Baja California were hunters and gatherers who lived in small bands that exploited food resources in a specific territory. The indigenous populations of California did not practice agriculture as did the Guarani but had a more stable subsistence base from the exploitation of acorns as a staple, and well-developed trade between groups that exploited different food resources. In the case of the older Jesuit missions in Baja California, for example, populations were closed and by the end of the eighteenth century had been greatly reduced in size. As noted above, there was a pattern of chronic infant and child mortality rates, and young children classified as párvulos constituted a small percentage of the mission populations. Data for the years 1795-1798 shows that in the case of Loreto mission (established in 1697) children constituted between 18 and 21 percent of the population, at San Francisco Xavier (established in 1699) between 26 and 22 percent, and at Mulegé (established in 1705) 24 to 30 percent. The extreme case was Comondú (established in 1708) with a range between five and nine percent of the total population. More recently established missions such as San Fernando (established in 1769) and Santo Domingo (established in 1775) showed different patterns. By the late 1790s, San Fernando was already a closed population in decline, and the percentage range of young children in relation to the total population was between 18 and 24 percent. Santo Domingo still had an open population as the Dominican missionaries continued to congregate non-Christians on the mission, and young children constituted between 30 and 31 percent of the total population (Jackson, Indian Population 112).
The Alta California missions passed through stages of active congregation of non-Christians and the expansion of the size of the mission populations, as well as periods of minimal or no resettlement of non-Christians and decline of the mission populations. Data for the years 1789,1796,1810, and 1832 document the shifts in patterns related to the number of children classified as párvulos in relation to the total population, and in the context of high infant and child mortality. The first example is San Carlos (established in 1770). Young children constituted 27,21,12, and 12 percent of the total population respectively during those four years. In San Luis Obispo (established in 1772), it was 26,14, 11, and 6 percent, and in Santa Barbara (established in 1786), 29,14,22, and 15 percent. Santa Cruz and Soledad, both established in 1791, showed high percentages during the congregation of non-Christians and a later decline. In the first instance, it was 30 percent in 1796, 8 in 1810, and 11 in 1832. For Soledad, it was 41,16, and 17 percent respectively (Jackson, Indian Population Decline 114).
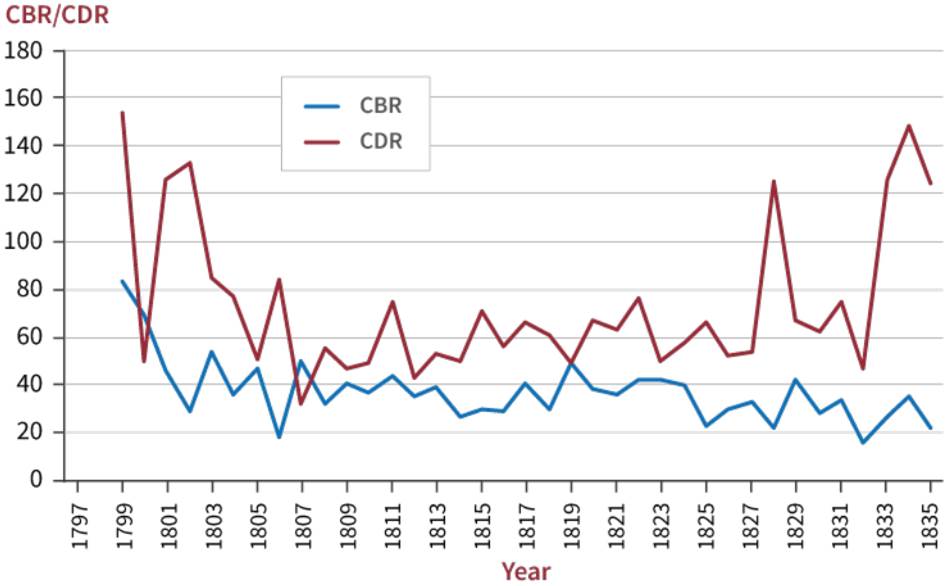
When compared to that of Yapeyú and the other missions among the Guarani, the Baja and Alta California mission populations were demographically fragile and unstable, and experienced chronically high infant and child mortality rates that prevented the populations from reproducing themselves through natural reproduction. These were populations that declined over time, although the pattern of decline was far more complicated and with considerable variation between missions than would have been allowed for under the interpretations of scholars such as Crosby and Dobyns. A recent study of mortality among the indigenous populations priorto and following the Spanish occupation of the region after 1769 concluded that, “A comparison of pre- and post-contact age-at-death records does not support the long-standing circumstantial case for severe disease induced Indigenous population decline in central California before AD 1770” (Jones, et al. 3). In non-epidemic years, birth rates on Yapeyú were consistently higher than death rates, and the population experienced growth (see Graph 6). In contrast, the indigenous populations congregated on the California missions experienced chronically high death rates that were higher than birth rates. This can be seen in the cases ofthe birth and death rates on three missions, San Francisco, Santa Cruz, and San Miguel (see Graphs 7-9). This finding directly challenges the assumptions made by Crosby and Dobyns. In contrast, the populations of Yapeyú and other Jesuit missions among the Guarani grew robustly in non-crisis years and rebounded or recovered following epidemics and other mortality crises.
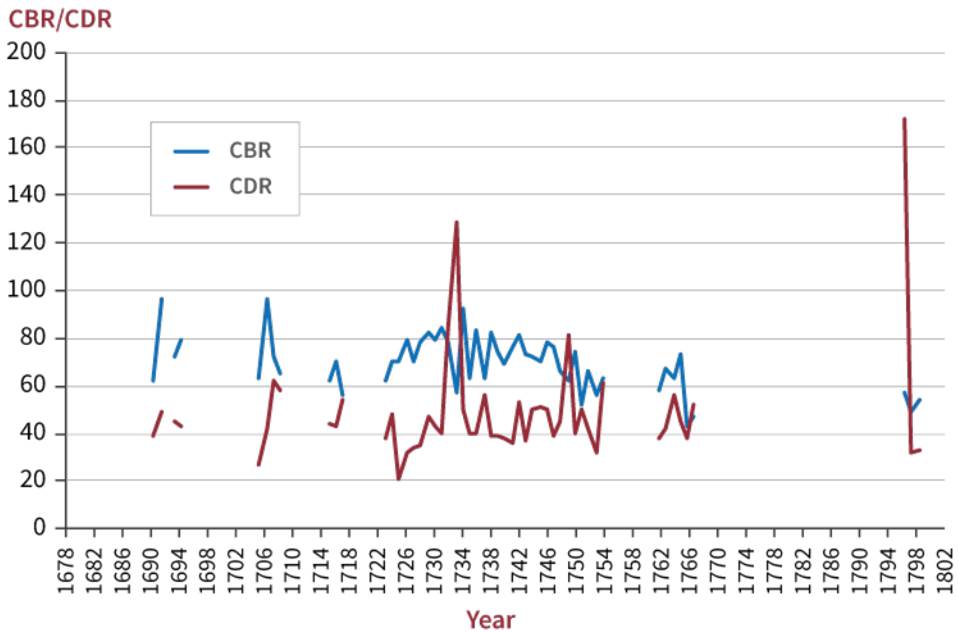
Source: Made by the author
Figure 13 Crude Birth (CBR) and Death (CDR) Rates Per Thousand Population at Yapeyú Mission.
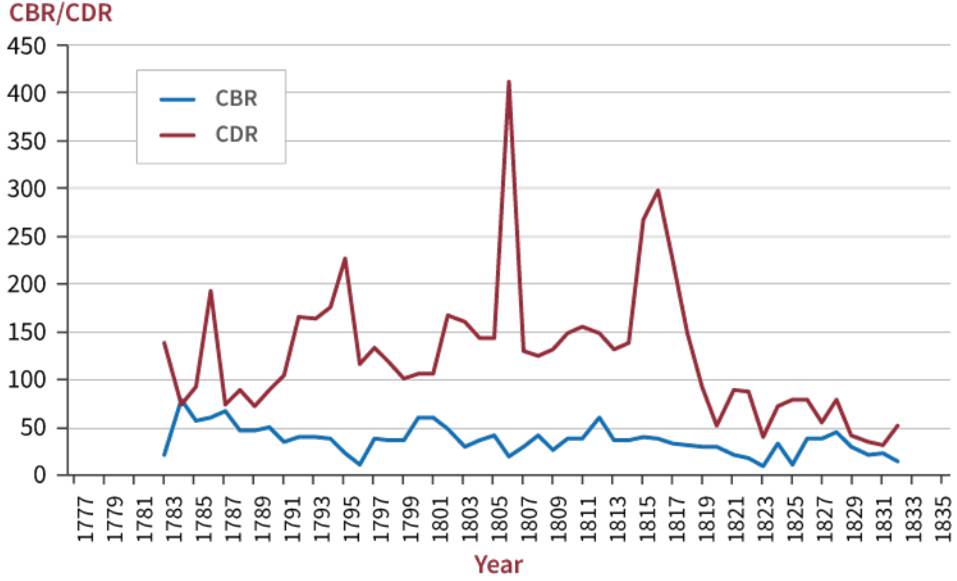
Source: Made by the author
Figure 14 The Crude Birth (CBR) and Death (CDR) Rate Per Thousand Population at San Francisco Mission.
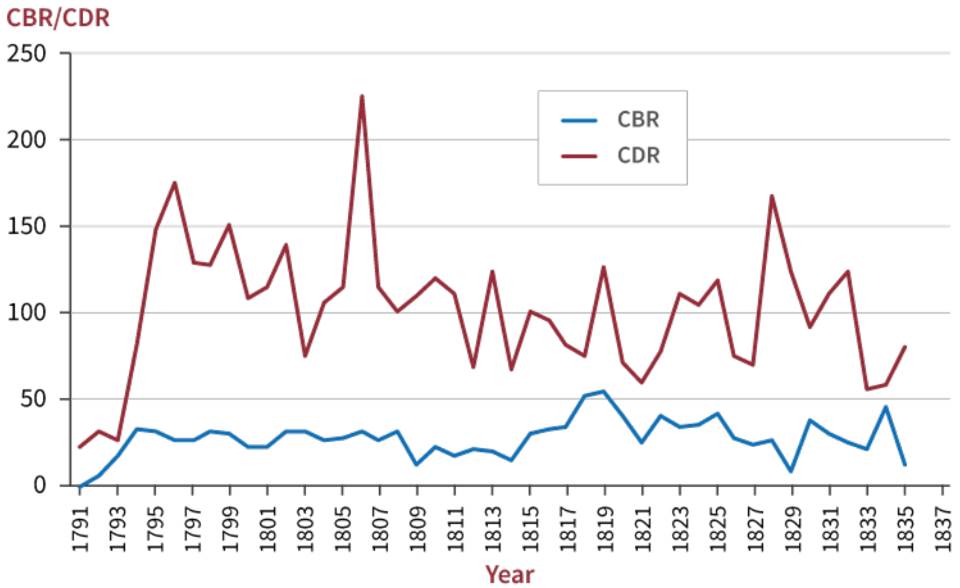
Source: Made by the author
Figure 15 Crude Birth (CBR) and Death (CDR) Rate Per Thousand Population at Santa Cruz Mission.
The Post-Jesuit Expulsion Diaspora
Following the Jesuit expulsion in 1767, royal officials created a civil administration on the missions. The expectation was that the mission residents would contribute to the generation of income to cover the costs of administration in line with the Bourbon initiative to make administration more efficient and the missions self-sufficient. However, the Jesuit expulsion also led to a diaspora, as many Guarani voted with their feet to reject the new order and take advantage of new economic opportunities in the region. However, the mission residents, according to Spanish law, were still legally tied to the missions until such time as they might be legally emancipated. As such, those who left were considered fugitives, and royal officials attempted to have them returned. This is not to say that there weren’t instances of fugitiveness prior to the Jesuit expulsion. In 1735, for example, during a famine that followed crop failures, thousands of mission residents fled, and some organized a community near Lake Iberá that paralleled the social-political organization of the missions. A1735 census of tributaries enumerated a total of 19,116 on the missions of whom 3,094 were absent (Jackson, A Population History 45).
Post-expulsion censuses recorded the absence of mission residents, and in some instances the places to which they had migrated. A series of detailed 1799 mission censuses enumerated the number of Guarani present on the missions, and those who had fled. The censuses often missions found 13,217 present and 8,301 absent. Corpus Christi mission was one that reported a large number of absent Guarani. The 1799 census reported 2,287 present and 1,671 absent. The census also provided information to identify the profiles of those who left the mission. Of those absent, 65.8 percent were men and boys. This was the general profile found in all ten of the missions for which censuses exist. In other words, it was more common for men and older boys to leave, most likely to enter the labor force, and more women and younger children to remain on the missions (Jackson, Demographic Change 172-174)3. This, in turn, contributed to a greater gender imbalance in the populations that remained on the missions.
A series of censuses for Yapeyú from the late 1790s document the flight of mission residents and efforts to return fugitives. The censuses listed two categories of information. One was the number of mission residents who had fled during the year, and the second the number of fugitives returned. Smallpox broke out at Yapeyú in 1797 and continued into the following year. It was not uncommon for indigenous folk to flee epidemic outbreaks, and this appears to be the case in 1797 and 1798 (see Table 6). In the first year, 82 men and 48 women left the mission, and 53 men and 43 women in 1798. The exodus continued in 1799. A smaller number left that year, 28 men and 20 women. Officials attempted to get fugitives to return to the mission, but generally with limited success. In 1799,18 men and 10 women returned to the mission, but this was the only instance over the three years. Fugitives from Yapeyú and the other missions went to different parts of the Rio de la Plata region. One 1790 document, for example, reported the number of fugitive Guarani in the jurisdictions of the Villa de Concepción de Uruguay, San José de Gualeguayes, and San Antonio de Gualeguay. There were 32 fugitives from Yapeyú (Jackson, A Population History 56). As González Rissotto argues, the Guarani who migrated or were forcibly relocated to the Banda Oriental in the period of warfare after 1810, and by extension to other areas in the region, formed part of a growing rural labor force (“La importancia”).
Conclusions
The indigenous populations of the Americas experienced dramatic demographic changes in the centuries following the establishment of first sustained contact with the Old World in 1492. An analysis of demographic patterns of the Jesuit missions among the Guarani provides important clues to the nature of changes after 1492. Established nearly a century following the arrival of the Spanish and Portuguese in the region, the mission populations continued to experience catastrophic epidemic mortality. The pattern of mortality suggests that the Guarani had not built up immunities to old world pathogens. Rather, epidemics occurred about once a generation or roughly every twenty years once there was a large enough pool of potentially susceptible hosts born since the previous outbreak. Moreover, the mission populations were not large enough to sustain maladies such as smallpox in endemic form, and epidemics spread to the missions from other communities in the region. This occurred on the navigable rivers, but also through the movement of soldiers on campaign.
The effects of epidemics and demographic patterns on the missions among the Guarani were complex, as evidenced by the case of Yapeyú mission. The population of Yapeyú was a high fertility and high mortality population, and manifested two characteristics in common with the other missions among the Guarani. It had robust birth rates and the population grew through natural reproduction. The population also rebounded or recovered following epidemics. What was unique, however, was that the population did not experience catastrophic epidemic mortality during the last half century of the Jesuit tenure, as did neighboring communities. The Jesuits were able to isolate the mission population, but this also left the mission vulnerable to contagion following the expulsion of the Jesuits in 1767 and the implementation of a civil administration that promoted commerce. A smallpox outbreak in 1771 culled the population, killing some 60 percent of the mission residents.
Other frontier mission populations proved to bedemographically fragile, such as those in Baja and Alta California. They experienced gender and age imbalances, something that did not occur on Yapeyú and other missions among the Guarani. Despite heavy epidemic mortality, the mission populations did not experience gender or age imbalances. Patterns of the missions among the Guarani provide an important corrective to the generally accepted model of post-1492 indigenous demographic patterns in the Americas regarding the effects of epidemic mortality, and particularly the pattern of catastrophic epidemic mortality more than 200 years following sustained contact with Europeans. The specific case of Yapeyú also conclusively demonstrates variations on epidemic mortality between communities that challenge the assumptions about the miasmic spread of pandemics with uniform mortality rates.

