


 Inglês (pdf)
 Artigo em XML
 Referências do artigo
 Enviar este artigo por email
 Citado por SciELO
  Citado por Google
  Similares em
SciELO
Similares em
SciELO  Similares em Google
 Permalink
1. Introduction
Energy is an essential need for humans because it is required to make things work; one of the most important types of energy is electricity, due to its ability to be transported, stored, and controlled. These characteristics make electricity play a key role in the development of other technologies. Electricity can be obtained through the transformation of other types of energy, such as chemical, solar, kinetic, heat, magnetic, among other forms. Solar energy for instance, departs from the Sun and comes to the Earth’s surface with an intensity of 1366 W/m2 (Hough, 2007), where it can be converted to electric energy using solar panels.
The solar resource from a specific area can be calculated through solar irradiance and the solar insolation; these two variables are indicators of the amount of energy coming from the Sun. The solar irradiance is the power that comes from the Sun and is measured on the Earth’s surface (Hulstrom, 1989) in W/m2 and the solar insolation, also known as solar irradiation is the solar irradiance integrated over a period of time and its units are Wh/m2 (Smets, Jäger, Isabella, VanSwaaij, & Zeman, 2016).
Predicting the behavior of solar radiation is important to design photovoltaic systems, because it allows to estimate energy production and to design more efficient systems from a technical and economic perspective. However, the estimation and its efficiency can be affected by the low number of installed measuring stations, a lack of maintenance plans, low traceability of the data over time, or by the types of environmental variables.
This problem has been addressed by various authors and the solutions they provided range from the use of linear and multivariate regression models, to the use of artificial intelligence and machine learning techniques. One of the most popular models used is the Angström-Prescott equation that relates solar radiation to sunshine duration. Paulescu et al. (2016) have reviewed this model from different perspectives such as the physical basis, the model’s accuracy, and sensitivity to geographic and stationary factors. Other studies (Dumas et al., 2015; Yaniktepe & Genc, 2015) have presented new models for estimating solar radiation evaluating variations of the Angström-Prescott model (linear, higher degree, and using different types of functions) and the correlation of global solar radiation and variables such as temperature, precipitation, and relative humidity.
On the other hand, studies have also been made in agriculture or energy production applications across several countries such as China (Wang, Wang, Yin, Feng, & Zhao, 2015), Ghana (Asilevi, Quansah, Amekudzi, Annor, & Klutse, 2019), Tunisia (Chelbi et al., 2015), India (Jamil & Bellos, 2019), and Mexico (Quej, Almorox, Ibrakhimov, & Saito, 2016); in these cases, authors have reported the challenges of predicting monthly variations of solar radiation and how seasonal changes can affect the efficiency of the model; as a solution, they proposed their own empirical models to account for the specific climate conditions of each place. Similarly, the work done by Basaran, Özçift, and Kılınç (2019) in Turkey and the study reported by Noriega-Angarita, Sousa-Santos, Quintero-Duran, and Gil-Arrieta (2016) in Colombia, have combined artificial neural networks with empirical models as an alternative method to improve the accuracy of solar radiation prediction models and overcome these challenges.
In Colombia, the problem of estimating global solar radiation has been studied in various regions of the country. Vélez-Pereira, Vergara-Vásquez, Barraza-Coronell, and Agudelo-Yepes (2015), compared simple and multivariate regression models to estimate solar radiation in Magdalena; their results showed a high correlation between solar radiation, temperature, and humidity; the latter being the one with the highest correlation. Likewise, Urrego-Ortiz, Martínez, Arias, and Jaramillo-Duque (2019) proposed a Markov model to estimate the daily solar radiation in Medellin, obtaining average radiation of 5 kWh/m2; they concluded that solar energy has a great potential in this region. In a recent study, Luna-Carlosama, Jiménez-García, Moreno-Chuquen, and Mulcué-Nieto (2020) applied the Angström-Prescott model in Putumayo; they demonstrated that photovoltaic solar systems could supply up to 33 % of electricity consumption in the Putumayo Amazon Rainforest area, based on 2016 data; to come up with that conclusion, they used temperature and sunshine duration data from the Institute of Hydrology, Meteorology, and Environmental Studies of Colombia (IDEAM) weather stations to estimate the average monthly solar radiation, and then, they calculated the equivalent peak power and maximum annual energy that could be generated from photovoltaic systems.
Norte de Santander is located in the north-east part of Colombia. In that region, IDEAM (Instituto de Hidrología, Meteorología y Estudios Ambientales), has only three weather stations that measure solar radiation, but there are several other municipalities in that department with weather stations that measure sunshine duration. The main goal of this work is to apply the Angström-Prescott model to the three sites where solar radiation is available in Norte de Santander, and then, extrapolate the models to estimate solar radiation across other municipalities in that region.
2. Materials and methods
2.1 Angstrom-Prescott model
The Angstrom-Prescot empirical model uses sunshine duration to estimate solar radiation using a first order linear correlation which is shown in equation (1); it defines the relationship between solar energy available at the ground level and the sunshine duration (Paulescu et al., 2016).
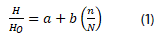
Where: H: Daily solar irradiation on horizontal surface; Ho: Daily extraterrestrial irradiation on horizontal surface; n: number of hours measured by the sunshine recorder; N: maximum daily sunshine duration; a, b: empirical determined regression constants.
This equation establishes a relationship between the sunshine hours and the solar irradiation on a specific point on Earth; this is an advantage in zones where there is not solar irradiation or solar irradiance data as in the Norte de Santander region in Colombia. The parameters Ho and N can be calculated from the latitude and the day of the year, using the equations reported by Almorox, Benito, and Hontoria (2005). The variables H and n are obtained from meteorological stations. The a and b constants can be calculated for a specific place by fitting calculated and measured datapoints of (H/Ho) and (n/N) to equation 1.
With solar estimation models, the calculated solar resource can be used to design photovoltaic (PV) systems; if the solar irradiation data in one geographical point is known, the solar irradiation of surrounding places can be easily calculated by using the constants a and b in equation (1). These constants can be found through the correlation between the solar irradiation and the sunshine hours in a place where solar radiation data is available. After that, the Angström-Prescott equation can be evaluated in another nearby location to estimate solar irradiation. Higher order empirical models have been proposed by Akinoǧlu and Ecevit (1990), but the Angström-Prescott model is simpler and faster to calculate.
2.2 Implementation of the Angström-Prescott model in Norte de Santander
This is a quantitative study developed at Francisco de Paula Santander University in Cucuta, with the goal of obtaining information of the solar resource in the Department of Norte de Santander. The study was made using: R programming language, with the integrated development environment for R called RStudio; the XL-Connect package (Mirai Solutions GmbH, 2017), to load xlsx files; the sfsmisc package (Maechler et al., 2016), to calculate the area under the curve or the daily sun peak hours; and the zoo package (Zeileis & Grothendieck, 2005), to calculate missing values.
All the data analyzed in this work was obtained from IDEAM meteorological stations. A few stations measure solar insolation, while most of the stations measure sunshine duration (also known as sunshine hours). In total, 24 stations that measure the duration of sunlight and 6 that measure solar insolation, were reviewed.
After gathering all the information, we applied two filters to organize and prepare the data. In the first filter, we discarded data from stations which had missing values during long periods of time (months or years); in the second filter, the datapoints with solar radiation values greater than the solar extraterrestrial constant (1366 W/m2) were excluded. After applying the filters described above to the databases of different stations, only the solar radiation stations presented in table 1, remained and were used in this work to obtain the regression coefficients.
Table 1 Solar radiation stations that were selected for this study.
| Location | Station | Coordinates |
|---|---|---|
| Herran | Alcaldia de Herran | 7,50N, -72,49E |
| Pamplona | Unipamplona | 7,38N, -72,65E |
| Cucuta | Francisco de Paula Santander University | 7,90N, -72,49E |
Table 2 describes the raw data provided by IDEAM. Regarding solar radiation, hourly data for different years were obtained, while monthly average data were available for the sunshine duration.
Table 2 Description of the data from IDEAM.
| Location | Solar radiation | Sunshine duration | ||
|---|---|---|---|---|
| Years | Data points | Years | Data points | |
| Herran | 2006-2017 | 37230 | 1989-2002 | 12 |
| Pamplona | 2009-2017 | 30199 | 1979-2012 | 12 |
| Cucuta | 2006-2015 | 73660 | 1979-2012 | 12 |
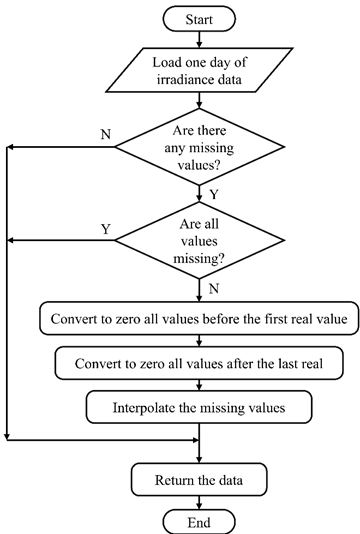
Despite of the filters applied to these databases, some data points of solar radiation were missing; therefore, we used the zoo package to create a function in R to complete the missing values. This function takes the data of every day in the database and tests if there are missing values. If there are not missing data or if all the data is missing, the function ends. If there are some missing data points, the function calculates the first missing values before reaching one real value then fits these values to zero. Then, the function calculates the missing values after the last real value in the day and fits these values to zero. By the end, the function takes the missing values between the real values in the day and uses the function zoo for interpolation. Figure 1 displays a flowchart which describes this function.
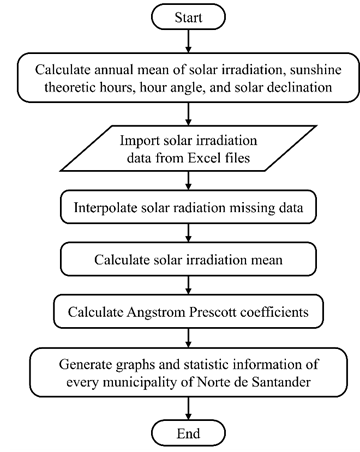
With the database full of real values, the next step is to calculate the Angström coefficients in order to generate the solar insolation information and the graphs with the simulated values. To accomplish this goal, the algorithm shown in figure 2 was developed. Once the Angström-Prescott coefficients are calculated, the solar radiation values are determined through equation 1.
3. Results and discussion
This section shows the results of the linear regression using the Angström-Prescott equation, the solar radiation and sunshine duration data from IDEAM; scatter plots and statistical results of the regression are presented below. First, the equation with the constants is presented for every place listed in table 2, which are the stations with both, solar radiation, and sunshine hours information. Then, the regression parameters are shown and finally an extrapolation of the results is performed, to estimate the solar radiation in locations where only sunshine hours are recorded.
3.1 UFPS meteorological station
Figure 3 shows the regression between the irradiation and the sunshine duration using the Angström-Prescott equation for the city of Cucuta, with the data from the UFPS station.
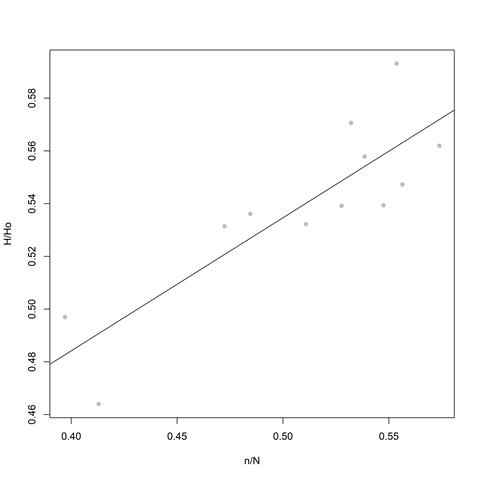
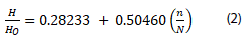
The line in figure 3 is defined by equation 2, and represents the Angström-Prescott equation with its respective constants for the city of Cucuta. To calculate the constants, we used the lm() function in R to perform a linear regression with the data points obtained from the calculations of Ho and N from the equations described by Almorox et al. (2005), and the processing of the meteorological data from IDEAM.
This regression has the statistic parameters shown in table 3.
Table 3 Statistic parameters of the regression for UFPS station.
| Parameter | Value |
|---|---|
| Residual standard error | 0.01838 on 10 degrees of freedom |
| Multiple R-squared | 0.7273 |
| Adjusted R-squared | 0.7001 |
| F-statistic | 26.68 on 1 and 10 DF |
| p-value | 0.0004223 |
The R-squared coefficient of 0.7273 in table 3, indicates a significant linear relationship between the solar irradiation and the sunshine duration. Additionally, the p-value and F-statistic show statistically significant results.
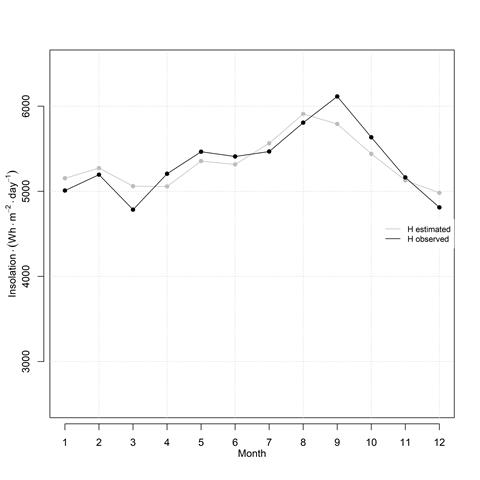
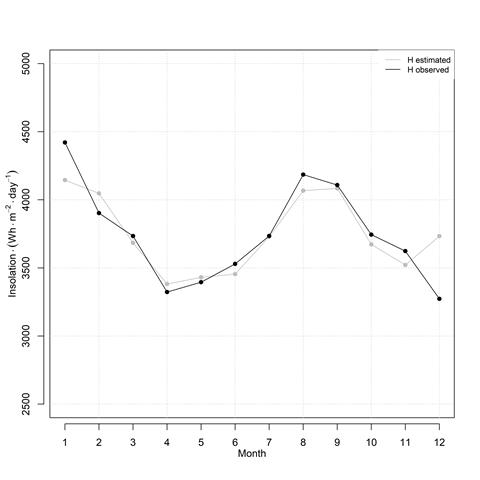
For the UFPS meteorological station, figure 4 displays the monthly solar insolation data from IDEAM and the estimated values obtained with the Angström-Prescott equation. The estimated data points follow the measured data very close, which is consistent with the high correlation coefficient of the regression.
3.2 Unipamplona meteorological station
Next, the regression analysis was performed with data from Unipamplona meteorological station. Equation 3 corresponds to the line shown in figure 5; this line represents the regression between the solar irradiation and the sunshine duration as established by the Angström-Prescott equation. The statistics parameters of the regression, are presented in table 4.
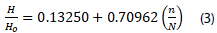
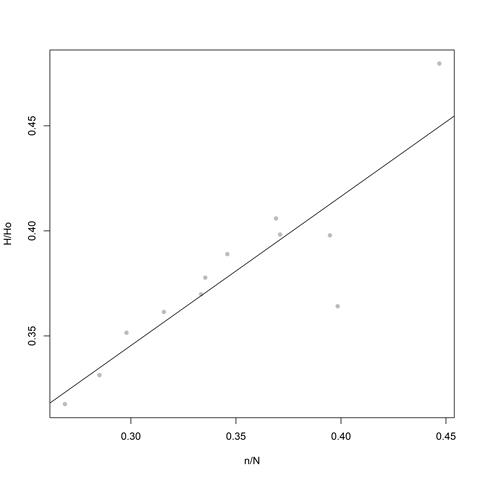
Table 4 Statistic parameters of the regression for Unipamplona station.
| Parameter | Value |
|---|---|
| Residual standard error | 0.02041 on 10 degrees of freedom |
| Multiple R-squared | 0.7818 |
| Adjusted R-squared | 0.76 |
| F-statistic | 35,84 on 1 and 10 DF |
| p-value | 0,0001345 |
From table 4, the R-squared coefficient of 0.7818 demonstrates a strong linear correlation between the solar irradiation and the sunshine duration. Furthermore, the p-value and the F-statistic provide statistical significance to the regression.
Figure 6 is a plot of the monthly solar radiation, where empirical data is confronted with the estimated data from the Angström-Prescott equation. In the plot, the expected and observed data points are very close to each other, which confirms the strong linear correlation between solar irradiation and sunshine hours.
3.3 Herran meteorological station
The regression process with data from the Herran meteorological station, generated the results shown in figure 7. Unlike the previous two analyses, the data points are dispersed from the regression line.
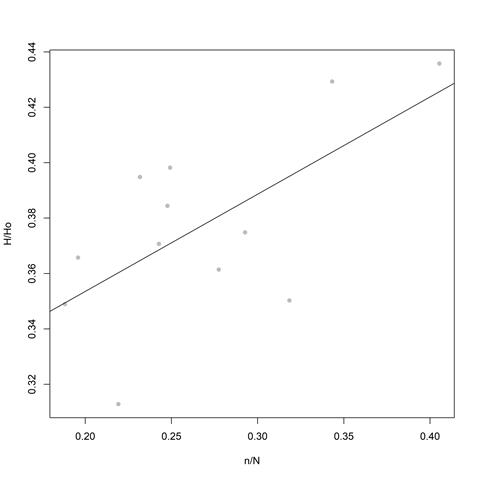
The Angström-Prescott model for Herran, is presented in equation 4. Table 5 displays the statistic parameters of the regression.
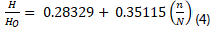
Table 5 Statistic parameters of the regression for Herran station.
| Parameters | Values |
|---|---|
| Residual standard error | 0.02751 on 10 degrees of freedom |
| Multiple R-squared | 0.4201 |
| Adjusted R-squared | 0.3621 |
| F-statistic | 7.243 on 1 and 10 DF |
| p-value | 0.02265 |
Although the R-squared coefficient reflects a moderate fit, the p-value has statistical significance at an alpha value of 0.05. In other words, the model is still valid with lower accuracy than the models obtained for Cucuta and Pamplona. The lower R-squared for the Herran model, can be explained by the different time period of the data for solar radiation and sunshine duration (see Table 2). Another reason is that the solar radiation data for Herran has the largest amount of missing data compared to the other two models.
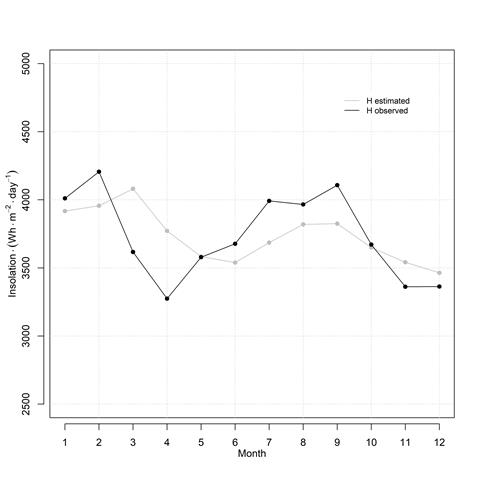
A plot of the monthly solar radiation showing observed and estimated data for Herran, is presented in figure 8. The greatest deviations occur in the months of March, April, July, August, and September.
3.4 Comparison with other works in the literature
Our results can be compared with other studies reported in the literature. The R-squared coefficients that we obtained were: 0.73, 0.78 and 0.42, for Cucuta, Pamplona, and Herran, respectively. Vélez-Pereira et al. (2015), modeled linear regressions of solar radiation with different meteorological variables, and their highest R-squared was 0.14 when they included all the available variables in a multiple linear regression model. On the other hand, Noriega-Angarita et al. (2016), used a sophisticated model based or artificial neural networks that require a high computation processing; they obtained an R-squared of 0.77. Similarly, Quej et al. (2016), employed 13 empirical models to estimate solar radiation in multiple sites in Mexico; they reported an R-squared between 0.62 and 0.71. Our results for Pamplona outperformed all the other studies, even the one that uses machine learning techniques. The model for Cucuta also has high accuracy, when compared to the other cited works. Finally, the results for Herran only outperforms the single variable linear regressions done by Vélez-Pereira et al. (2015). Therefore, the Angström-Prescott model has a high dependence on specific locations as well as the quality of the available data.
3.5 Extrapolation of the Angström-Prescott results to other subregions in Norte de Santander
With the coefficients of the Angström-Prescott equation for each subregion of Norte de Santander, the next step is to apply these equations to the sunshine duration data in other regions of the Department, in which there is no information about solar radiation.
The Department of Norte de Santander in Colombia is divided into 6 sub-regions, namely: Western, Northern, Eastern, South-West, Center, and South-East. We applied the regression results to the corresponding sub-region and also to the other adjacent sub-regions. For instance, equation 2 corresponds to the city of Cucuta which is located in the Eastern sub-region. Hence, we use that model for the municipalities in the Eastern and Center sub-regions.
Similarly, equation 3 was obtained with data from Pamplona that belongs to the South-West sub-region. Therefore, that model was used for the South-West and Northern sub-regions. Finally, equation 4 represents the Angström-Prescott model for Herran in the South-East sub-region. That model was applied in the South-East and Western sub-regions.
The results of extrapolating the model defined by equation 2 to the Eastern and Center sub-regions are presented in table 6. The estimated insolation data for theses sub-region using the described empirical method have a mean above 3800 Wh/m2 for each station.
Table 6 Eastern and center subregions extrapolation results.
| Place | Variable | Jan | Feb | Mar | Apr | May | Jun | Jul | Aug | Sep | Oct | Nov | Dec |
|---|---|---|---|---|---|---|---|---|---|---|---|---|---|
| El Zulia - Risaralda Station | Irradiation (kWh/m2day-1) Sunshine duration (h) | 4.0 5.0 | 4.2 4.8 | 4.3 4.7 | 4.2 4.1 | 4.5 5.4 | 4.4 5.4 | 4.7 6.5 | 4.8 6.4 | 4.8 6.2 | 4.4 5.3 | 4.0 4.8 | 3.7 4.4 |
| Camilo Daza Airport Station | Irradiation (kWh/m2day-1) Sunshine duration (h) | 4.4 6.5 | 4.5 6.0 | 4.4 4.9 | 4.4 4.8 | 4.6 5.8 | 4.6 6.0 | 4.8 6.6 | 5.0 7.0 | 4.9 6.7 | 4.6 6.3 | 4.4 6.3 | 4.2 6.3 |
| Cucutilla - Granja H. J. C. Station | Irradiation (kWh/m2day-1) Sunshine duration (h) | 3.7 4.0 | 3.6 2.8 | 3.8 2.9 | 3.8 2.7 | 3.8 3.0 | 3.7 3.1 | 3.9 3.7 | 4.1 3.9 | 3.9 3.3 | 4.0 4.1 | 4.0 4.8 | 3.6 3.9 |
| Salazar - Francisco Romero Station | Irradiation (kWh/m2day-1) Sunshine duration (h) | 3.6 3.6 | 3.7 3.1 | 3.7 2.7 | 3.8 2.8 | 4.1 3.9 | 4.1 4.4 | 4.3 5.1 | 4.4 4.8 | 4.4 4.8 | 3.9 3.8 | 3.6 3.5 | 3.5 3.7 |
For the West and South-East results (shown in table 7) calculated with equation 3, the mean of each station is above 3700 Wh/m2, with some places having a high solar potential such as Aeropuerto Agua Clara Station with a solar irradiation mean of 4415 Wh/m2.
Table 7 West and south east subregions extrapolation results.
| Place | Variable | Jan | Feb | Mar | Apr | May | Jun | Jul | Aug | Sep | Oct | Nov | Dec |
|---|---|---|---|---|---|---|---|---|---|---|---|---|---|
| Abrego Station Irradiation | Irradiation (kWh/m2day-1) Sunshine duration (h) | 4.6 7.0 | 4.6 6.2 | 4.6 5.5 | 4.3 4.5 | 4.3 4.7 | 4.4 5.5 | 4.6 6.1 | 4.6 5.6 | 4.4 4.8 | 4.2 4.7 | 4.1 5.2 | 4.2 6.1 |
| Agronomic School of Cachira Station | Irradiation (kWh/m2day-1) Sunshine duration (h) | 4.5 6.9 | 4.6 6.3 | 4.5 5.1 | 4.1 3.9 | 4.0 3.6 | 4.0 3.9 | 4.1 4.2 | 4.2 4.2 | 4.0 3.7 | 4.0 3.9 | 4.0 4.8 | 4.3 6.3 |
| Agronomic Convencion Institute | Irradiation (kWh/m2day-1) Sunshine duration (h) | 4.1 5.5 | 4.2 4.8 | 4.2 4.1 | 4.1 3.8 | 4.3 4.8 | 4.6 6.1 | 4.8 6.9 | 4.9 6.7 | 4.6 5.5 | 4.3 5.2 | 4.0 5.0 | 3.7 4.4 |
| La Playa Station Irradiation | Irradiation (kWh/m2day-1) Sunshine duration (h) | 4.3 6.0 | 4.4 5.6 | 4.4 4.8 | 4.2 4.1 | 4.2 4.5 | 4.5 5.8 | 4.8 6.6 | 4.8 6.2 | 4.4 4.8 | 4.2 4.6 | 3.9 4.6 | 4.0 5.2 |
| Aeropuerto Aguas Claras Station | Irradiation (kWh/m2day-1) Sunshine duration (h) | 4.6 7.0 | 4.6 6.1 | 4.4 5.0 | 4.3 4.4 | 4.3 4.7 | 4.5 5.8 | 4.7 6.5 | 4.7 5.9 | 4.5 5.1 | 4.2 4.8 | 4.1 5.1 | 4.2 6.1 |
| Tama National Park | Irradiation (kWh/m2day-1) Sunshine duration (h) | 3.9 4.7 | 4.0 4.1 | 4.1 3.8 | 3.8 2.7 | 3.6 2.3 | 3.5 2.4 | 3.7 2.9 | 3.8 3.0 | 3.8 3.0 | 3.7 2.9 | 3.5 3.2 | 3.5 3.4 |
| Ragonvalia Station | Irradiation (kWh/m2day-1) Sunshine duration (h) | 4.1 5.3 | 4.1 4.5 | 3.9 3.3 | 3.9 3.1 | 4.0 3.9 | 3.7 3.0 | 4.1 4.2 | 4.5 5.3 | 4.4 5.0 | 4.1 4.4 | 3.8 4.2 | 3.7 4.4 |
| Blonay Sation | Irradiation (kWh/m2day-1) Sunshine duration (h) | 3.8 4.2 | 3.8 3.4 | 3.7 2.6 | 3.9 3.2 | 4.0 3.6 | 4.0 4.0 | 4.0 4.0 | 4.2 4.2 | 4.2 4.1 | 3.9 3.6 | 3.6 3.4 | 3.7 4.1 |
4. Conclusions
An empirical model using the Angström-Prescott equation was implemented for three different locations in Norte de Santander, Colombia. The model has a good fit for Cucuta and Pamplona, and a moderate fit for Herran, as it was indicated by the R-squared coefficients of 0.73, 0.78, and 0.42, respectively.
The results of the Angström-Prescott equation fit on Norte de Santander department conditions, show that the solar insolation in most locations within this region is greater than the world’s average solar irradiation which has a value of 3900 W/ m 2 (Unidad de Planeación Minero Energética, 2015).
The extrapolation of the Angström-Prescott model to places where solar irradiation data is not available is the most relevant contribution of this work. Using these models, we were able to generate a solar radiation database for different sub-regions within the Department of Norte de Santander. This will allow the design of PV systems and it will also facilitate a higher penetration of renewable energy resources in the region.
The monthly solar irradiation values extrapolated to other sub-regions of Norte de Santander must be treated with caution. The model presented in this work has limitations, especially for the Northern and South-West subregions (Table 8) because they were calculated using the model for Herran, which had a moderate fit with R-square = 0.42. On one hand, the sunshine hours and the solar irradiation data from IDEAM for this site come from different timespans. On the other hand, the solar irradiation data set for Herran had the biggest amount of missing data points that were interpolated using the package zoo in R. These two reasons contribute to the lower model accuracy when compared to the other two sites (Cucuta and Pamplona).
Table 8 Northern and south-west subregions extrapolation results.
| Place | Variable | Jan | Feb | Mar | Apr | May | Jun | Jul | Aug | Sep | Oct | Nov | Dec |
|---|---|---|---|---|---|---|---|---|---|---|---|---|---|
| ISER Pamplona Station | Irradiation (kWh/m2day-1) Sunshine duration (h) | 4.1 5.2 | 4.1 4.6 | 4.1 3.8 | 4.0 3.3 | 3.9 3.5 | 3.9 3.7 | 4.0 4.1 | 4.3 4.5 | 4.3 4.5 | 4.0 4.0 | 3.8 4.0 | 3.8 4.6 |
| Pamplonita - Finca la Palmita Station | Irradiation (kWh/m2day-1) Sunshine duration (h) | 4.0 5.0 | 4.1 4.4 | 3.7 2.4 | 4.2 4.2 | 3.9 3.3 | 3.9 3.8 | 4.0 4.0 | 4.3 4.7 | 4.1 4.0 | 3.9 3.6 | 3.6 3.3 | 3.6 3.7 |
| Silos Station | Irradiation (kWh/m2day-1) Sunshine duration (h) | 4.1 5.2 | 4.2 4.7 | 4.1 3.8 | 3.7 2.5 | 3.6 2.3 | 3.5 2.2 | 3.7 2.9 | 3.9 3.4 | 3.9 3.4 | 3.7 3.0 | 3.6 3.4 | 3.7 4.3 |
| Tibu Station | Irradiation (kWh/m2day-1) Sunshine duration (h) | 4.0 5.0 | 4.2 4.8 | 4.1 3.9 | 4.2 4.0 | 4.4 5.1 | 4.5 5.9 | 4.7 6.5 | 4.9 6.8 | 4.7 6.0 | 4.4 5.4 | 4.0 4.8 | 3.7 4.3 |

