


 (pdf)
(pdf)


 SciELO
  Google
  SciELO
  Google
 Permalink
1. Introduction
The great challenges in current education include supporting students and providing tools to families to improve student learning. The challenge of the Teaching Centers (schools and universities, among others) is to provide an inclusive and quality education (Moriña, 2017). After the COVID-19 pandemic, the University is committed to articulating technology with pedagogical processes and improving each student's competencies when graduating from an academic program. Quantitative Reasoning is among the basic competencies of a professional (Upmeier zu Belzen et al., 2021). According to Budhathoki (2022), Quantitative Reasoning (QR) holds that:
(…) QR is an individual's ability to understand and use numbers in context. QR includes the skill (a) to read, understand, interpret, and analyze numbers, quantities, and data presented in various forms; (b) to solve real-world problems using mathematical and statistical knowledge; and (c) to represent and model quantitative situations, to reason using quantitative evidence, to draw conclusions, and to communicate these conclusions. (p. 16)
Based on the above, Universities must enable improvement actions in this competence based on the analysis of indicators to have the evolution of each student during their process (Schmidt et al., 2023). However, measuring the value-added in undergraduate education can be a daunting challenge since wide variables are considered in the analyses (Lyons and Polychronopoulos, 2020). Also, in recent years, the learning outcomes achievement as a value-added of the education institutes has gained considerable importance in the experience at higher education. The student's educational experience, as well as the knowledge related to quantitative reasoning competence, can be measured through a wide range of tests such as Arithmetic Reasoning (AR) or Mathematical Knowledge (MK) (Tirre and Peña, 1993). Throughout the literature, there is an ongoing discussion of how to approach quantitative reasoning in the different areas of knowledge. The analysis has focused on generating playful learning spaces that make it possible to share the improvement of this competence in students (Ozaltun-Celik, 2021; Lewkowycz et al., 2022).
There are qualitative and quantitative studies as well as assessments of Quantitative Reasoning (QR) done in the literature; however, there is a lack of research to provide independent variables related to QR and the possibility of extending their analysis to other years, which makes not possible to give an overall picture of this competence after and in the middle of the bachelor's degree education. The above allows to report and explain an institution's value. Different types of studies have been made in the literature to evaluate quantitative reasoning through precalculus (Bowers et al., 2017), calculus (Ozaltun-Celik, 2021), environmental science (Mayes et al., 2014), and language (Lewkowycz et al., 2022).
Nowadays, quantitative reasoning is a topic in constant research to improve basic skills and competencies in mathematics. Gallardo-Pérez et al. (2021), presented an added-value study on basic mathematics and physics science in engineering careers. These authors employed post-test and pre-test analysis to correlate the value added. These correlations were in the first four semesters of the elemental training cycle. The latter included, among others, subjects such as differential calculus, integral calculus, vector calculus, and differential equations. The results showed that courses in differential equations, linear algebra, and classical mechanics contribute more to other variables.
On the other hand, Schmidt et al. (2023), presented a methodological approach for QR competence applied to business and economics. These authors used the Test of Understanding College Economics (TUCE) and the Examen General para el Egreso de la Licenciatura (EGEL), to measure quantitative reasoning skills. The results explained by these authors indicate that the students do not present a significant difference between advanced courses and no prior education in business and economics. According to the literature (Franco-Gallego, 2019; Pérez et al., 2021; Schmidt et al., 2023), the Teaching Centers (TCs) present indicators in their reports of the value-added of different competencies such as Quantitative Reasoning (QR). Also, these institutions are interested in understanding if a variable presents or not a significant dependence on QR competence. For these reasons, the aim of this work is to provide a statistical application to compute the value added for QR competence, which other TCs might use in their reports.
The Universidad Católica Luis Amigó carries out a process of value-added analysis, measured from the QR competence from 2018 to the present. This work performed a statistical analysis for students in the fifth level of the Medellín campus. The study also used the results from Saber11 tests applied by ICFES (Instituto Colombiano para la Evaluación de la Educación), in 2021. The analysis allowed us to identify the value added by the institution for a specific competency. The latter made it possible to provide further improvement activities.
2. Methodology
The approach used in this work is a quantitative investigation, also known as Empirical-Analytical Research, due to the fact that Value-Added at the University requires indices, percentage distributions, and quantitative indicators that allow measurement (Montoya & Cogollo, 2018). Likewise, the design is non-experimental, longitudinal, and correlational because variables are not controlled. This study took the variables in the natural context, and the data will be collected for different periods of the presentation of Saber11 tests (Oschwald et al., 2020; Hu et al., 2020). Figure 1 shows the four steps used in the methodological process to calculate the value-added for Quantitative Reasoning (QR).
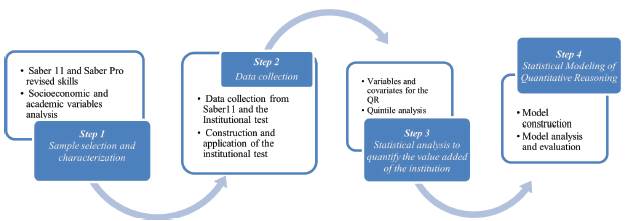
The four steps described in Figure 1 are explained as follows.
Step 1: Sample selection and characterization. The value-added analysis for the year 2021 took as a population the students enrolled in the fifth level during periods 01 (February to May) and 02 (August to November) of the 22 undergraduate academic programs of the Universidad Católica Luis Amigó, Medellín, Colombia (Universidad Católica Luis Amigó, 2023). The variables used to characterize the students evaluated in this work were: (i) Type of college of graduation of the students; (ii) Socioeconomic stratum of 5° level students, (iii) People with whom the 5° level students live; (iv) Family income; (v) Work activity of 5° level students; (vi) Educational level of the father and mother of students in the 5° level; (vii) Marital relationship of parents of 5° level students; (viii) Presentation time of the Saber11 test in 5° level students. Usually, sample characterization processes use the already described variables (Park and Holloway, 2018; Bonal & Gonzáles, 2020; Wu et al., 2020).
Step 2: Data collection . Current work collected the data in two moments. In the first moment, it found the students' results of the Saber11 test related to the quantitative reasoning module (secondary data). In the second one, it applied the Institutional QR test. The Saber11 test evaluates the level of secondary education. It is used to select students for admission to higher education and to measure the quality at the academic level of the primary secondary. Students finishing the eleventh grade presented it. It can also be taken by people who have already obtained their high school diploma. Details related to the regulation of the presentation of the Saber11 tests are available in different literature sources (Presidencia de la República, 2010; ICFES, 2023).
On the other hand, the institutional test evaluates students pursuing the 5th semester of a bachelor of 10 semesters in terms of QR. The institution designed the test considering the competencies established in the SaberPro test managed by the ICFES (2023). The Basic Science Department at Universidad Católica Luis Amigó was in charge of performing the test. This test evaluated quantitative reasoning skills concerning numbers, arithmetic operations, and graph analyses. It is also worth mentioning that the designed test examined statistics, geometry, algebra, and calculus (ICFES, 2023). The test performed at the institution characterized the socioeconomic conditions of fifth-level students from the Medellín, Colombia campus using the variables described in step 1 (Universidad Católica Luis Amigó, 2023; Campus virtual, 2023).
Step 3: Statistical analysis to quantify the value added by the institution. The statistical analysis used quintiles (Bonal & González, 2020; Montgomery, 2020), as the statistician to quantify the value added of QR. Quintiles (Q) distribute the score in 5 equal portions: Q1, which groups the 20% of the lowest results, and Q5, which groups the 20% highest. The quintiles were estimated by following the proportion of the scale in each of the tests. The comparison of the results of the Saber11 tests (Mathematics) with the institutional QR tests is carried out by typing and standardizing the results.
The Quantitative Reasoning (QR) value added by the Universidad Católica Luis Amigó in its students is estimated using the difference between the quintiles of the Institutional test and the Saber11 test. The crossing of the results of these two tests gives origin to a relationship in the Cartesian plane, explained by four quadrants. The QR test will be analyzed as a dependent variable, and independent variables, or covariates, may intervene in the test provided at the University. The students' sociodemographic characteristics were taken as covariates, establishing the link with the institutional results. Table 1 shows each variable and covariates, their description, and the range of values it can take.
Table 1 Variables and covariates for the QR test.
| Variable | Code | Description | Values |
|---|---|---|---|
| Dependent variable | QUANTI_REASONING | The score obtained in the QR institution test | Scale 1-100 |
| Covariates | SABER11_MATH | Saber11 test score | 1-100 |
| PROGRAM | Academic program to which it belongs | 1-19 | |
| SCHOOL_TYPE | Type of college from which you graduated | 1: public 2: private | |
| STRATUM_SOC | Socioeconomic stratum | 1-6 | |
| WHO_DOES_HE_LIVE_WITH | Who does he live with? | 1-4 | |
| MONTHLY_INCOME_FAMILY | Family monthly income | 1-5 | |
| HAS_SOURCE_OF_WORK_INCOME | Do you have any revenue sources? | 1-2 | |
| EDUCA_FATHER | Father's years of education | 1-5 | |
| EDUCA_MOTHER | Mother's year's education | 1-5 | |
| SEPARATED_PARENTS | Are your parents separated or divorced? | 1-2 | |
| AVERAGE_ACCUMULATE | What is your grade average? | 1-5 |
Step 4: Statistical Modeling of Quantitative Reasoning. This step aims to develop a model to predict QR in years after 2022 and also to know whose variables are of greater significance in QR modeling. Firstly, in the development of the model, those data where students "clicked through" all the test questions in less than 2 minutes and where the students did mark no questions were not considered. Secondly, the model's parameters were fitted using only the data for the year 2018. The estimation of the score of the Quantitative Reasoning (QR) test was carried out using the multiple linear regression model described in Equation 1. The independent variables (X 1 , X 2 , …, X n ) were defined as those that presented an association in the correlation matrix; however, other variables that did not show associativity with the QR score could also be incorporated when running the model.
In Equation 1, Y corresponds to the Dependent Variable related to the score in the QR test performed at the university, β 0 corresponds to the value of the score in the absence of independent variables, β i indicates how much the score changes due to the independent variable, and X i corresponds to the independent variables. The proposed linear combination equation in terms of independent institutional characteristics is already shown in the literature (Rodgers, 2007; Fernandes et al., 2020). Thirdly, the Williams plot is constructed to identify possible outliers’ points for the model and the prediction for other years (2018 to 2022). The leverages are developed using the diagonal elements of the Hat Matrix. This matrix is constructed in terms of the data matrix Χ and the Jacobian matrix of the four adjustable parameters of the linear model (β i ). The matrix Χ is two-dimensional, depending on the number of data points and input parameter variables. Also, the ± 3 values of the standardized residuals are provided as recommended values reported in the literature (covering 99% of scattered data) (Atashrouz et al., 2017; Kar et al., 2018).
3. Results and discussion
3.1 Sample selection and characterization results
Table 2 presents the total number of students who participated in the institutional test and who will be considered for this study. It should be clarified that for this work, the students approved to be part of the study and answered the questions freely from the Virtual Campus (Campus virtual, 2023). Despite the response obtained by students in 2021, participation has decreased compared to 2020. This Table shows that the participation percentage is low and below 47%. Therefore, the year 2020 is the one with a higher level of participation (47 %), and 2019 is the year that presents the lowest participation percentage (23%).
Table 2 Student participation in the institutional QR test.
| Year | Characteristics | ||
|---|---|---|---|
| Total number of students | Number of students presenting the test | Participation percentage (%) | |
| 2018 | 975 | 362 | 37 |
| 2019 | 2.352 | 534 | 23 |
| 2020 | 2.278 | 1.062 | 47 |
| 2021 | 1.254 | 469 | 37 |
Figure 2 illustrates the sociodemographic and economic characteristics of the students who took the institutional test. Around 70 % of the students presented the Saber11 test between 5 and 9 years ago, while the rest took it more than 9 years ago. In Medellín, students in the 5° level of undergraduate programs belong to stratum 3 (45%), followed by stratum 2 (34%). Most of them live with their parents (father and mother), and as a second option, they do so with relatives other than their parents. When analyzing the income received by the family group, it is observed that most families do not exceed USD 400,90.
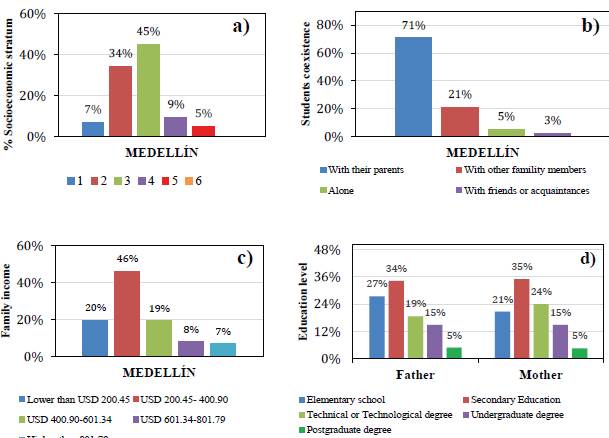
Figure 2 Socioeconomic characterization of the students who took the institutional test in 2021: a) Socioeconomic stratum, b) student coexistence, c) family income, d) education level.
The work activity of the students reflects economic dependence, and the parents' education level focuses on primary and secondary education. 54% or more of the parents reach an education level in primary and high school, while the professional level ranges between 9% and 34%. The mother's education level is similar to that observed in the father. When analyzing the parents' marital status, a slight decrease in the percentage of separated parents is evident concerning couples with stable relationships. The elapsed time of presentation of the Saber11 test concerning the moment of presenting the institutional test by the students is considered distant in all the cases. The time difference is between 4 and 9 years. The results of the QR test show low levels in the skills associated with analysis and logical reasoning in the institution's students. The arithmetic average of the quantitative reasoning test is 2,3, while in the mathematics competition in the Saber11 test, it is 52 points. The average measured on a scale from 1 to 5 does not present approval levels (assuming a rating of 3,0). The behavior in the mathematics test presented in Saber11 is similar. The results are low on a scale of 1 to 100 (assuming 60 is an acceptable score).
3.2 Statistical analysis to quantify the value added of the Universidad Católica Luis Amigó
The value added for the QR was calculated from the difference between the scores obtained in the Institutional test and the Saber11 test. It is important to note that the Saber11 test’s scale varies from 0,0 to 100 (ICFES, s.f.) while the QR institutional test varies from 0 to 5. The analysis was carried out using quintiles. Table 3 shows the Quintiles (Q) distribution. This table shows that the Q distributes the score into five equal portions, with Q1 grouping the 20% lowest results and Q5 the 20% highest. The quintiles were estimated following the proportion according to the scale of each one of the tests. Considering that the acceptable score on the Saber11 Mathematics tests is 60, and for the QR Institution test is 3, most students do not reach this level on the tests, which is why value added is only observed in the first two quintiles, where 40% of the lowest qualifications accumulate. The significant value-added must be reflected with increases in quintile 5, where 20% of the highest qualifications accumulate and increase by 4%. In conclusion, the minus values of the value added in Q3 and Q4 (the difference between the percentages between Saber 11 and the Institutional test) imply that the student reduced their learning in QR competence. On the other hand, in Q5, where the highest score set of the value added can be found (above 80 %), only a 4 % increase is shown, which means that the students improved their learning by only 4 % during the five semesters.
Table 3 Value-added Quantitative Reasoning in 2021.
| Saber11 Mathematics | Quantitative Reasoning Institution test | Value added | |||||
|---|---|---|---|---|---|---|---|
| Quintile | Score | N° of Students | % | Score | N° of Students | % | |
| Q1 | 0,0 - 19,9 | 0 | 0 | 0,0 - 0,9 | 50 | 11 | 11% |
| Q2 | 20,0 - 39,9 | 66 | 13 | 1,0 - 1,9 | 173 | 37 | 24% |
| Q3 | 40,0 - 59,9 | 348 | 69 | 2,0 - 2,9 | 141 | 31 | -38% |
| Q4 | 60,0 - 79,9 | 91 | 18 | 3,0 - 3,9 | 76 | 17 | -1% |
| Q5 | 80,0 - 100,0 | 0 | 0 | 4,0 - 5, 0 | 16 | 4 | 4% |
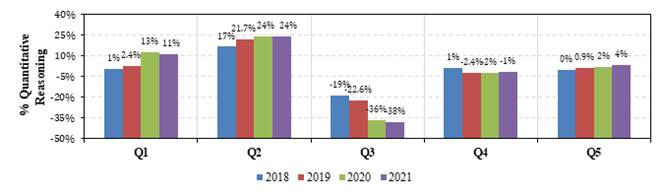
Figure 3 shows the distribution of quintiles for the years 2018 to 2021. In this figure, the Q shows similar value-added behavior over the years. Q1, Q2, and Q5 exhibit slight positive increases; meanwhile, Q3 and Q4 exhibit slightly negative increases. As can be seen, the Q5 gradually increased over the years, and it is challenging for the Basic Sciences Department to improve this indicator.
The results of the Saber11 tests with the institutional test were contrasted by typing or standardizing the results, i.e., estimating the standard deviations of the tests to the arithmetic mean. The crossing of the Institutional test (y-axis) and the Saber11 test (x-axis) results gives the origin to a relationship in the Cartesian plane, explained by four quadrants. Figure 4 illustrates the quadrants over which the standard deviations of the Saber11 Mathematics and Institutional QR tests are distributed, some relationships explain the behavior of value added for the institution.
Next, the following inferences related to the quadrants reported in Figure 4 are performed:
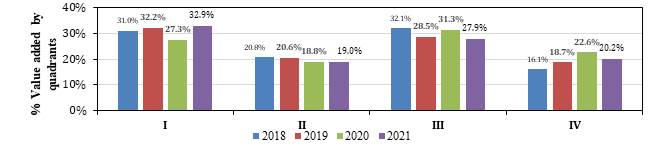
(i) Quadrant I: a group of students with positive deviations in the Saber 11 Mathematics tests and the QR test, which means that the scores are above the average in both tests. It reflects a small contribution from the institution to the students in the QR competition. This group includes 32,9% of the institution's students. It would be expected that this percentage is high in order to maintain a good level of generic QR competence in students.
(ii) Quadrant II: a group of students with negative deviations in the Saber 11 test and positive deviations in the simulacrum test. This group makes it possible to demonstrate the improvement of students who entered with scores below the average and obtain results in the simulacrum test above it in the QR competition. The percentage of students from the institution for this quadrant is low, corresponding to 19%. As the percentage in this group increases, the impact of the value added becomes more visible to the institution. In conclusion, the real value added is shown in the second quadrant (II) since the student's institutional test score is above the Saber11 test competencies (the x-axis is located at the left of the origin).
(iii) Quadrant III: a group of students with negative deviations in the Saber 11 Mathematics test and simulacrum QR test. It corresponds to students with below-average grades in the Saber 11 and simulacrum tests. An aspect to highlight from this group is that it needs to reflect the value added for the students since the level of qualifications remains below the average. The percentage of this group for the institution is 27,9 %.
(iv) Quadrant IV: a group of students with positive deviations in the Saber 11 Mathematics test and negative deviations in the QR institutional test. This group presents the students who scored above the average in the Saber11 test and below in the simulation one. It is the group of greatest concern for the university because it reflects decreasing conditions in the level of the students. They go from scores above the average in the Saber11 Mathematics test to levels below in the QR Institution test. This group represents 20,2% of the population at the university. The idea is to keep this group with minimum values.
Figure 5 compares the percentages of students in the quadrants from 2018 to 2021. A slight increase in Quadrant I is shown, however, it makes a small contribution to value added. In Quadrant II a stable behavior is shown, and it becomes representative as it reflects the value added by the students. In the case of Quadrant III, the decrease in percentage is beneficial since the number of students with low scores in the Saber11 Mathematics test and the QR institutional test is reduced. In contrast to quadrant IV, where the percentage decrease in the last year reflects a reduction in students entering the institution with Saber11 Mathematics scores above the average, and in the institutional QR test, the score is below average, which is beneficial for the institution.
Rodríguez-Revilla and Vallejo-Molina (2022), determined the value added of QR of four Higher Education Institution (HEI) groups related to (1) accredited and official, (2) accredited and private, (3) non-accredited and official, (4) unaccredited and private. These authors employed standardized mean indicators from 2012 to 2016. When the authors compared all the analyzed groups, they found that the private HEIs provided a value-added greater than the public HEIs in QR, regardless of whether they were accredited. These authors concluded that applying other statistical tests (different from the arithmetic mean) must be necessary to draw better conclusions above the value added. In comparison, our work shows that QR in the students increased only 4 % in the top 20% of scores using a quintile standardized analysis applied in the middle of their Curriculum.
3.3 Proposed model for Quantitative Reasoning
Table 4 shows the correlation matrix to identify the relationship between the student's QR competence with sociodemographic and academic variables. Also, the Critical Reading (CR) test and QR were included in the analysis (Awofala and Lawal, 2022). In this table, the symbol ** indicates that the correlation is significant at the 0,01 level (bilateral), and the symbol * indicates that the correlation is significant at the 0,05 level (bilateral). The knowledge of this relationship will make it possible to propose a statistical model for prediction processes. Two models can be developed using the multiple linear regression method. The model incorporated the independent variables that presented an association with the QR test.
Table 4 Correlations matrix regarding the CR and QR skills.
| Variable | Pearson correlation | Sig. (bilateral significance) |
|---|---|---|
| Critical Reading Score | 0,250** | 0,000 |
| Quantitative Reasoning Score | 1 | 0,000 |
| Cumulative average | 0,117* | 0,023 |
| Saber11 Mathematics Score | 0,360** | 0,000 |
| Saber11 Language Score | 0,292** | 0,000 |
| Saber11 presentation time | 0,004 | 0,934 |
| Which type of college, between private and public, you graduated from? | 0,014 | 0,793 |
| What is your socioeconomic stratum? | 0,057 | 0,266 |
| Who do you currently live with? | 0,010 | 0,849 |
| What is your family's monthly income? | 0,010 | 0,841 |
| Do you have any source of employment income? | 0,023 | 0,656 |
| Father's education | -0,001 | 0,985 |
| Mother's education | 0,007 | 0,894 |
| Are your parents separated or divorced? | 0,039 | 0,452 |
Table 5 shows the models developed by the SPSS program. For the first model of this table (row 2), the predictor variable QR Score depends on CR Score, Presentation Time of Saber11 test, Cumulative Average, Saber 11 Language, Saber 11 Mathematics, and the second model of this table (row 3) relates the QR Score to the Critical Reading Score, Saber 11 presentation time, Saber11 Language, Saber11 Mathematics as independent variables. The same R 2 was observed in both models, with appropriate significance to predict the Critical Reading test (F test with a significantly less than 0,05). The low values of R 2 were already shown by Schmidt et al. (2023). However, model 2 guarantees the existence of the constant and the model coefficients with non-zero values (significance less than 0,05 in the t-test). Independence is estimated using the Durbin-Watson statistic, which takes values close to 2 when the residuals are entirely independent. On the other hand, Table 6 shows the values of the characteristic constants and coefficients used in the linear regression model.
Table 5 Fitting model for the Quantitative Reasoning test.
| Model | R | R 2 | Adjusted R 2 | Standard error of the estimate | Durbin Watson |
|---|---|---|---|---|---|
| 1 | 0,448b | 0,201 | 0,189 | 0,56878 | |
| 2 | 0,448c | 0,201 | 0,192 | 0,56800 | 1,832 |
Table 6 Constants, unstandardized coefficients, and typified coefficients of the evaluated linear regression models.
| N° | Variables | Unstandardized coefficients | Typified coefficients | t | Sig. | |
|---|---|---|---|---|---|---|
| 1 | Constants | 0,349 | 0,451 | 0,774 | 0,439 | |
| Saber 11 Maths, X1 | 0,022 | 0,004 | 0,326 | 5,769 | 0,000 | |
| Saber 11 Language, X2 | 0,010 | 0,004 | 0,141 | 2,585 | 0,010 | |
| Presentation time Saber 11, X3 | 0,029 | 0,008 | 0,173 | 3,385 | 0,001 | |
| Saber 11 Language Score, X4 | 0,187 | 0,056 | 0,168 | 3,347 | 0,001 | |
| 2 | Constants | 0,286 | 0,056 | 1,233 | 0,218 | |
| Saber 11 Math’s, X1 | 0,022 | 0,004 | 0,325 | 5,796 | 0,000 | |
| Saber 11 Language, X2 | 0,010 | 0,004 | 0,140 | 2,584 | 0,010 | |
| Presentation time Saber 11, X3 | 0,028 | 0,008 | 0,173 | 3,386 | 0,001 | |
| Saber 11 Language Score, X4 | 0,186 | 0,055 | 0,167 | 3,379 | 0,001 | |
In conclusion, the model to estimate the QR score at the institutional level is represented by Equation 2:
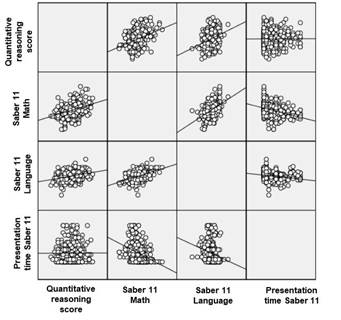
In Equation 2, Y corresponds to the QR score, X 1 is the score of the Saber11 test in Mathematics, X 2 is the score of the Saber11 test in Language, X 3 is the presentation time of the Saber11 test, and X 4 is the Critical Reading (CR) test score. The selection of these variables agrees with Mayes et al. (2014) report. Concerning the explanatory variables of the test, the one with the greatest contribution is the CR score, with a value of 0,186 points for each unit of change in the QR score. Then, it is followed by the time needed to take the Saber 11 tests, with a contribution of 0,028 points for each unit of change in the QR score. The score of the Saber11 test in Mathematics presents a contribution of 0,022 points. Finally, the Saber11 score in Language contributes 0,010 points for each unit of change in the QR score. Both scores do not present less contribution when compared with the CR test score. Linearity, normality, independence of residuals, collinearity, and homoscedasticity belong to the assumptions made for the multiple linear regression model. Figure 6 shows the dependent variable (QR) as a linear tendency with the independent variables, such as Saber11 of Mathematics, Language, and the test presentation time.
The normality test was performed using the P-P graph. This graph observes the adjustment of the residuals with a linear pattern. Then, employing the Kolmogorov-Smirnov test, whose P-value or significance is greater than 0,05, the normality of the residuals is guaranteed, as seen in Figure 7 and Table 7. In this table, the superscripts a and * indicate the Lilliefors significance correction and the lower bound of the true significance.
Table 7 Normality for the residuals of the QR.
| Test | Kolmogorov-Smirnova | Shapiro-Wilk | ||||
|---|---|---|---|---|---|---|
| Statistician | df (degrees of freedom) | Sig. | Statistician | df | Sig | |
| Non-standardized residual | 0,041 | 361 | 0,200* | 0,995 | 361 | 0,237 |
The assumption of independence is because the residuals or errors are independent between them. According to the Durbin-Watson statistic, the residuals generated for the QR test are independent (it takes a value of 1,847, which is close to 2). Then, the collinearity analysis uses the Variance Inflation Factor (FIV) factor, which must be close to 1 to guarantee non-multicollinearity. The variables that explain the model do not represent linear dependence between them, i.e., there is no multicollinearity because the Variance Inflation Factor (FIV) is close to 1. Finally, the assumption of homoscedasticity is analyzed in the scattergram of typified forecasts and standardized residuals. Figure 8 shows the standardized residual of QR results. As seen in this figure, uniform variation is observed and does not present a defined pattern in its distribution. Therefore, it achieves the assumption of homoscedasticity.
Another correlation analysis is done to evaluate if the model constructed in 2018 can be able to predict other years and used for comparison purposes. Figure 9 shows the Williams diagram. This plot is done with the model provided in 2018 and is extended to predict other year behavior. This diagram provides an overall picture of possible outliers of the model when it is applied to describe other conditions different from the fitting procedure. The 0,70 % of the data present ± 3 above standardized residuals while the 0,75 % presents data above the critical leverage (h* = 0,009 where five constant parameters and 2012 data after data cleaning), demonstrating low outliers’ values. The above shows that the level of students in the QR is currently maintained. With the final model, the authors estimate the average relative deviation for 2018, 2019, 2020, and 2021 with values of -0,3 %, 10.96 %, -2.50 %, and -3.95 %. Low values trend to zero, demonstrating satisfactory distribution between positive and negative errors. In conclusion, the QR results have remained constant over the years, a topic that must be improved in the University to increase QR scores.
Franco-Gallego (2019), developed a linear regression to determine the value added related to a student's score on the SaberPRO test regarding salary. This study uses the information provided by 278 higher education institutions and considers 428759 observations from 2010 to 2015. Using several statistical analyses, the author demonstrated the significant relation, directly and positively, between the value added and the student's salary. This author mentioned the importance of providing models to analyze the relationship between value-added and other valuable competencies. Instead, Gallego-Pérez et al. (2021), developed a value-added model based on different mathematical courses related to the first four semesters. These authors found that differential equations, linear algebra, and mechanical physics are those variables that contribute to the student's mathematical thinking. Compared to this work, the Critical Reading followed by Language significantly contributed to QR competence.
4. Conclusions
The value-added analysis of the fifth-level students of Universidad Católica Luis Amigó can highlight some aspects as a starting point for academic planning and improvement plans. At the national level, more than 56 % of students finished high school in public education institutions. Most belong to socioeconomic stratum 2 or 3, and some work. Also, students live with their parents; few do with family or friends. Regarding the father and mother, the education level is between the primary and high school levels. The income of the family group does not exceed two million Colombian pesos per month.
Concerning the results obtained in the Saber 11 tests in Mathematics and Language, they were within the Acceptable level of 60 points on the 100 scale (46 for Mathematics and 52 for Language). The same situation occurred in the institutional test, where the acceptable level was 3,0 on the 5,0 scale, and the results were 1,7 for QR. The value added for the institution took relevance in 2021, although the reflected contributions are in the first quintiles (Q1 and Q2), where the lowest scores accumulate. In the same year (2021), the negative values 2018 in the top quintile (Q5) in QR and Critical Reading skills were also overcome.
The real QR value added is shown in Q5, where the highest score set can be found (above 80 %), and it only increased by 4 %. Finally, a linear model was developed to determine the QR relations. The model was also extended to predict other years. The model results showed low outliers percentage data of the QR sample. Also, Critical Reading and Language significantly contributed to the QR competence. Other institutions can employ the statistical analysis applied in this work in order to provide QR value-added and subsequently compare it to the results of this work. Further work is needed to report the added value to other relevant competencies, such as reflective reading and learning outcomes.

