


 (pdf)
(pdf)


 SciELO
  Google
  SciELO
  Google
 Permalink
1. Introduction
The agricultural sector plays an important role in the Colombian economy, where beekeeping stands out as a low-cost, competitive, and environmentally sustainable alternative (Schouten, 2020). Beekeeping impacts the economy through commercialization of hive products. In the Department of Boyacá, pollen is very important, especially in provinces such as Tundama and Marquez. Besides, the attributes of corbicular pollen result in great export potential (Mesa-Valencia, 2015). However, locally, it is perceived as a product to combat certain health conditions rather than as a highly nutritive food; in addition, consumption preferences are unknown. Thus, an instrument is needed to identify the preferences of the pollen consumer in the region. In the animal sciences, these tools are developed solely on the basis of zootechnical considerations, leaving aside statistical tools for proper validation.
On the other hand, Fandos-Herrera & Flavián-Blanco (2011), stated that perceived quality is defined through consumer value judgments of a product and that it is reflected in the dimensions of intrinsic and extrinsic attributes. Intrinsic attributes refer to color, smell, taste, texture, shape, freshness, and appearance; extrinsic attributes correspond to image, price, place of origin, brand, packaging, guarantee, reputation, store, among others. The former allows consumers to evaluate physical characteristics, and the latter to differentiate similar products.
Moreover, as pointed out by Mora-González et al. (2018), the relevance of perceived quality lies in the fact that it determines compliance with consumer needs and expectations and its loyalty is evidenced by the commitment to buy the product again (Nkpurukwe & Opara, 2022). Thus, the higher the perceived quality of the product, the greater the satisfaction.
Preliminary studies have analyzed the hive product market for honey. Gonzales-Montenegro (2015), in a commercial feasibility study for a brand of honey from the Association of Beekeepers Cruz Verde of the Íllimo district in Chiclayo - Peru, looked at time of consumption, frequency of consumption, form of consumption, purchase location, packaging type, and origin, examining the medicinal, nutritional, energetic, and cosmetic benefits of honey.
Furthermore, Urquiza-Jozami et al. (2019), analyzed the consumption preferences for honey produced from short marketing channels in Mar del Plata-Argentina, along with some sociodemographic variables such as gender, age, education, employment, and number of household members. The frequency of consumption, use, consistency, color, and geographical origin were examined. The purchasing habits included purchase frequency, number of units purchased, place, reasons for choosing the place, and price paid, among others. However, there are no studies on measuring pollen consumption preferences.
The consumption preferences for corbicular pollen in the Department of Boyacá are unknown. Therefore, there are no marketing strategies that could benefit beekeepers and consumers. Palynology analyses from parallel research that have not yet been published indicate the presence of fruits such as plum (Prunus salicina), feijoa (Acca sellowiana) and peach (Prunus persica) in samples from the provinces of interest (C. Martínez, personal communication, March 5, 2022). Local knowledge provided by beekeepers and inhabitants of the region suggested an inclination towards products that contain species produced in the area, such as the aforementioned fruits (D. Prieto, personal communication, March 23, 2022), henceforth, there is potential for designing programs that add value to this hive product in the region, and this shows the relevance of designing instruments to establish consumer preferences.
Therefore, the objective of this study was to design and to validate an instrument to determine pollen consumption preferences in the provinces of Márquez and Tundama in the Department of Boyacá, Colombia, using an exploratory/predictive model.
2. Methodology
A combination of constructs was used to approach the concept of pollen preferences (Saris & Gallhofer, 2014). This section presents the theoretical foundations and a predictive model stablishing the causal relationships between the constructs for the pollen preference. Each construct was transformed using indicators whose quality could be evaluated with statistical models, the methodology to contrast the proposed model with the opinion of pollen consumers using a sample from the provinces of Tundama and Márquez in Boyacá is described as well. Table 1 shows the constructs and indicators for the concept of preference in the PPDQ questionnaire, based on the concept of perceived quality.
2.1 Statistical analysis
Structural Equation Models (SEM), a family of second-generation multivariate statistical models that estimate the relationships between multiple variables and their effects on each other, were used to estimate reliability and validity. One of the assumptions of this technique is that there is a set of latent factors or constructs that influence a group of observed variables or indicators that, in in this case, are measured with a questionnaire, that is, the answers to the questions, which are independent of each other conditioned on the corresponding latent factor (Hair et al., 2021).
Table 1 Operationalization of the constructs for the pollen preferences model.
| Construct | Observed Indicator |
|---|---|
| Intrinsic Quality (CI) | Flavor (S5P1_Sabor+), Texture (S5P4.Textura+), Intensity (S5P2.Intensidad+), Aroma (S5P3.Aro…), Color (S5P5.Color+). |
| Extrinsic Quality (CE) | Municipality of origin (S4P8.Mun_pro_p…), Cosmetic benefit (S4P113.B.cosméticoT), Nutritional benefit (S4P111.B_nutricionalT), Other benefit (S4P114.B_otroT), Origin (S5P11.Proceden…), Read label information (S4P9.Lee_inf_etiqT), Composition label information (S5P152.Inf_eti_composicio…), Plant-type origin (S5P10.Orig_tipo_plan+), Packaging (S5P13.Empaque+), Origin label information (S5P154.Inf_eti_orig…), Recipe label information (S5P155.Inf_eti_receta+), Conservation label information (S5P156. Inf_eti_conservación), Origin label information (S5P153.Inf_eti_proceden…), origin (S5P9. Orig_climático), Plant origin (S5P8. Orig_planta), Botanical origin (S5P7. Orig_botánico), Presentation (S5P6.Pres…) |
| Satisfaction (S) | Consumed quantity (S4P5.Cant_consumida+), frequency of consumption (S4P1.Frec_consumo+), shopping place (S4P10.Donde_com_polen+), season of consumption (S4P2.Epo_consumo+), place of consumption (S4P3.Lugar_consume_pol…), way of consumption (S4P4.Forma_consumo+), ease of purchase (S4P61.Comprar+), preferred place of purchase (S5P12.Lugar_prefer_com+), way of purchase (S5P14.Forma_compra+). |
The two more common methods to adjust SEM are covariance-based (CB SEM) and Partial Least Squares SEM modeling (PLS-SEM); the latter was the one used in this research because there were a small sample, ordinal scales, and the analysis aims at validating a theoretical framework from a predictive and exploratory perspective (Hair et al., 2021). Furthermore, the method has minimal requirements for the distribution of residuals (Monecke & Leisch, 2012).
Before implementing the PLS-SEM technique, some variables were eliminated from the data set, applying the skewness and kurtosis criteria, as indicated by Martínez-Ávila & Fierro-Moreno (2018). Now, as to the model assumptions, Hair et al. (2021), stated that PLS-SEM provide robust estimates in the absence of normality.
The structural model (Hair et al., 2014), presents relationships between constructs and it is made up of two exogenous or independent constructs: extrinsic and intrinsic quality, and an endogenous or dependent construct: satisfaction. The equation Y=YB+Z represents the relationships between the constructs, where 𝑌 denotes the matrix of constructs, 𝑍 is the matrix of error terms with 𝐸 𝑍 =0 and 𝐵 is a matrix that contains regression coefficients, thus:
The models used to evaluate the relationships between the indicator variables and their constructs, called measurement models (Hair et al., 2014), were reflexive; that is, the construct causes the indicators (Ravand & Baghaei, 2016). An ordinal scale was used for the respondent to choose their answer. The structural model and measurement models are shown in Figure 1.
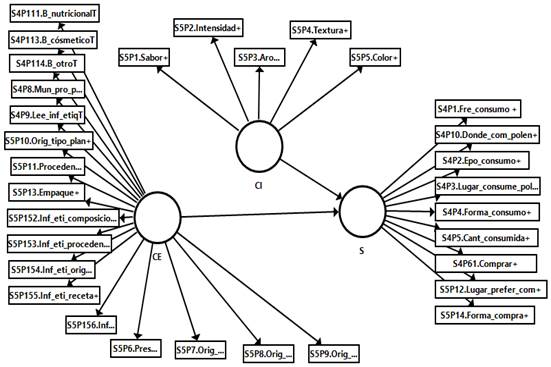
Figure 1 Research model for pollen preferences (Constructs are shown in ovals, and indicators in rectangles).
The reliability and validity evaluation were carried out using the software SmartPLS (Ringle et al., 2015), following a two-step process. First, the measurement models were tested for reliability and validity. Afterwards, the structural model was tested. The constructs were composed of reflective indicators, the measurement models were reflective, and were evaluated in terms of reliability of each indicator, internal consistency, convergent validity, and discriminant validity.
The mean variance extracted (AVE) assessed the convergent validity; it shows the extent to which each construct explains the variance of its indicators, that is, the amount of variance that the indicators had in common. AVE values greater or equal than 0.50 indicate a good model performance (Hair et al., 2019).
The Heterotrait-monotrait (HTMT) criterion assessed the discriminant validity: how different one latent variable is from another. Henseler et al. (2015, cited by Hair et al., 2021, p.79), propose values below the threshold of 0.90, such values indicate that the construct is different from the others.
2.2 Questionnaire
A questionnaire is ideal for obtaining data for an investigation (Saris & Gallhofer, 2014), and its design plays an important role. Here, the stages proposed by Supo (2013) were used: literature review, exploration of the concept, formulation of items, selection of judges, application of the instrument in a pilot sample, and evaluation of reliability and validity.
The semantic validation (Hair et al., 2019), was done with the first version of the PPDQ questionnaire on a sample of 10 consumers. The results were used to adjust the wording of some questions, reorder the answer options and eliminate redundant questions. Also, the time required to answer the questionnaire was established, which in the opinion of the authors was very long because some questions were difficult for the interviewee to understand. Once the required adjustments were made, a second version of the questionnaire was obtained and submitted to a group of experts who evaluated it. Results showed concordance in clarity and coherence.
Based on these results, the corresponding adjustments were made so that the PPDQ questionnaire had five sections: Section 1 - Characteristics of the respondent with eight sociodemographic questions; Section 2 - Domain identification, with two filter questions on knowledge and purchase of beekeeping products; Section 3 - Market indicators for honey, royal jelly, propolis and pollen products, whether purchased, quantity purchased, frequency and value in Colombian pesos of the purchase, for a total of 16 questions; Section 4 - Consumption, with nine questions for quantity consumed, frequency of consumption, purchase location, time of consumption, place of consumption, form of consumption, ease of purchase, preferred place of purchase, and form of purchase; Section 5 - Attributes of pollen, 28 questions associated with characteristics such as: flavor, texture, intensity, aroma, color, municipality of origin, cosmetic benefit, nutritional benefit, medicinal benefit, other benefits, origin, composition label information, conservation label information, origin label information, recipe label information, benefits label information, geographical origin, botanical origin, packaging, presentation, ease of transport, conservation, preparation and purchase.
Then, the sections four and five of the PPDQ questionnaire were evaluated using criteria such as reliability and validity (Saris & Gallhofer, 2014). According to Ramada-Rodilla et al., (2012), reliability is the degree of precision a questionnaire measures a certain concept with; in other words, it is the degree of precision of the measurement. On the other hand, validity measures the degree to which a questionnaire "adjusts” to the conceptual model that underlies its construction. A pilot test was carried out because it is needed to formalize data collection, improving the validity and reliability of procedures (Mayorga-Ponce et al., 2020).
The objective of the pilot test was to reduce possible biases and errors in the data, improving the proposed methodology. The main functions of a pilot test are to: determine whether the procedures for obtaining data are pertinent and feasible, elucidate validity of the instruments, and training the pollsters (Mayorga-Ponce et al., 2020).
The sampling technique used to collect the pilot sample was non-probabilistic (convenience sampling) because a strictly random selection of the components of a sample is not always possible, in this case, the product was not made for mass consumption. Three methods were used to collect the information: direct interview at the respondent's home, telephonic interview or an online form.
Direct interviews were carried out in the city of Duitama, in six neighborhoods that were selected based on personal experience (Salesiano, Arauquita, San José Obrero, Juan Bosco, Simón Bolívar or La Esperanza, Gruta) and the four cardinal points. In each neighborhood, a residential block was selected (length that varied between 100 and 150 meters) that was representative or typical. Finally, in each residential block, interviewed dwellings were separated by 10 houses or housing units. Then, 76 questionaries were collected, 19 of them corresponded to pollen consumers (25%). The study units were households.
For the second method, the strategy was going directly to pollen consumers in the provinces of Tundama and Márquez (where Boyaca’s beekeeping production is concentrated), which has 19 municipalities. The producers contacted consumers and asked them to fill out the online form. As to the third method, the information was collected by telephone.
The final pilot sample was made up of 106 surveys of pollen consumers, six of them had missing data. Out of the 106 respondents, 62.3% were women, and 37.7% were men. Most were women because the visits were done during working hours, and they were the ones at home. The average age was 44.9 years, with a standard deviation of 13.8, and the most frequent age was 40 years. Most households (81%) pertained to socioeconomic strata two or three. The average number of people per household was 3.1, with 3 being the most frequent value (a couple with a child). The most frequent educational level was undergraduate, at 44.3%. The average value of monthly food expenses was 685,377 Colombian pesos (approximately US$171). The average amount of pollen per purchase was 455 grams, and the average purchase value was 22,478 Colombian pesos (approximately US$5.6). The most common purchase frequencies were every month (frequent consumer) and once a year (occasional consumer). Most of the consumption was attributed to medicinal properties.
3. Results and discussion
Out of the 37 initial variables, six had skewness coefficients greater than three or kurtosis values greater than six. These variables correspond to questions where interviewees showed a high degree of unanimous response: i) do you believe pollen has a medicinal benefit? ii) would you recommend buying pollen? iii) is pollen an easy product to preserve? iv) is pollen an easy product to store? transport? v) is pollen an easy product to prepare? and vi) do you read the benefits on the label? These variables were non-informative. Thus, the validation process continued with 31 variables, none of which had atypical data.
The validation process of the questionnaire was carried out with 100 cases since six of the 106 initial surveys were discarded, following the recommendation of Hair et al. (2019), to not include subjects with missing responses if the sample size allows, besides, Hair et al., (2021) indicated that the PLS-SEM technique can use small sample sizes. However, Marcoulides and Saunders (2006, cited by Martínez-Ávila & Fierro-Moreno, 2018, p.11), suggested that the minimum sample size depends on the number of relationships specified in the model (between the constructs); in the present case, two relationships were studied in the structural model, so, according to these authors, the required sample size was 52.
The evaluation of the reliability of each indicator eliminated those whose reliability measured through the variance explained by the construct was less than 16%, discarding smaller correlations between the indicator and the construct through factor loads (Hair et al., 2021). Figure 2 shows the refined model for pollen, which had 12 indicators with appropriate levels of reliability. The three proposed constructs in figure 2 were measured with various reflexive indicators. The causes of pollen consumer satisfaction are described. Routes are highlighted according to their relative values; arrow width is proportional to regression coefficients.
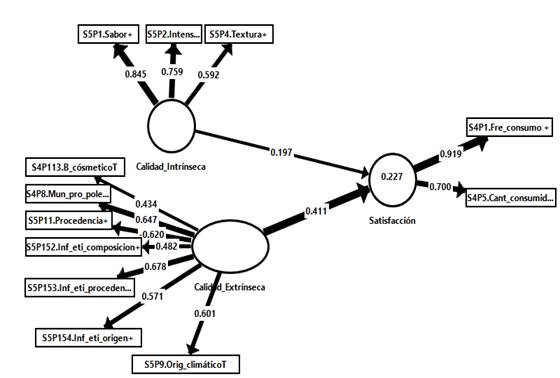
The result of the evaluation of the refined measurement model is shown in Table 2. The reliability of two indicators of extrinsic quality, cosmetic benefit and read label information, was low because the explained variance was only 19% and 23%, respectively. This was due to the lack of precision in the scale, which was dichotomous (yes/no) for label information. A scale with a higher gradation is expected to give a better measure of quality.
Table 2 Estimates of the quality criteria of the refined model for pollen preferences.
| Concept | Observed Indicator | Individual reliability | Internal Consistency | Convergent validity |
|---|---|---|---|---|
| Intrinsic quality (Exogenous) | Taster Texture Intensity | 0.845 0.592 0.759 | 0.780 | 0.547 |
| Extrinsic quality (exogenous) | Municipality of origin Cosmetic Benefit Origin Composition Information label Origin information label Origin information label Geographical origin | 0.647 0.434 -0.620 0.482 0.678 0.571 0.601 | 0.628 | 0.339 |
| Satisfaction (Endogenous) | Quantity consumed Consumption Frequency | 0.700 0.919 | 0.798 | 0.667 |
The internal consistency reliability, also known as the dimensionality of the measurement, indicates the degree of association between indicators in the same construct or the homogeneity of indicators, measured by the composite reliability coefficient rhoc, it indicated acceptable reliability for extrinsic quality and good reliability for intrinsic quality and satisfaction, Hair et al., (2021). The AVE values indicated that two concepts, satisfaction and intrinsic quality, had the minimum required value of 0.50. For discriminant validity, all values were below the threshold of 0.90 indicating that each construct was different.
Once the measurement models were evaluated, the structural model (the conceptual model that supported the construction of the questionnaire) was evaluated. When examining the collinearity for the extrinsic and intrinsic quality variables, the variance inflation factor (VIF) value was 1.015, which indicated that this problem did not occur. Then, the relevance and meaning of the structural routes were evaluated. According to the confidence intervals generated from the bootstrapping process with 500 samples, the exogenous variable had a significant relationship (p < 0.001) with extrinsic quality, indicating a strong, positive impact on satisfaction. Likewise, the intrinsic quality variable had a significant relationship (p < 0.05), indicating a positive impact on satisfaction.
On the other hand, the coefficient of determination, R2, for satisfaction was 0.227, a small value. Since pollen consumer preferences have not been studied in dept, this value was deemed as satisfactory. However, satisfaction should be measured with more indicators.
The predictive power of the structural model was evaluated with the Root Mean Square Error (RMSE) of the prediction errors (Hair et al., 2019). Following Shmueli et al. (2019), the PLS route model was compared with the linear regression model or naive LM model; the RSME of PLS for quantity consumed was 0.745, while for the LM, it was 0.769. The RSME of PLS for frequency of consumption was 1.210, while for LM, it was 1.215. So, these indicators had a lower RMSE as compared to the LM model. According to the scale suggested by Hair et al. (2019), it was concluded that this model had a medium predictive power.
In this study, a predictive model for pollen preferences and an analysis of quality perceptions of consumers in Boyacá were proposed. The results yield a model that integrates the characterizing constructs of preferences. The intrinsic quality was represented by the indicators of taste, intensity and texture, and satisfaction was determined by consumption frequency and quantity consumed. The extrinsic quality was made up of geographical origin, cosmetic benefit, municipality of origin, presence of a label with information on the composition, provenance, and origin. The model predicts a positive relationship between intrinsic and extrinsic quality, with higher perceived intrinsic and extrinsic quality generating greater satisfaction. This means that, as the taste of pollen approaches sweetness, its intensity and texture become smooth, the frequency and amount of consumption increase. The same thing happens when consumers know the cosmetic benefit and municipality of origin of the pollen and read the composition and origin on the label.
The fact that the municipality of origin and composition determine the level of satisfaction, combined with the fruit species farmed in the studied municipalities, provided a possible marketing strategy to guarantee market placement of the product by increasing the content of these fruits, which can be achieved through induced pollination programs that have been successfully implemented in high tropical regions of Colombia (Vásquez-Romero, et al., 2011).
Statistical validation is important in animal sciences since questionnaires are typically designed using knowledge of the production system of interest, but response scales are defined ad hoc, and adequate statistical validation is completely ignored. Although this study focused on beekeeping, the validation methodologies can be applied in any animal or plant production system.
One of the main flaws of beekeeping is the focus on products with low demand (Schouten and Lloyd, 2019), which, when added to the fact that the market determines productivity and income for beekeepers in developing countries, shows the relevance of studying regional markets to reach the target of establishing successful beekeeping production systems.
4. Conclusions
This study provided a tool for measuring, analyzing, and understanding pollen consumption preferences in two provinces of Boyacá. Quality estimates in the measurement model accounted for the validity of the PPDQ questionnaire because the indicators loaded their constructs adequately, except for extrinsic quality. However, the PPDQ questionnaire lacked precision and was corrected, expanding its gradation. Future studies could evaluate the impact of the number of indicators (Saris & Gallhofer, 2014).
Questionnaires often have little methodological rigor in its design and validation, so this study yields a validated tool for characterizing pollen preferences. The PPDQ questionnaire used 12 questions that represented three constructs that were measured on an ordinal scale. Emphasis was placed on validity since it guarantees the metric property of adequate manifestation of the proposed constructs. The construct of extrinsic quality continues to be evaluated in this product in terms of expanding the gradation of the measurement scale or the number of indicators.
The theory that a food can be characterized with variables that are transformed into quality attributes by perception and that this is decisive in the choice of consumers was corroborated here.
The PPDQ will allow collecting data that can be analyzed to lay the foundations for carrying out a first approach to understand the local pollen market, which, in turn, will generate inputs to design production and marketing programs. By detecting the preferences of pollen consumers, producers will know if they should focus on mono or multifloral production and will be able to make decisions on the implementation of directed pollination programs.

