


 English (pdf)
 Article in xml format
 Article references
 Send this article by e-mail
 Cited by SciELO
  Cited by Google
  Similars in
SciELO
Similars in
SciELO  Similars in Google
 Permalink
Introduction
The Titanic represented the supremacy of the British Empire in its heyday; it was the finest achievement in the art of ship-building. At 2:20 A.M on the morning of April 15th, 1912, the ship, which was supposed to be ‘unsinkable’, sank in the North Atlantic. Its name resonated its size (it weighed 52000 tons), and it was equipped with a system of sealed bulkheads: thus the interpretation that it was unsinkable. While on its maiden journey, the Titanic struck an iceberg, which produced a 300 feet long gash, and five bulkheads were flooded within the three hours. They gradually filled up, weighing down the ship at one end and finally tilting it almost 90 degrees before it sank. A rescue ship, the S.S Carpathia, was alerted, but it could not arrive on time. Two-thirds of the Titanic’s passengers and crew died. (Mersey, 1912). It is clear that the safety of the passengers in first, second, and third class was not taken into consideration; the ship was a symbol of Edwardian psychological strength and stature (Tuckett D, 1976). Data provided by www.kaggle.com was used in our research, and our goal is to apply random forest classification to successfully predict the importance of factors that played a crucial role in determining the passengers’ chance of survival. Features such as title, sex, fare, class, and family density will be used to make the prediction. Two approaches were taken to compare the accuracy of different machine learning techniques. The techniques used in this project include logistic regression and random forest. Using these methods, we try to predict passengers’ survival rate. The test is based on a classification scenario that has a given a set of variables. One way to make a prediction would be to use logistic regression to test the accuracy and then apply random forest to compare the accuracy between the two models as well as to rank the variables against their importance of the chance of survival.
Data Set
The dataset was provided by the Kaggle website: 890 passenger samples were given under the training set, and there were associated labels as to whether the passengers survived or not. Each passenger’s name, sex, age, passenger class, and point of embarkation was provided. In the test data, 418 samples that used the same format were given. The dataset is not complete as, for several samples, one or many fields were empty. All sample points for sex and passenger class were complete. To standardize the data, we replaced missing values with the mean of the remaining data. The data on sex and class differences were obtained from the official British inquiry, which was conducted by Mersey (1912)).
Theoretical Hypotheses
Following Dacy y Kunreuther’s (1969) ground-breaking contribution, the short, medium, and long-term consequences of disasters have been analysed by economists. Psychologists and sociologists have stringently studied people’s behaviour during disasters and rejected the notion that in the event of a disaster people become stunned, panicked, and unable to act rationally. It has been found that sociological constructs such as loyalty and morality do not instantly break down under pressure. This is consistent with the empirical proof gathered in the field of behavioural economics (or economic mind-set), which ultimately shows that people do not exploit an opportunity when it can harm others. Conversely, they are often willing to help others: substantial research has proved that motives such as compassion, candour, and morality influence people’s behaviour. We developed nine hypotheses and categorized them under the headings “economic”, “social”, and “natural factors” so as they could be tested against the findings from the Titanic data.
Economic Determinants
Passengers were divided into three categories: 325 in the first class, 285 in second class, and 700 in third class. It is expected that the first clas passengers tried to gain the upper hand as they paid more money to get preferential treatment with respect to lifeboat access, and they were closer to the docks. Their financial situations gave them the freedom to bargain, and they sometimes even offered financial rewards to ensure their safety. They had closer contact with the high-ranking officers (particularly, First Officer Murdoch), and had better access to information about the ship.
Natural Determinants
In a life or death situation where the sole chance of surviving was to get on a lifeboat, a selfish homo economicus (concept in economic theory that portrays humans as narrow-minded agents) thinks in his self-interest first as a copying mechanism for survival in dire situations. People with greater physical ability, determined by age, would have a higher chance of survival and would have to expend lower marginal efforts in the event of such a disaster.
Social Determinants
The social fabric of society means that it is the norm that, in a life and death situation, women and children are to be saved first. There is no international maritime law that requires this be carried out, but humanitarian agencies often evacuate “vulnerable” civilians first such as women, children, and the elderly.
Statistical Analysis
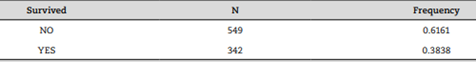
Men, women, and children who survived in each of the classes as well as the crew are shown as numbers and percentages in Table 4. The survived variable (independent) is used as a Bernoulli trial where a passenger or crewmember who survived in the trial set is encoded with the value of 1: approximately 61% of passengers and crew died.
Logistic regression was used to find the relationship between the dependent variable -survival, the independent variables - age, fare, title, sex, family density, class, embarked location, and cabin. It provided tests for the significance levels of differences in survival rates.
Table 1 Survival Frequency.
| Accuracy: Proportion of the total correct predictions. |
| Positive Predictive Value: Proportion of positive and correct cases. |
| Negative Predictive Value: Proportion of negative and correct cases. |
| Sensitivity: Proportion of positive cases and correctly identified. |
| Specificity: Proportion of negative cases and correctly identified. |
Source: Kaggle.com (Titanic: Machine Learning from Disaster)
Table 2 General characteristics of the confusion matrix.
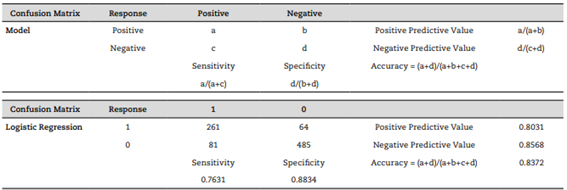
Source: Kaggle.com (Titanic: Machine Learning from Disaster).
Table 3 Confusion matrix for logistic regression.
Source: Kaggle.com (Titanic: Machine Learning from Disaster).
Table 4 Survival based on sex and class (W/C: women and children).
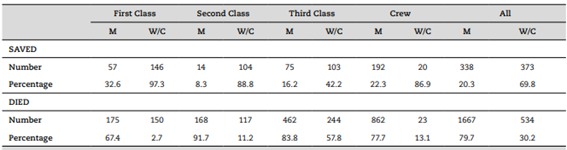
Source: Kaggle.com (Titanic: Machine Learning from Disaster).
Source: Kaggle.com (Titanic: Machine Learning from Disaster)
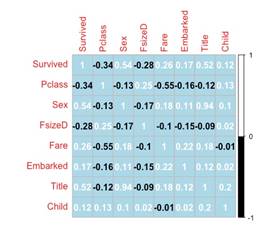
Figure 1 Co-relation coefficients between variables
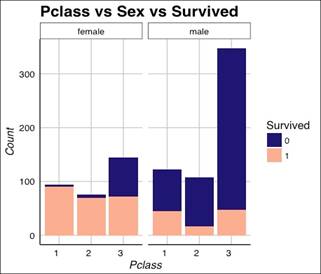
Emigrants on their way to the United States from Europe were predominantly in third class or steerage. Passengers were classified by the White Star Line into three categories: Non-British, Irish, and British. The figures are shown in Table 5. The survival rate was lowest among the third-class passengers; however, the passenger’s chances improved if she was female. Half of the toddlers and adolescents died, and the majority of deaths occurred in third class (Figure 3).
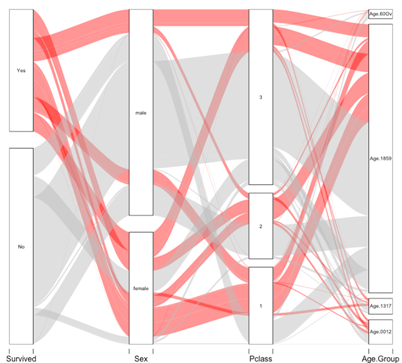
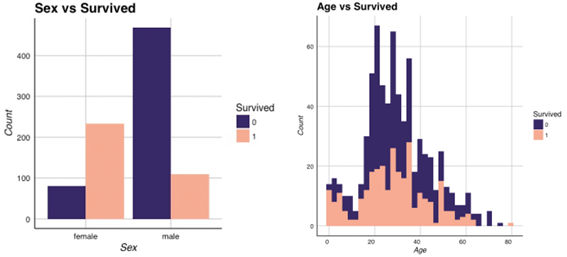
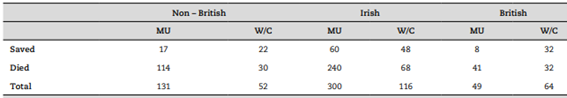
Table 6 Total Crew, April 11, 1912.
| Deck Department | 66 |
| Engine Department | 325 |
| Victualing Department | 494 |
| Total | 885 |
Source: Kaggle.com (Titanic: Machine Learning from Disaster).
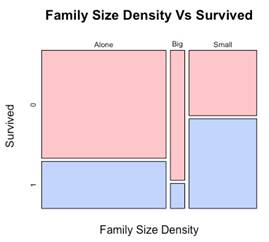
Figure 4 Mosaic of family size and survival.
Source: Kaggle.com (Titanic: Machine Learning from Disaster)
Figure 6 Passenger class and survival count.
Random forest
Sometimes, due to variability, decision trees have over-fitting, but if we increase the number and have them vote on the outcome, we can bypass this problem. For this reason, we use the random tree algorithm. For example, a male passenger from Queenstown who rode in second class: tree one and two would vote that he perished, but tree three votes that he survived. If we take a vote, it is 2 to 1 in favour of his demise, so we would classify this man as a casualty. Random forest trees are more complex as the nodes grow much deeper than the decision stumps; in fact, growing each tree far as possible is promoted. Although a source of randomness has to be introduced to make these trees different from one another as otherwise the decision tree will remain the same every time. The first step is to simulate a sample function in R: called bootstrap aggregating. The example is for a training set with 10 rows.
*Sample (2:11, replace = T)
(1) 7 2 8 2 4 10 10 5 5 8
Mean: 6.1
Median: 6
Using the sample for simulation, we should have 10 rows, but rows 2, 8, and 5 are repeated twice. Around 37% of the rows will be omitted from the sample, and with the repeated rows, each decision tree will be made differently. If the parameters are strong such as gender, then that variable will dominate. To get past this limitation, a second source of randomness is introduced by taking the square root of the number available. With respect to our sample of 10 variables, a subset of three variables will be proper. The selection process is changed for every node so that they do not have the gender variable fixed to create a biased dominance. For these two sources of randomness, a collection of unique trees sprung out, and each tree is called to process a classification for given passenger. In the case of missing variables, the algorithm creates a tree on the subset of the data and finally replaces the missing values.
Results and Discussion
If the overall error rate falls below 20%, the model is better prepared to predict death (red line) than survival (green line).
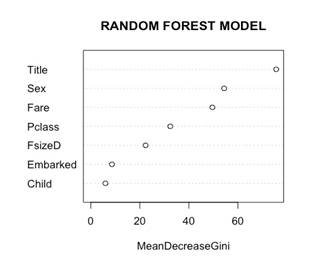
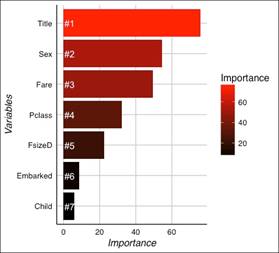
Machine learning is a process that helps us approach a new stage in computing, and this is an abstraction. In this paper, two machine learning approaches were used to find the determinants that played a significant role in predicting passengers’ survival. Since the variables present in the data set were related to the passengers’ social classifications, the study’s scope is sociological rather than technical. However, the algorithm provides us with solid evidence that title, sex, and fare were the top three variables that decided the fate of the passengers.
Source: Kaggle.com (Titanic: Machine Learning from Disaster)
Figure 7 Mean Gini coefficients (Homogeneity of nodes).
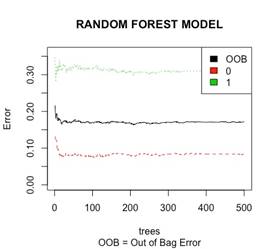
Table 7 Confusion Matrix for Random Forest.
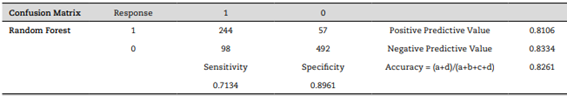
Source: Kaggle.com (Titanic: Machine Learning from Disaster).
Conclusions
The British Board of Trade Regulations stipulated the Titanic could sail without enough places for every passenger; thus, the lack of lifeboats on the Titanic was the major reason why there were only few survivors. The ship carried twenty boats, which provided refuge for 52% of the total passengers on the ship’s maiden voyage and 30% of the number of passengers when full (Lord W, 1956).
Passengers were hesitant to leave as they believed they were on an ‘unsinkable ship’; women and children were reluctant to part with their families. (Beesley L, 1912).
Women and children were more likely to survive because of the policy that favoured them and the scarcity of lifeboats: “the stewards and crew were marshalled to keep the line and prevent the male passengers from getting into the boats. Woman and children had the best chance of survival.
Class system and wealth played a major role in the factors that determined survival as passengers with a first-class ticket were close to the deck (and thus the lifeboats) than passengers who lived under the deck.
The policy of saving women and children was not stringently followed, which can be seen in the statistics that show most of the survivors were first-class passengers. “Allegations of special treatment were dealt with by the British inquiry which exonerated the men concerned” (Mersey, 1912).
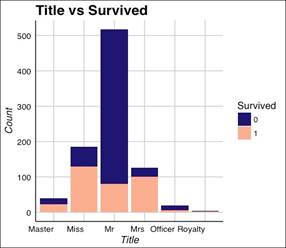
Title, sex, and fare were the most important factors when determining the chance of survival. The majority of survivors where from small families (Figure 4). Young people had the greatest chance of survival (Figure 3).

