English (pdf)
 Article in xml format
 Article references
 Send this article by e-mail
 Cited by SciELO
  Cited by Google
  Similars in
SciELO
Similars in
SciELO  Similars in Google
 Permalink
Introduction
Achieving good economic and social development is one of the main challenges that governments of every country face today. Growth must be inclusive in order to be beneficial to all within the economy (Li et al., 2023). Inclusive economic growth, first introduced by Kakwani and Pernia (2000), is economic growth that allows the poorest strata of society to participate and gain a benefit from economic activity. Lu et al. (2023) mention that several international conferences addressed the importance of inclusive growth, considering the social problems that economic development brings with it. Inclusive growth is relevant to economists due to its potential impact, because if applied appropriately, it can integrate different problems regarding distribution, development, and social welfare (Lachlan & Richard, 2023). Kuss et al. (2021) argue that inclusion is focused on creating equal opportunities in order to eradicate poverty and maintain steady growth. According to Topuz (2022), in developed countries, inequality would positively affect redistribution, but in low-income countries, it would not generate any change; similarly, in high-income countries, inequality increases the savings rate, while in low-income countries, it does not. Cervantes and Villaseñor (2021) argue that the enormous disparity in middle-income levels between countries is one of the world economy’s main challenges. The authors mention that, in the case of Latin America and the Caribbean, an income gap increased in the same period since “the average income of the richest countries went from 4.45 to 4.72 times higher than the income of the countries of the region.” While the average income in rich countries increased by about $12,300, the average income in Latin America and the Caribbean increased by about only $2,200. In this context, Latin America is well known as the unequal region in the world, mainly in terms of income (ECLAC, 2019). From 2000 to 2021, the GINI index for Latin America has only decreased from 0.53 to 0.46 (ECLAC, 2023). According to the ECLAC (2018), the Gini coefficient is considered an indicator to determine the relationship between growth and inequality. Likewise, the World Economic Forum (WEF, 2017) posits three dimensions to measure inclusive economic growth: (a) Growth and Development, (b) Inclusion, and (c) Intergenerational Equity and Sustainability.
Although globalisation and the development of technologies have boosted economic growth, the benefits have been distributed unevenly, causing unemployment, unfair remuneration, and high levels of inequality (Álvarez et al., 2021). However, Ajide et al. (2021) state that, from the perspective of neoclassical growth, globalisation can affect inclusive growth through foreign investment and trade integration. In addition, Kouladoum (2023) mentions that developing digital infrastructures can foster inclusive growth.
In this regard, Sen (2000) argues that what occurs with globalisation is that not all people have access to new opportunities since there are cases in which people are excluded from their old ways of life, but they are not included in new ones. International trade is important to ensure the development of a functioning and sustainable globalised world, and it is important to promote trade facilitation (Marceau & Parwani, 2021). In addition, an important part of sustainable development is inclusive economic growth (Kwilinski et al., 2023). Chinoda (2020) mentions that according to several theories of endogenous growth models, openness to trade can have a mixed effect on economic growth. Keho (2017) argues that since trade opening can promote economic growth in the long term, countries with greater trade openness are expected to perform better than those with less openness; developing countries would benefit from trade with developed countries. Similarly, Huang et al. (2022) consider that the effect that trade has on income inequality depends on how developed the country is and they also claim that there is strong evidence that trade decreases income inequality in middle- and high-income countries but that it is statistically insignificant for inequality in low-income countries.
The relevance of trade to inclusive economic growth is evident; however, it is also important to consider how it is carried out. Cervantes and Villaseñor (2021) argue that diversification of production and the ability to produce complex goods is more related to economic development than specialisation, supported by trade theories based on comparative advantages. From this perspective, developed countries export goods that others do not produce, always within a much more diversified basket of goods. Therefore, the developed countries compete with a wide range of products, whether value-added or not, while the least developed countries are not highly diversified, and their production is limited to non-specialised and highly competitive goods. They conclude that the “development of the productive capacities of a country based on the division of labour” is more efficient if the institutional design allows for a correct interaction between agents so that competition is increased through “a diversified production basket which at the same time contains unique, sophisticated or complex products” (p. 48). Along these lines, Guei and Le Roux (2019) mention that developing countries mainly export primary products, making them vulnerable to external shocks; however, international trade is seen as the way for a developing country to boost its economic growth. Hartmann (2017) affirms that countries exporting complex products have lower income inequality than those exporting simple products. Regarding Latin America, Arteaga et al. (2020) mention that commodities dominate the export baskets of South America because the region has a great variety of natural resources.
In the last 20 years, Peru had stable GDP growth with annual growth between 2% and 4% since 2014 (World Bank, 2022a). International trade played an important role in this economic growth from 2000 to 2021; trade as a percentage of the GDP has increased from 36% to 56%, remaining above 42% since 2004 (World Bank, 2022b). In 2021, the national GDP registered a growth of 13.5%, compared to the contraction of 11.1% experienced the previous year, in the middle of the conjuncture produced by COVID-19 (ECLAC, 2021). In the same way, trade was affected by the rapid spread of the virus and, as a result, affected the measures taken by governments (ECLAC, 2020). In 2020, the volume of Peruvian exports registered a variation of -17.1% compared to the previous year, while imports decreased by 11.8% (INEI, 2022). However, according to the National Institute of Statistics and Informatics (INEI), in 2021, the volume of domestic exports registered a variation compared to the previous year of 10.2%, while, on the import side, an increase of 24.4% was registered. However, in terms of inclusiveness, there was no similar improvement since in 2002, the Gini index was 0.54, and by 2021 it was reduced to only 0.42 (ECLAC, 2023). Despite the increase in Peruvian trade, the distribution of income and wealth has not improved in the country.
Given the foregoing, it is important to give evidence of the relationship between inclusive economic growth and international trade in Peru since, as we see, despite the sustained growth in recent years, and the growth of the country’s international trade, there has been no improvement in terms of equal income and wealth. Therefore, this research aims to know the relationship between inclusive economic growth and international trade in Peru between 2000 and 2021, taking into account seven indicators of inclusive economic growth proposed by the World Economic Forum (2017): income from work, poverty, the GINI index, GDP per capita, labour productivity, vulnerable employment rate, and life expectancy at birth.
Methodology
The research uses a general method that is hypothetical deductive, with a quantitative and basic type approach, explanatory level, and nonexperimental longitudinal design. The econometric methodology is the method of Ordinary Least Squares (OLS) for performing linear regressions between the Peruvian trade data with indicators of inclusive growth of the Peruvian economy.
Gujarati and Porter (2010) mention that the OLS method is one of the most popular and effective regression analyses. This method is based on the principle of least squares, and is based on the Gauss model, also called the classical linear regression model, which raises 7 assumptions on which the statistical properties of the OLS are based.
Inclusive economic growth is measured by the pillars of growth and development (per capita GDP, labour productivity, employment, and life expectancy) and inclusion (income concentration and poverty) of the Inclusive Development Index (IDI) introduced in 2017 by the World Economic Forum). The methodology consists of three (3) stages based on Greene (2012).
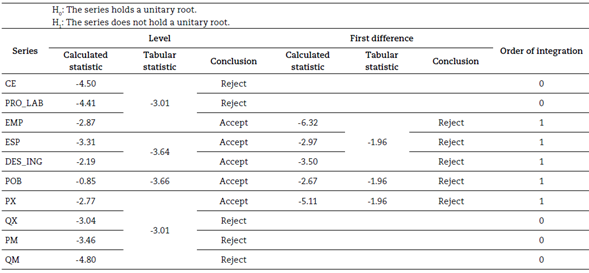
Stage 1: Analysis of seasonality
The application of the Phillips-Perron test requires estimating the model 1:
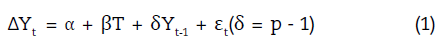
Where Y is the series in analysis, Δ is the difference operator, α is the constant, T is the trend, and ε the white noise. The constant or trend is included due to a previous average test, and the trend is observed graphically.
Then the hypothesis is contrasted:
H0: δ = 0 (p = 1, the series has a unit root or is nonstationary)
H1: δ < 0 (p<1, the series does not have a unit root nor is it stationary)
The calculated statistic is given by (2):

Where t δ is the t-statistic of δ, y0 is a consistent estimate of the error variance, f0 is the residual spectrum estimator at the null frequency, N is the number of observations, ESδ is the standard error of δ, and ES R is the standard regression error.
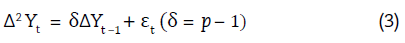
If the PP statistic exceeds the critical value of MacKinnon by 5%, H0 is rejected. It should be noted that the test model corresponds to the analysis of the series at the level if it was its first difference; the model varies toom (3):
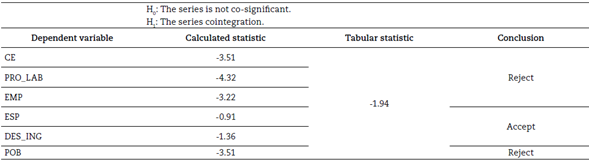
Step 2: A cointegration analysis
Once the seasonality of the series is determined and, therefore, its order of integration (the number of times that must be differentiated to make it stationary), the Engle- Granger test is performed estimating (4):
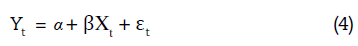
Where X and Y are the variables in analysis and ε is the residue.
The waste series (ε) is subjected to the Dickey-Fuller unit root test with the specification (5):
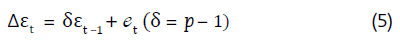
Where e is white noise and hypotheses:
H0: δ = 0 (p = 1, series do not cointegrate)
H1: δ < 0 (p < 1, series cointegrate)
The calculated statistic is defined as (6):
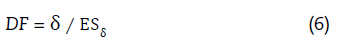
Where ESδ is the standard error of the δ parameter. If the DF statistic exceeds the critical value Tau by 5%, H0 is rejected.
Step 3: Multiple linear regression analysis and validation
Estimated via Ordinary Least Squares (OLS) (7, 8, 9, 10, 11, 12):
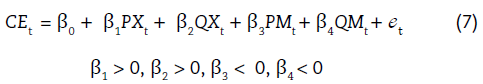


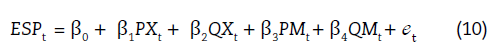

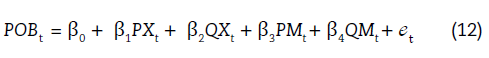
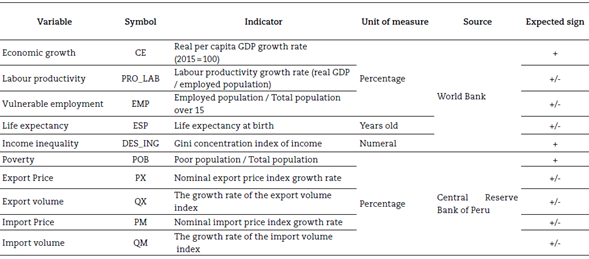
Where CE is economic growth, PRO_LAB is labour productivity, EMP is vulnerable employment, ESP is life expectancy, DES_ING is income inequality, POB is poverty, PX is export price, QX is export volume, PM is the import price, QM is the import volume, and t is the time (2000-2021). Table 1 summarises the operationalisation of the research variables.
Validation covers statistical and econometric aspects:
Statistical validation
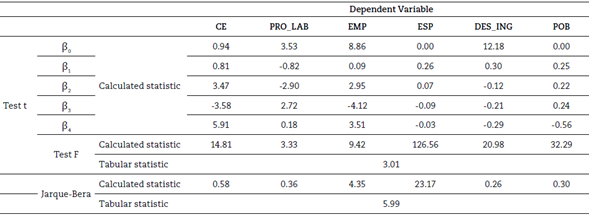
The first assumption analysed is the normality of the error using the Jarque-Bera test under the hypotheses:
H0: et approximately follows a normal distribution
H1: et does not follow a normal distribution
The calculated statistic is: (13)
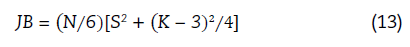
Where N is the number of observations, S is the coefficient of asymmetry, and K is the coefficient of courtesies. If this statistic exceeds the critical value (x2 2,5% = 5.99), H0 is rejected, indicating possible specification problems and preventing subsequent statistical tests from being invalid.
Then, the statistical significance of the estimated parameters is studied. At the individual level, the t-test is used under the hypotheses:
H0: βi = 0 ∀ i = 0, ..., 4 (the variable is not significant)
H1: βi ≠ 0 ∀ i = 0, ..., 4 (the variable is significant)
The calculated statistic is obtained as follows: (14)
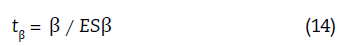
Where β is the estimated parameter and where ESβ is the standard error associated with that parameter.
If the calculated statistic exceeds the critical value (t17, 2.5% = 2.11), H0 is rejected, indicating that the variable in question is statistically significant at 5%.
On the other hand, the joint statistical significance is studied with the F test under the hypotheses:
H0: β1 = β2 = β3 = β4 = 0 (no linear relationship)
H1: at least one β ≠ 0 (linear relationship with at least one X)
The calculated statistic is obtained as follows: (15)

Where R 2 is the coefficient of determination or goodness of fit of the estimated model, N is the number of observations, and K is the number of explanatory variables included.
When the calculated statistic exceeds the critical value (F4, 16, 5% = 3.01), H0 is rejected.
Econometric validation
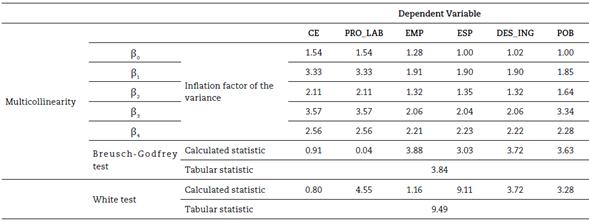
The assumptions of low multicollinearity, non-correlation, and homoscedasticity are validated. The degree of multicollinearity is tested with the variance inflation factor (VIF), defined as: (16)
Where R2 j is the coefficient of determination between the explanatory variable j and the remainder of the explanatory variables, a VIF above five (5) indicates that the variable under analysis highly correlates with the other explanatory variables.
On the other hand, the first-order autocorrelation is tested under the criterion of Breusch-Godfrey, whose hypotheses are:
H0: No first-order autocorrelation
H1: First-order autocorrelation exists
The equation is estimated as follows: (17)

Where e is the residue associated with each model and v is the white noise. Then the statistic is calculated as follows: (18)
Where N is the number of observations, and R2 T is the coefficient of determination of the test equation.
If the calculated statistic exceeds the critical value (χ2 1, 5% = 3.84), H0 is rejected.
Finally, the hypothesis of homoscedasticity is validated with the White test without cross terms whose hypotheses are:
H0: Homoscedasticity exists
H1: Heteroscedasticity exists
The calculated statistic is: (19)

Where N is the number of observations, and R2 T is the coefficient of determination of the equation: (20)
Where e is the residue associated with each model and v is the white noise. If the calculated statistic exceeds the critical value (χ2 4, 5% = 9.49), H0 is rejected.
When a first-order autocorrelation is detected, it is solved by incorporating a first-order autoregressive process (AR(1)) into the error (21).

Where Y is the dependent variable of interest and v is the white noise. The estimate is made with the Generalised Least Squares (GLS) method.
The following hypotheses are proposed:
H1. There is a positive relationship between international trade in Peru and income from work.
H2. There is a positive relationship between international trade in Peru and poverty.
H3. There is a positive relationship between international trade in Peru and the Gini index.
H4. There is a positive relationship between international trade in Peru and GDP per capita.
H5. There is a positive relationship between international trade in Peru and labour productivity.
H6. There is a positive relationship between international trade in Peru and employment.
H7. There is a positive relationship between international trade in Peru and life expectancy at birth.
Results
The aim of this study is to analyse the relationship between inclusive economic growth and international trade in Peru between 2000 and 2021, considering indicators such as income from work, poverty, the GINI index, GDP per capita, labour productivity, the vulnerable employment rate, and life expectancy at birth.
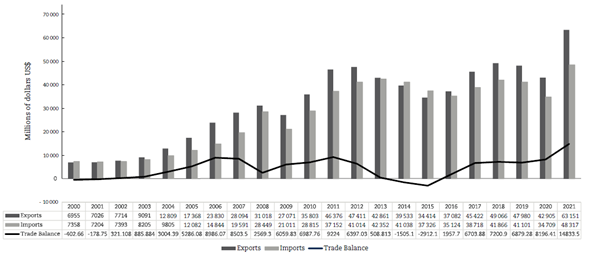
Peru’s continued economic growth is mainly due to international trade. According to official INEI data, in 2021, Peru exported 63 151 million dollars and imported 48 317 million dollars, as shown in Figure 1.
However, in terms of inclusion the situation is different. Figures 2 and 3 show the trade evolution of Peru and the distribution of income and wealth for the top 1%, top 10%, and bottom 50% of Peruvian society in the period 2000 to 2021. It is observed that, despite the increase in Peruvian trade, the distribution of income and wealth has not improved in the country since these are concentrated in 1% and 10% of the population with higher incomes, a situation that places them in a better position than 50% of the lower-income population.
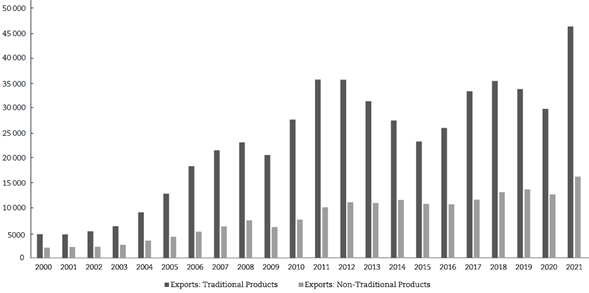
Taking this into account, we will analyse trade in Peru. Over the years, Peruvian exports have been composed mainly of traditional products. In 2021, the FOB value of Peru’s exports to the world was US$ 63 150.84 million, of which US$ 46 585.14 million corresponded to traditional products and only US$ 16 372.71 million to non-traditional products, as shown in Figure 4.
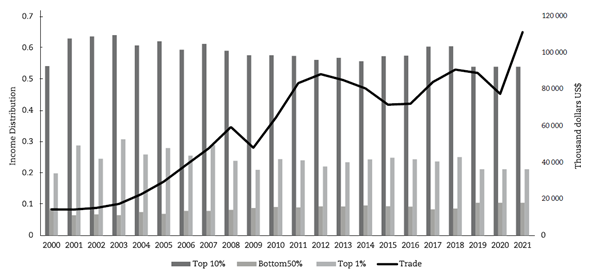
Source: data from Trademap (2022), World Integrated Trade Solution (2020), and The World Inequality Database (2020).
Figure 2 Income and Trade Distribution Peru 2000-2021
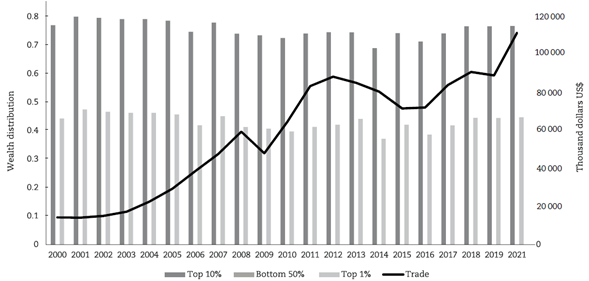
Source: Data from Trademap (2022), World Integrated Trade Solution (2020), and The World Inequality Database (2020).
Figure 3 Distribution of Wealth and Trade Peru 2000-2021
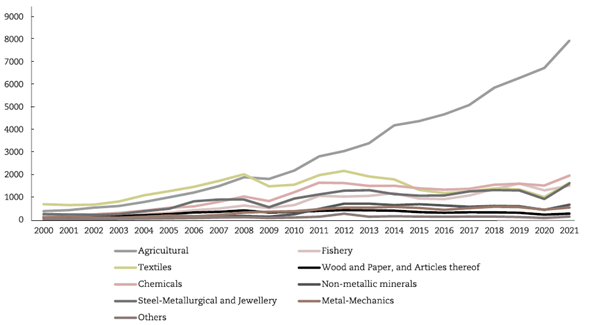
Over the years, mining products have stood out among exports of traditional products, as shown in Figure 5. In 2021, the total FOB value in exported mining products was US$ 39 680.43 million, followed by US$ 3710.91 million in oil and natural gas, US$ 2339.46 million in fishery products, and US$ 854.33 million in agricultural products. Among non-traditional products, agricultural products stand out because, in 2021, the total FOB value exported was US$ 7955.12 million, as shown in Figure 6.
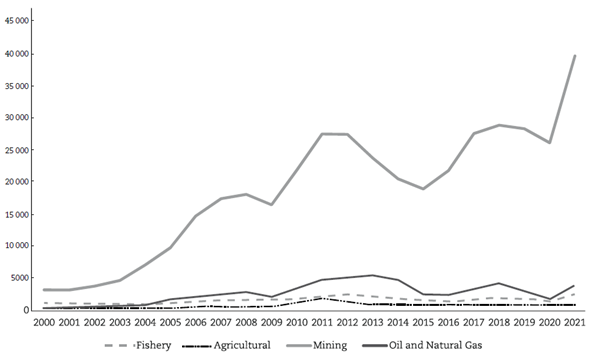
Source: Adapted from BCRP (2022).
Figure 5 Exports by product group, FOB values (million US$) - Traditional products
Source: Adapted from BCRP (2022).
Figure 6 Exports by product group - FOB values (million US$) - Non-traditional products
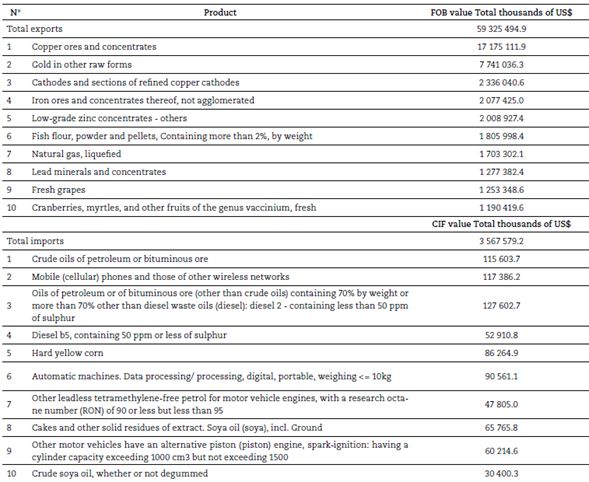
In 2000, the main exported product was refined copper cathode including cathode sections; from 2001 to 2013, it was gold in other raw forms; and from 2014, copper ores and concentrates, which reached a FOB value of US$ 17 175 million dollars in 2021. On the other hand, since 2000, crude oil or oils have been the main import product, with a CIF value of US$ 115 million in 2021. Table 2 shows Peru’s ten main export and import products in 2021.
Between 2005 and 2021, China and the United States were the main destination countries and source countries for domestic exports and imports, accounting for 46.5% and 48% of the total volume of exports and imports in 2021, respectively (INEI, 2022). Tables 3 and 4 present the main product exported and imported by the main trading partner each year between 2005 and 2021. Concerning exports, most of the main products exported are traditional products belonging to the mining sector. On the other hand, the main imported products are traditional, such as crude petroleum oils, and non-traditional, such as mobile phones or vehicles.
Table 3 Main trading partner and product exported by Peru 2005-2021
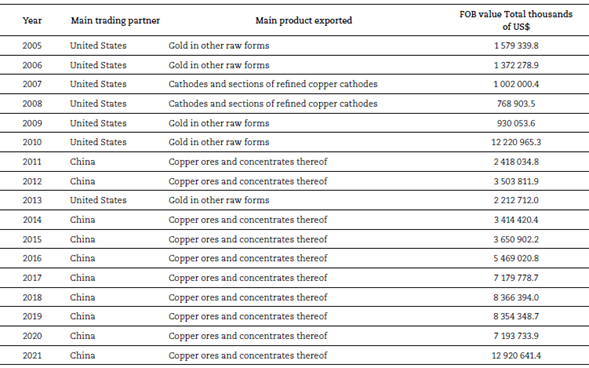
Source: Adapted from SUNAT (2022).
Table 4 Main trading partner and product imported by Peru 2005-2021
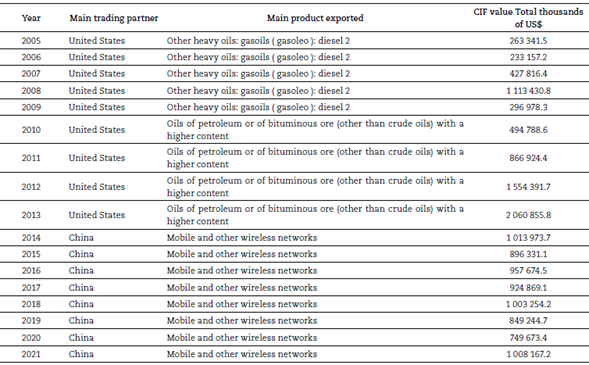
Source: Adapted from SUNAT (2022).
Of the series studied (see Appendix 1), economic growth, labour productivity, export volume, import price, and import volume are stationary at (integrated zero order, I(0)); the others needed a first difference to be stationary (integrated order one, I(1)). Cointegration (see Appendix 2) lies only between economic growth, labour productivity, vulnerable employment, poverty, and international trade (prices and volumes). The absence of cointegration between the variables prevents the regression between them via Ordinary Least Squares from being invalid (Johnston & DiNardo, 1963); therefore, models (10) and (11) are not interpretable.
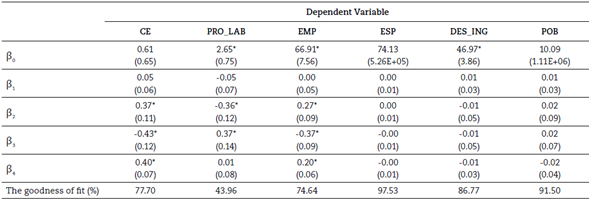
The goodness of adjustment (R2) percentages of the models associated with economic growth, labour productivity, and vulnerable employment are 77.70%, 43.96%, and 74.64%, respectively; the model associated with poverty is not interpretable due to the lack of individual statistical significance (see Appendix 3). There is, for the period 2000-2021, a long-term positive relationship between economic growth and export volume (β2 = 0.37) and import volume (β4 = 0.40), likewise between vulnerable employment and export volume (β2 = 0.27) and import volume (β4 = 0.20). In contrast, the labour productivity ratio to export volume is negative (β2 = -0.36). Regarding the prices of international trade, only the import price is significant, the relationship between this and economic growth (β3 = -0.43) and vulnerable employment (β3 = -0.37) being negative but positive with labour productivity (β3 = 0.37) (see Appendix 4 y 5).
Discussion
This study estimates the relationship between Peru’s international trade and inclusive economic growth between 2000 and 2021.
First, the results of the research show that there is a positive long-term relationship between economic growth and export volume. Furthermore, Kang et al. (2017) evidenced that trade is a significant determinant of 1% of GDP per capita. In addition, Nguyen Viet (2014) found that trade facilitation increases GDP per capita.
Second, there was evidence of a long-term positive relationship between vulnerable employment and export volume. In contrast, Abada et al. (2021) find that inclusive economic growth decreases by 13.84% compared to additional unemployment by 1%; confirmed by the studies of Cysne and Turchick (2012) and Aoyagi and Ganelli (2015). The latter estimates that inclusive economic growth increases by 0.72% if the unemployment rate is reduced by 1%.
Thirdly, there is a negative relationship between labour productivity and export volume. In contrast, Asada (2020) evidenced a significant relationship between labour productivity and international trade at 1%.
Fourth, there is no statistical significance for the poverty variable. Moreover, Fambeu (2021) showed that the openness to trade is not significant for poverty since there is no high correlation between both variables. In contrast, Nguyen Viet (2014) found that trade facilitation reduces poverty.
Finally, it was determined that there is no cointegration between life expectancy at birth and international trade. In contrast, Tahir (2020) found that commercial openness had a positive and significant impact of 1% on the life expectancy of the population of China. It was also determined that there is no cointegration between the variables of income distribution and international trade. In contrast, Nguyen Viet (2014) found that improved trade facilitation reduces inequality.
The methodology used in the study generates results in favour of a relationship between inclusive economic growth and international trade for the Peruvian economy during the period 2000-2021. Along these lines, Khan et al. (2016) demonstrated the positive and significant impact of trade opening on inclusive economic trade. In addition, Agyei and Idan (2022) demonstrated that trade opening has a positive and significant 5% effect on inclusive growth. On the contrary, Osabohien et al. (2021) found that trade opening decreases inclusive growth by 1.91%.
Conclusions
Analysing inclusive growth in Peru is important to shed light on the inequality of the Peruvian society. Given the econometric analysis, it can be concluded that the growth of International Trade in Peru has a positive relationship with two of the seven indicators of inclusive economic growth analysed: real GDP per capita and Vulnerable Employment. On the contrary, it has a negative relationship with Labour Productivity. There is no statistical significance for the variable poverty. There is no cointegration between Peruvian International Trade and Life Expectancy at Birth or Income Distribution. Therefore, it is concluded that inclusive economic growth is affected by the growth of Peru-China International Trade.
There are three (3) limitations of the investigation. The first is given by the number of observations (N < 30); the estimates may lack consistency. The estimated parameters can only be interpreted with regards to the relationship between inclusive economic growth and international trade, but not concerning magnitude of the impact. Finally, it is not known whether the relationship is unidirectional (from international trade towards inclusive economic growth or vice versa) or bidirectional (inclusive economic growth and international trade feedback); for this purpose, it is recommended that future research use the causality methodology, in the sense of Granger1 2.