


 English (pdf)
 Article in xml format
 Article references
 Send this article by e-mail
 Cited by SciELO
  Cited by Google
  Similars in
SciELO
Similars in
SciELO  Similars in Google
 Permalink
Higher education institutions (HEIs) in Russia carry out student training on three programs: the bachelor (four years of study), specialist degree (five years), and master's degree (two to three years). The structure of higher education in Russia includes institutions such as universities, academies, institutes, and higher schools. The largest HEIs, along with the main campus, also have branches located in other cities. In Russia, there are generally three categories of teachers in HEIs. The first category includes teachers who have defended their doctoral dissertation and hold a Doctor of Science (DSc) degree. The second category includes people who have defended their dissertation candidacy in science and hold a PhD degree. It should be noted that a doctoral dissertation in Russia can be defended only if you have a PhD degree. Teachers of HEIs who belong to the third category do not have a DSc nor a PhD degree. Having a DSc degree makes it possible to hold the position of full professor. Teachers who have a PhD degree hold associate professor positions. Teachers belonging to the third category occupy the positions of assistant and senior lector.
To date, the sphere of higher education in Russia has undergone a significant development. In 2020, there were 1259 specialized institutions operating in this economic sector (Federal State Statistics Service, 2021). Out of the total number of HEIs, 62% are state-owned, and 38% are private. The total number of teachers working at universities and other HEIs was 223 088. Out of these, 35 039 have DSc degrees, and 129 328 have PhD degrees. The total number of students enrolled in higher education programs in 2020 was 4 049 333. The two main types of student training in higher education programs in Russia were full-time and part-time. Out of the total number of students who received higher education in 2020, 60% were full-time students and 40% were part-time students.
The increasing role of higher education (Jaspers, 1960) contributes to the significant social and economic development of modern states. In developed and developing countries, both universities and other HIEs have become widespread.
In the twenty-first century, most states have created conditions that ensure mass access of the population to higher education (Guri-Rosenblit et al., 2007). The total number of students in all countries in 2016 was 218 million, which is 1.5 times more than in 2006 (Cour des Comptes, 2019). To solve the problems of higher education, the availability of pedagogical staff capable of teaching students according to appropriate programs is a necessary condition. Taking this into account, one of the urgent scientific problems is the assessment of indicators to characterize the staff: professors, associate professors, and other categories of teachers who ensure the availability of higher education (Douglas, 2011; Stiglitz, 2014). Our research aimed to this issue. Studying the current level of capability to solve this problem is important for both state bodies that regulate activities in this area, and directly for potential students.
Despite the extensive research on the problem of the development of higher education, until now, not enough attention has been paid to the regional peculiarities of solving this problem. The presence of institutions in the regions that teach students according to relevant programs (Abel & Deitz, 2011; Ciriaci, 2014) increases the attractiveness of the regions, positively affects their economic growth, and, most importantly, ensures the retention of school graduates in the regional labor market. All this determines the increased interest in the study of regional aspects of the development of higher education. Our article responds to the calls made in several scientific publications (Cervantes, 2017; Unger & Polt, 2017) to study the existing features of higher education by region.
The purpose of our study was to assess the indicators that characterize the number of teaching staff at universities and other HEIs in the regions of Russia. Our paper is aimed at obtaining a certain empirical and methodological contribution to the knowledge of the presence of science personnel in the regions that teach students in higher education programs. This contribution consists of the method proposed by the author for modeling the estimation of the number of professors and teachers in universities and other HEIs in the regions of Russia using the density functions of the normal distribution. The empirical contribution is related to the determination of the average values and standard deviations by region of indicators such as: number of teachers working at universities and HEIs per thousand residents of the region, proportion of professors in the whole number of teachers, proportion of associate professors in the whole number of teachers, and number of teachers per hundred students. In addition, the regions with the maximum and minimum values of these indicators are determined.
Literature review
Several recent scientific publications have been devoted to the problem of assessing aspects of the development of higher education in Russia such as the number of the pedagogical staff of higher education institutions and the current ratio of the number of teachers and students. A brief description of these publications is given in table 1.
Based on the information given in table 1, it can be stated that the problem of research on the number of teachers who work in higher education programs is relevant in Russia. Most of the reviewed studies analyzed the number of teachers, of students, and the number of institutions in Russia as a whole. At the same time, a comprehensive assessment of the distribution of the number of teachers in all regions of Russia has not been sufficiently reflected in scientific publications. It can be noted that a comparative analysis of relative indicators that allow us to assess the regional characteristics of HEIs was not carried out in most studies. Thus, absolute indicators were given in 70% of the studies shown in the table. Taking this into account, it seems appropriate to conduct a comparative analysis of the existing relative-specific-indicators that characterize the achieved level of activity of teaching staff in all regions of Russia.
Methodology
The pedagogical staff in HEIs considered in this paper carried out training of students in 2020. The bachelor, the specialist degree, and master's degree programs were considered.
The research process included fourth stages.
At the first stage, initial data were set to characterize: the number of universities and other HEIs, the number of teaching staff by region in 2020, and the number of students enrolled in higher education programs that year. In addition, empirical data on the number of working-age residents in these regions were collected.
At the second stage, we calculated indicators that characterize: the number of teachers per thousand working-age residents of each of the regions, the average number of teachers per HEI in the region, the proportion of teachers who have a DSc and PhD degree in the number of teachers working in HEIs in the region, and the number of students per teacher working in HEIs.
At the third stage, the distribution of indicators by region was assessed based on the development of mathematical models.
At the fourth stage, the average values of indicators for the regions of Russia and the ranges in which the values of these indicators are located for most of them were determined.
The study used official statistical information for 2020 on the number of HEIs and teachers in the 82 regions of Russia (Ministry of Science and Higher Education of the Russian Federation, 2021). In addition, we used empirical data on the population for each region in 2020 (Federal State Statistics Service, 2021).
In our study, three hypotheses were tested:
The pedagogical staff providing training for students in higher education programs is currently present in all regions of Russia.
The values of indicators by region have a small variation-that is, they are homogeneous.
The regions characterized by the maximum and minimum values for each of the four indicators are located in different federal districts.
The assessment of the values of the four considered indicators was carried out on the basis of the economic and mathematical modeling of the initial empirical data. As models, we used the density functions of the normal distribution. The method for developing them and estimating the values of relative cost indicators was proposed by the author. Some aspects of the use of the methodology are presented in the works of Pinkovetskaia and Slepova (2018) and Pinkovetskaia et al. (2021). During the development of the functions, the initial empirical data were grouped according to the ranges of changes in the values of the indicators. These data groups can be geometrically represented in the form of corresponding histograms. Data approximation using normal distribution functions was carried out using generally accepted statistical methods. It is important to note that the average values of the considered indicators and their standard deviations for the density functions of the normal distribution were displayed in the formulas of the developed functions themselves. Therefore, by constructing a specific function, we get the specified parameters of the considered indicators without additional calculations.
The obtained functions allowed us to determine the average values of each of the four indicators for the regions under consideration, and the ranges of their change characteristic of most regions. In addition, the study identified regions in which the considered indicators have values above the upper and below the lower boundaries of the ranges. The boundaries of the indicator range for 68% of the regions were determined based on the average values of the indicators and the corresponding standard deviations. The lower bound of the interval is equal to the difference between the mean and the standard deviation, and the upper bound is equal to their sum.
Modeling and results
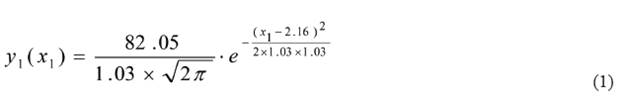
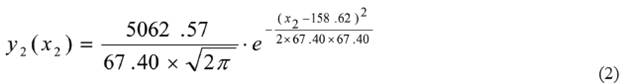
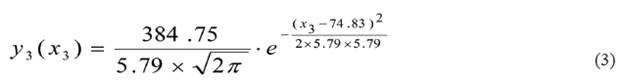
During the computational experiment, economic and mathematical modeling was carried out on the basis of empirical data. The models that describe the distributions y 1 ; y 2 ; y 3 ; y4 of the four indicators x 1 ; x2 , %; X3 , %; x4 across all 82 Russian regions are shown below:
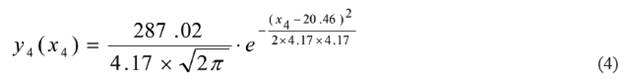
the proportion of teachers who have a DSc and PhD degree in the number of teachers working in HEIs in the region:
We tested the quality of functions 1 to 4 using criteria of the Kolmogorov-Smirnov, the Pearson, and the Shapiro-Wilk tests. Principles of using these criteria are given in the scientific literature (Afeez et al., 2018; Rahman & Wu, 2013; Razali & Yap, 2011; Seier & Bonett, 2002; Yap & Sim, 2011; Yazici & Asma, 2007). Calculated values of criteria are shown in table 2.
Information given in column 2 of table 2 showed that all calculated values are less than the critical value in the Kolmogorov-Smirnov test (0.174) at significant level equal 0.05. Data in column 3 are less than the critical value of the Pearson criterion (9.49). Data in column 4 exceed the critical value 0.93 of the Shapiro-Wilk test with significant level of 0.01. Thus, the computational experiment showed that all four developed functions have high quality.
At the next stage of the study, the values of indicators that characterize the number of pedagogical personnel working at universities and other HEIs in the regions of Russia were determined. The values of the indicators, the average by region, are shown in column 2 of table 3. The average values were determined on the base of functions 1 to 4. The third column indicates the standard deviation for discussing indicators. The values of the indicators that characterize the upper and lower boundaries of the intervals corresponding to most regions are shown in column 4. We calculated both the lower limits as the difference between the average value and the standard deviation, and the upper limits as the sum of the average value and the standard deviation.
Discussion
An analysis of empirical data for 2020 showed that there are HEIs in all 82 regions of Russia. Accordingly, the teaching staff was also in each region. Thus, the first hypothesis was confirmed.
The data in table 3 show that the average number of teachers in all regions of Russia was almost 2.2 per thousand residents of working age. In most regions, the values of this indicator were in the range from 1.1 to 3.2 in 2020.
On average, there were 158.6 people belonging to the scientific and pedagogical staff per HEI in all regions. The values of indicators for most regions varied from 91.2 to 226.0 teachers. The relatively small value of the number of teaching staff per HEI is due to the fact that in the regions, along with independent universities, there is a large number of relatively small branches providing educational services. A characteristic feature of these branches is their narrow specialization in certain areas of student training. This specialization follows from the industry affiliation of enterprises located in specific cities.
The average value for the regions of Russia of the proportion of teachers who have DSc and PhD degrees working in HEIs in 2020 amounted to almost 75% of the total number of teachers of HEIs. That is, three out of every four teachers have an academic degree. The values of this indicator, typical for most regions, ranged from 69% to 80%. It should be noted that by now, even in regions where there are difficulties with the training of highly qualified teachers (DSc and PhD), their share in the total number of teachers exceeded 55%.
The average value of the number of students per teacher working in HEIs in all regions of Russia was 20.5. The values of this indicator, typical for most regions, ranged from 16.3 to 24.6 students. This is slightly more than the average values for OECD countries, which range from 10 to 20 students per teacher (OECD, 2019).
To test hypothesis 2 on the differentiation of indicators by region, an analysis of the degree of variation of each indicator presented in table 3 was carried out. To do this, we used the standard deviations shown in column 3. The variation indices are as follows:
for the first indicator: 48%.
for the second indicator: 42%.
for the third indicator: 8%.
for the fourth indicator: 20%.
The analysis showed that there was no significant-more than 33%-differentiation of the values of two of the four indicators in the regions under consideration. That is, hypothesis 2 about the homogeneity of the values of indicators by region was partially confirmed.
The next step was to determine the regions of Russia in which the maximum and minimum values of each indicator were marked. In this case, the maximum values are those that exceed the upper limits of the ranges specified in column 4 of table 3, and the minimum values are those that are less than the lower limits of the specified ranges. The results of this analysis are shown in table 4. Along with the lists of regions, this table also shows the values of indicators by region and the federal districts of the regions to which they belong.
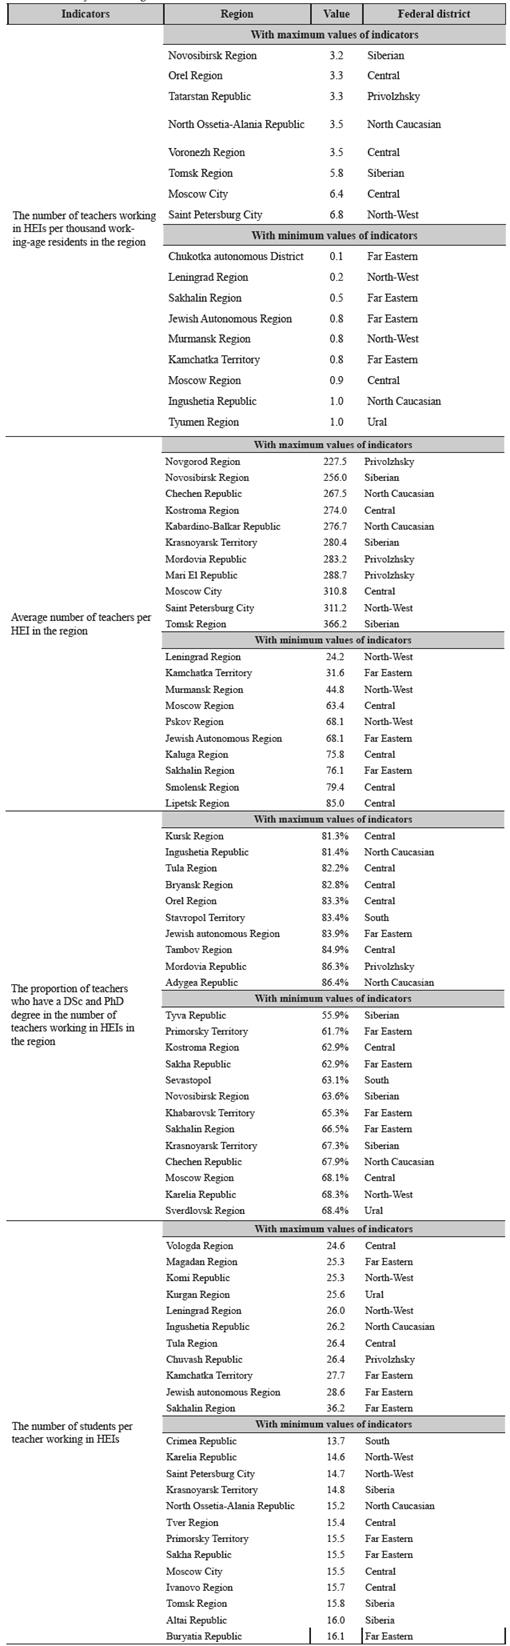
Table 4 provides information on the values of indicators for each region and their territorial location. The analysis of this information showed that there is no connection between the maximum and minimum values of the indicators and the territorial location of the regions. That is, the regions with high and low values of indicators are located in different federal districts. Thus, we can confirm hypothesis 3.
Conclusion
In general, our research makes several important contributions to the knowledge of the territorial features of the development of higher education in Russia. First, it was found that teachers worked in 2020 in HEIs that were located in all 82 regions of Russia without exception. Accordingly, residents of each region could study in an accessible proximity to their place of residence. During the study, a method was proposed for evaluating four indicators that characterize the activity of teachers in HEIs using the density functions of the normal distribution. Based on the proposed methodology, the distribution of the corresponding indicators was estimated for all 82 regions of Russia. The results of the computational experiment showed that, on average, there was slightly more than two teachers working in HEIs per thousand working-age residents in the regions. We demonstrated that on average the number of teachers per HEI in the region is 158. It is proved that on average the proportion of teachers who have a DSc and PhD degree in the number of teachers is almost 75%. In universities and HEIs, on average, the number of students per teacher is more than 20.
The analysis showed that there was significant differentiation of the values of two indicators by region: the number of teachers working in HEIs per thousand working-age residents in the region and the average number of teachers per HEI in the region. The regions that were characterized by the maximum and minimum values of the four considered indicators were identified. The study showed that the territorial location of the regions does not significantly affect the maximum and minimum values of the indicators.
The practical significance of the study for the government is that they now can consider the territorial features in the development of higher education in the regions of Russia. The results of the work can be used in the activities of federal and regional structures related to the support of educational processes, for justifying their planned activities and improving the quality of higher education by increasing the share of highly qualified teachers. For potential students, data on the distribution of teaching staff by region may be of particular interest. The new knowledge gained is of interest and can be used in the educational process at universities.
The study had no limits on empirical data because it was based on official statistical information of all 82 regions of Russia. Further research may be aimed at establishing gender characteristics and describing the number of teachers in HEIs in Russia.

