English (pdf)
 Article in xml format
 Article references
 Send this article by e-mail
 Cited by SciELO
  Cited by Google
  Similars in
SciELO
Similars in
SciELO  Similars in Google
 Permalink
INTRODUCTION
Due to its preeminent status as an intermediary in the saving-investment process, as well as to its subsequent relevance in the assignment of resources, economic growth, and income distribution, the financial sector has been a recurring topic in both empirical and non-empirical research since the beginning of the twentieth century (Caprio & Honohan, 2001; King & Levine, 1993; Levine, 1997).
From a theoretical standpoint, both classical and endogenous growth theories assume equality between savings and investment, implicitly meaning that the banking system is capable of moving saved resources to investment through a competitive market.
When it comes to income distribution, the banking system acquires similar relevance as in previous theories, given that an inclusive banking system contributes to breaking up poverty cycles. Since individuals at the lowest income levels are severely constrained to save-given that a great share of their earnings goes directly to subsistence consumption-, access to finance is a key tool for them to invest, achieving this way larger incomes in later periods.
Increased competition in the commercial banking market, as in any other market, drives overall efficiency, lowers prices, and expands the choices of goods and services offered. In particular, a competitive banking system, as opposed to an oligopoly, decreases net-interest margins, provides low-cost banking commissions, delivers channels to fund more productive projects, and expands the pool of customers, leading to a range of benefits, which include greater competitiveness of industries in need of financial services, expanded national production, and improved consumer surplus and social welfare.
Building on the arguments described above, the motivation for any effort to achieve a commercial banking system with the conditions of a competitive market becomes evident. Within this line, the present research aims to assess competition conditions in the Mexican commercial banking market, estimate the observed market power, and integrate their analyses through microeconomic theory. This way, it seeks to fill the existent research vacuum on this topic.
The study estimates market power using the Lerner index. Using the presented methodology, it is necessary to estimate the price elasticity of demand for bank credit, the results of which are also exposed. In order to provide a robust analysis, the estimated economic competition indicators are closely related to market power, in such a way that the effects of the exercise of market power can be inferred.
Our main results indicate a low price elasticity of demand for bank credit, as well as the existence and exercise of high market power by major banks, yielding the following Lerner indexes: BBVA Bancomer (0.68), Santander (0.44), Banamex (0.39), Banorte (0.36), HSBC (0.25), Scotiabank (0.19), and Inbursa (0.11); for small banks (0.00); and for the weighted average of commercial banks as a whole (0.34).
These results are supported by the economic competition indicators, which expose the existence of barriers to entry, a high level of concentration, high relative prices charged by major banks, their relatively high national and international profitability, and the lack of access of a large proportion of economic agents to commercial banking services.
It should be acknowledged that while one of the strengths of the present research is estimating diverse indicators, including the price elasticity of demand, for a long-run period, namely from January 2001 to December 2019, the availability of data constrains the estimation of some of them to half of such period, as stated in the footnote of each figure.
This research proceeds as follows: Section II presents the literature review; Section III lays out the theoretical framework; Section IV presents some indicators that are necessary to evaluate competition conditions in the Mexican commercial banking market; Section V estimates the price elasticity of demand for bank credit, the market power of the studied banks, and the weighted average of this power in the market under study; and, finally, Section VI offers some conclusions followed by the sources consulted.
LITERATURE REVIEW
Previous approaches that analyze competition conditions in the Mexican commercial banking market include the extensive study of Mexico's Federal Economic Competition Commission (Comisión Federal de Competencia Económica, 2014) regarding competition conditions on the financial sector and its markets, as well as prior research carried out by the Economic Commission for Latin America and the Caribbean (Comisión Económica para América Latina y el Caribe, 2006).
Both approaches identify the existence of barriers to free market access and economic competition in the market under study.
A study by Gruben and McComb (2003) also examined competition conditions, but pre and post the liberalization of the banking industry in Mexico, finding that in some cases bankers incur losses in favor of future returns, as it was the case during the privatization of Mexican banking in the 1990s. There exists another related institutional research (Banco de México, 2013; Consejo Nacional de Inclusión Financiera, 2017; International Monetary Fund, 2013), whose results provide diverse economic indicators about the Mexican commercial banking market, discussed along the present paper. Additionally, a relatively recent study by Chavarín Rodríguez (2015) noted, for instance, that market entry barriers and obstacles to competition in Mexican commercial banking have favorable impact on bank profitability.
There is a handful of previous studies on the subject of market power and its implications for competitive conditions in the Mexican banking sector. Arteaga García (2001) tests two competing paradigms trying to determine the origin of profitability in the Mexican banking system: market power and efficiency-based explanations. He concludes that the structure-conduct-performance (SCP) paradigm better explains the source of such utilities. Rodríguez Montemayor (2003), on the contrary, argued in favor of both the SCP paradigm and the efficient-structure (ES) hypothesis to explain the source of profitability in Mexican banking. Likewise, Solís and Maudos (2008) found that during the period 1993-1997 market power, measured by the Lerner index, increased in loans and deposits markets. From that year (1997) onwards, the evolution is different for the two financial markets: in deposits, market power increases until 1999 and then decreases until 2003, while loans behave in opposite directions. However, in the following two years, both started to increase once again. By contrast, Guerrero and Villalpando (2009) analyze the profit-structure relationship in the Mexican banking industry and their results suggest that including specific economic and scale efficiency measures in traditional profit-structure models provide evidence in favor of the market power explanation. Chortareas et al. (2009) investigate the determinants of interest rate spreads in the Mexican banking industry suggesting once more, based on their evidence, that the ES hypothesis explains the high spreads, rather than previous paradigms.
In the same context, Maudos and Solís (2011) estimate the degree of competition in Mexican banking in a longer period between 1993 and 2005, concluding that deregulation measures did not imply greater competitive rivalry, which in part might also explain the growth of profitability levels. Garza-García (2012) further contributes to this discussion by concluding that bank efficiency in Mexico is positively associated with loan intensity, GDP growth, and foreign ownership. On the other hand, Gómez Rodríguez et al. (2018) concluded that concentration indices decrease as new agents enter the market, though they remain at high levels due to the concentration index of major banks. Likewise, the market power approach shows that there is a monopolistic behavior amongst Mexican banks.
Studying a narrower market-the Mexican credit card market-, Estrada (2016) found that this could be described as an oligopolistic market of product differentiation, where the interest rates of different credit cards are sensible to costs and risk levels, but they also reflect supra-competitive profit margins associated with market power. Similarly, Urzúa (2009), using payments to credit cards among additional data about other fifteen non-financial services, found that welfare loss due to the exercise of market power in the Mexican services sector is progressive, although in the overall economy-considering also the goods sector-it is regressive. In this last line, Bruhn and Love (2009), studying the Mexican market, provide a policy-oriented evaluation of why it is important to expand access of financial services to the poor, which is aligned with our vision of effective regulation and antitrust policies.
From an international research perspective, concerns about the levels of banking competition have been present for many decades in analyses of the American (Beck et al., 2010), South East Asian (Liu et al., 2012), and many other markets, which recognize -in some cases and depending on the methodology employed-various degrees of market concentration, monopolistic competition, monopolistic conditions, or collusive behavior.
Nonetheless the aforementioned results, discussing market power, other studies have rendered mixed views on the appropriate role of regulation in the banking industry and its effects on consumers (Shaffer, 1989). In a study comparing banking systems in Latin America, for example, Chortareas et al. (2011) suggest that an increase in profits is not always the result of market power derived from high concentration, but rather a consequence of the efficient operation of banks.
On the other hand, the debate on banking competition acknowledges that both market regulation and market structure in the financial industry play a crucial role in allowing firms of other industries to access bank credits (Fu et al., 2014). Building on empirical evidence from US markets, Cetorelli and Strahan (2006) argue, for instance, that banks with market power represent an important barrier to entry for some productive sectors, especially entrepreneurs.
Thus, the social cost of anticompetitive behaviors, such as the exercise of market power in the banking industry, tends to be particularly high, as suggested by Berger and Hannan (1998). However, measuring these types of behavior and its implications on welfare merits a combination of statistical and theoretical approaches, which, so far, has been at the center of the debate about bank competition, mainly in developed countries (Beck et al., 2010).
THEORETICAL FRAMEWORK
The existence of a market, including that of commercial banking, grants its participants benefits known as producer and consumer surplus, which, in sum, constitute social welfare. Nevertheless, as it is well known, the existence of a market by itself does not guarantee the maximum level of social welfare, since it is possible that it culminates in various structures, being the competitive market the one, among these structures, that permits the maximization of production and social welfare (Mas-Colell et al., 2009).
On the other hand, if a firm under any market structure faces a residual demand curve with a negative slope, which can be originated by the lack of enough competitors in the market or by the existence of differentiated goods, it can set the price above the marginal cost in a profitable way; this is known as market power and can be measured by the Lerner index: (price-marginal cost) /price (Belleflamme & Peitz, 2012).
However, the exercise of market power will generate economic rents, and these will appeal new firms, causing: i) the number of firms in the market to increase; ii) the residual demand curve, along with the corresponding marginal revenue curve, to shift to the left; iii) the price to decrease; iv) the number of served consumers to increase; and v) social welfare to increase (Carlton & Perloff, 2004).
Therefore, even in a non-competitive market, such as a monopolistic market-where each firm offers a differentiated product or service-, when there exists free entry and exit of firms, that is, there are no barriers to entry, two conditions are fulfilled in the long run, conditions that are fulfilled both in the long and short run in a competitive market: a) the marginal cost is equal to the marginal revenue, and b) the average total cost curve is tangent to the residual demand curve, driving, this way, the profits to zero and erasing any market power.
Thus, the lack of existence of barriers to entry permits the price to decrease till the point that it is equal to the marginal cost, and firms become price takers, meaning that all of them sell at the same price, which characterizes a competitive market. Similarly, prices in monopolistic markets, without barriers to entry, should become close enough in the long run, given that the power of firms to set the price will be constrained by the existence of close substitute products or services offered by many other firms (Carlton & Perloff, 2004; Mota, 2004).
Consequently, according to microeconomic theory, a highly concentrated market, that is, a market where few firms hold a high market share, the possibility of obtaining economic rents for a long period of time, relatively high prices of the products or services offered by major firms, and a large fraction of unserved potential consumers suggest the existence of barriers to entry and the exercise of market power.
In this sense, in order to infer the extent of market power and support any result of its estimation, it is convenient to accompany the estimation of market power with the estimation of complementary competition indicators (Davis & Garcés, 2010), something that we do in the current research. This, because all of them are interrelated and, therefore, their results must be congruent among them.
Mathematical Derivation of the Lerner Index and Its Relationship to Market Share, Herfindahl-Hirschman Index (HHI), Price Elasticity of Demand, and Firm Market Power
In order to derivate the Lerner index, consider the following profit function for firm i
Where p is the market price of a homogenous good or service, q 1 . the quantity produced by firm i, c 1 the variable cost-constant-per unit produced by firm i, Fi . the fixed costs of firm i, and Q = Σ" i=1 q 1. the total market production, being n the total number of firms that produce the good or service.
Assuming that firms maximize their profit, at the optimum, the marginal revenue (MR i) is equal to the marginal cost (MC i), obtaining
Rearranging the terms and noting that
Dividing both sides by p, dividing and multiplying the right-hand side by Q and noting that
where 𝛆d price elasticity of demand, 1/𝛆 d = inverse of price elasticity of demand, and α i = firm i's market share, we attain
where L i.is firm i's Lerner index (Tirole, 1988).
We can see on the right-hand side of Equation 4 that the market power a firm possesses is an increasing function of its market share and a decreasing one of the market price elasticity of demand.
Within a competitive market, the price (p) is equal to the marginal cost (c i), therefore the Lerner index (L i) will total zero. The greater the market power of a firm, the greater the distance will be between the price and the marginal cost, with the Lerner index hence being closer to one.
Using each firm's market share as a weight for obtaining a weighted average market power, we can observe that there exists a relationship between the latter, the HHI, and the market price elasticity of demand (Tirole, 1988).
Thus, the weighted average of the power to establish the price above the marginal cost-measured through the Lerner index-, observed in the totality of the market, increases with market concentration-measured with the HHI-and decreases with the market price elasticity of demand.
Given the constraints to obtain information on firms' marginal cost, using the right-hand side of Equations 4 and 5 allows estimating individual firms' market power as well as the weighted average of such power in the entire market, respectively.
ECONOMIC INDICATORS ON COMPETITION CONDITIONS IN THE COMMERCIAL BANKING MARKET
This article seeks to integrate microeconomic theory, indicators on competition conditions, and market power analysis in the Mexican commercial banking market. Thus, following the logic of microeconomic theory that supports the current research, presented in the previous section, we start the empirical analysis by estimating some structural indicators that permit the assessment of competition conditions. Its results should suggest the convenience or not of assessing the existence of barriers to economic competition and free market access,1 and the estimation of market power. Finally, as stated in the theoretical framework, all indicators must support each other.
The data and indicators here presented stem from the collection of data and indicators generated by national and international institutions that have studied the Mexican financial system, as well as from own elaboration using data from the Comisión Nacional Bancaria y de Valores (National Banking and Securities Commission), the Federal Reserve Bank of St. Louis, the Instituto Nacional de Estadística y Geografía (National Institute of Statistics and Geography), and the Consejo Nacional de Inclusión Financiera (National Council for Financial Inclusion). Among the considered institutions are the International Monetary Fund, the Organisation for Economic Co-operation and Development, the World Bank, the Banco de México (Bank of Mexico), and the Comisión Federal de Competencia Económica (Federal Economic Competition Commission).
Access of Economic Agents to Financial Banking Services and International and National Relative Prices
It is in the access to financial services by the population and by Micro, Small, and Medium Enterprises (MSME) where the Mexican commercial banking market lags furthest behind.
A large part of the population, mostly in the lowest income deciles or in the rural sector, lacks access to banking services. According to the 2018 National Financial Inclusion Survey (Encuesta Nacional de Inclusión Financiera, ENIF 2018) (Instituto Nacional de Estadística y Geografia, 2018a), only 31.0% (24.6 million) of the adult population in Mexico (79.35 million in total) have a credit from a financial institution or department store, out of which only 8.3 million (10.5% of the total) have a bank credit card. Regarding formal savings products, of the 47% (37.3 million) of the adult population that have an account in the financial system, only 17.01% of the total (13.5 million) correspond to a savings account.
Furthermore, according to the National Survey on Productivity and Competitiveness of Micro, Small, and Medium Enterprises (Encuesta Nacional sobre Productividad y Competitividad de las Micro, Pequeñas y Medianas Empresas, ENAPROCE 2018) (Instituto Nacional de Estadística y Geografía, 2018b), 92.0% of these enterprises lack access to financing from commercial banks. It is important to mention that micro enterprises account for 97.3% of the MSME in Mexico, meaning that 92.4% of them do not have access to a credit from a commercial bank.
The facts stated in the previous paragraphs indicate the tremendous amount of financially unserved population, encompassing most of the economic agents in the country. A greater competition within the sector would increase the number and characteristics of goods and services offered by the banking system, contributing with this to the coverage of those known in Mexico as the unbanked ("desbancarizados").
One of the factors that have had an impact on both the number of unbanked people in Mexico and the high profitability of the commercial banking system-discussed later-is the high price of banking products in the country. Table 1 shows an international comparison in this matter. Worth nothing is the annual interest rate on personal credits in Mexico, which can be up to 1,000% higher than in the UK.
Table 1 Comparison of the Interest Rates of Common Financial Products in Banks in Mexico, the United States, and the United Kingdom.
| Institutions | Weighted annual interest rate. Credit card (APR)* (%) | Fixed annual interest rate. Mortgage loan** (%) | Annual interest rate. Personal credit*** (%) | |
|---|---|---|---|---|
| Main banks in Mexico | Banamex | 71.10 | 10.5 | 41.0 |
| Bancomer | 105.70 | 10.4 | 43.75 | |
| HSBC | 50.70 | 10.25 | 32.2 | |
| Scotiabank | 55.80 | 11.0 | 47.99 | |
| Santander | 88.10 | 10.25 | 45.0 | |
| Main banks in the US | Chase | 16.49-25.24 | 3.22-3.93 | 3.75-5.51 |
| Citi | 13.49-23.49 | 3.0-43.25 | 9.74-21.74 | |
| Wells Fargo | 13.99-25.99 | 2.7-3.3 | 9.50-23.0 | |
| Bank of America | 15.49-25.49 | 3.0-3.9 | 3.39-4.21 | |
| Main banks in the UK | Barclays | 22.90 | 1.53 | 4.90-20.99 |
| HSBC | 22.90 | 2.99-3.24 | 4.49-16.79 | |
| Lloyds Bank | 27.90 | 2.19-4.24 | 4.90-19.9 | |
| Royal Bank of Scotland | 19.9 | 2.99-3.37 | 3.3-15.5 | |
*Basic credit card: product granted with minimal solvency criteria and without a mandatory record with the financial institution issuing it. In the US, the rates vary according to the client's credit history; we present the corresponding range.
**Mortgage loan periods vary in each country, ranging between 10-30 years.
***Representative interest rate for purposes of comparison, excluding Chase and Bank of America, which do not grant personal loans.
Source: Authors elaboration with data as of March 2020, obtained from the websites of the listed banks, as well as from the Comisión Nacional Bancaria y de Valores, the Federal Reserve Bank in the US, and the Prudential Regulation Authority in the UK.
A highlight within the commercial banking market is the fact that, although small banks offer several financial products at a lower price than major banks (see Table 2), the last one have not lost their joint market share, which will be discussed later. Another highlight is the fact that the bank with the largest market share is usually the one that charges the highest interest rates.
Concentration Levels
Between March 2001 and December 2019, the number of banks in the country increased by 17 units (Figure 1), going from 34 to 51. Additionally, not all of the banks operating in the country offer the full range of banking services.
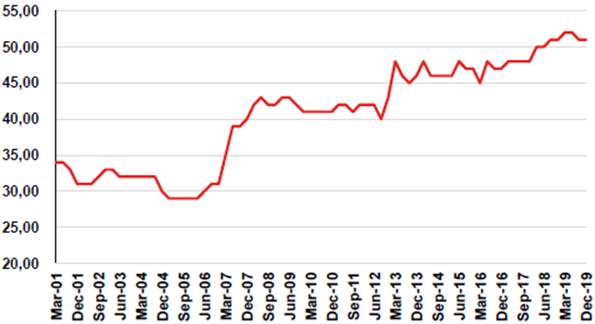
Source: Authors elaboration with data from the statistical bulletins of the Comisión Nacional Bancaria y de Valores
Figure 1 Number of Banks, Mexican Commercial Banking Market, March 2001-December 2019.
For measuring the concentration level, we use the Herfindahl-Hirschman Index (HHI).2 As known, this index is equal to the sum of the squared market shares of the participating firms in the market, which also can be read as a weighted average of market shares, assigning bigger weights to larger market shares. Therefore, its range goes from zero (perfect competition) to 10,000 (monopoly). Among its virtues we can observe that: i) the index increases when the number of enterprises diminish; and ii) the index is sensible to the relative size of firms, that is, given any number of firms, the index reaches its minimum value when market shares are the same.
Table 2 Comparison of the Interest Rates of Common Financial Products in Banks in Mexico.
| Weighted annual interest rate. Credit card (APR)* (%) | Fixed annual interest rate. Mortgage loan (%) | Annual interest rate. Personal credit** (%) | ||
|---|---|---|---|---|
| Main banks in Mexico | Banamex | 71.10 | 10.5 | 41.0 |
| Bancomer | 105.70 | 10.4 | 43.75 | |
| HSBC | 50.70 | 10.25 | 32.2 | |
| Scotiabank | 55.80 | 11.0 | 47.99 | |
| Santander | 88.10 | 10.25 | 45.0 | |
| Banks with a smaller presence | Banca Mifel | 21.60 | 10.69 | N/A |
| Multiva | 64.3 | 12.75 | 45.0 | |
| Banregio | 26.50 | 13.0 | 27.00 | |
| Banco del Bajio | 77.60 | 11.99 | 33.90 | |
*Classic credit card: product granted with minimal solvency criteria and income verification, and without a mandatory record with the financial institution issuing it. Annual percentage rate (APR) is the total cost of credit including fees.
**Basic products each bank offers within the credit line.
Source: Authors elaboration with data as of March 2020, obtained from the websites of the listed banks listed, as well as from the Comisión Nacional Bancaria y de Valores.
According to the HHI, shown in Figure 2, concentration in the Mexican com mercial banking market-measured in assets-has remained relatively stable for the last 9 years, decreasing 100 points during this period.
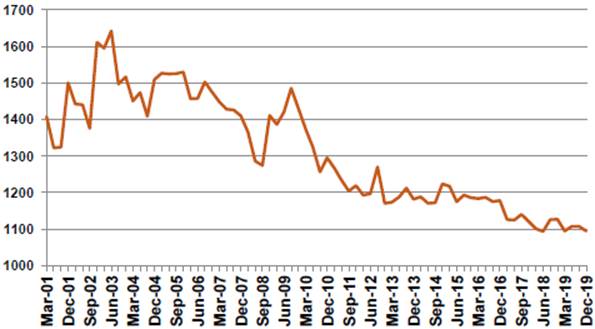
Source: Authors elaboration with data from the statistical bulletins of the Comisión Nacional Bancaria y de Valores.
Figure 2 Herfindahl-Hirschman Index (HHI), Mexican Commercial Banking Market, March 2001-December 2019.
In this aspect, the International Monetary Fund (2016) points out that concen tration levels within the Mexican banking system are high, with a major presence of foreign banks: seven major banks have 80% of market share measured by total assets.
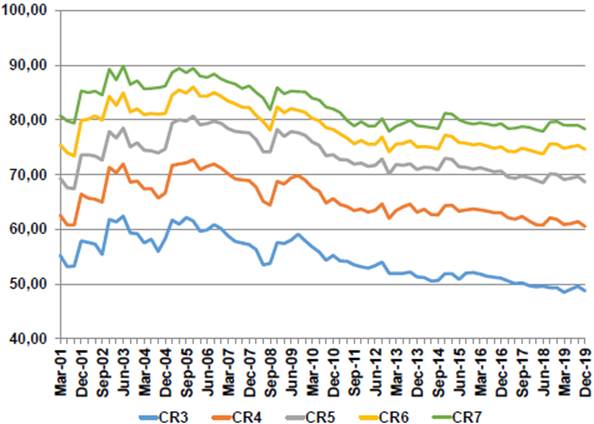
Our analysis shows that, although there have been some changes in the mar ket share of these seven major banks during the last 19 years (Figure 3)-among which the diminishing of Banamex's market share (measured in assets) as well as the increases of Santander and HSBC in the same matter after merging with Serfin and Bital during 2005 and 2003, respectively, stand out-, the joint market share of the major 3, 4, 5, 6, and 7 banks has remained stable in the last 19 years (March 2001 to December 2019) (Figure 4), going from 55.24% to 48.75%, from 62.56% to 60.53%, from 69.33% to 68.63%, from 75.42% to 74.63%, and from 80.80% to 78.34%, respectively, and has remained practically unchanged in the last seven years (December 2012 to December 2019).
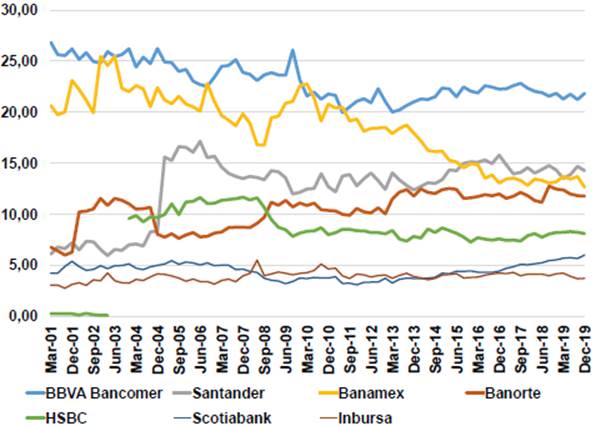
Source: Authors elaboration with data from the statistical bulletins of the Comisión Nacional Bancaria.
Figure 3 Main Banks’ Market Share, Mexican Commercial Banking Market, March 2001-December 2019.
Source: Authors elaboration with data from the statistical bulletins of the Comisión Nacional Bancaria.
Figure 4 CR3, CR4, CR5, CR6, and CR7, Mexican Commercial Banking Market, March 2001-December 2019.
These results are similar to those obtained by Solís & Maudos (2008), where they present a joint market share of 81% for the main 5 commercial banks (CR5), and a CR3 of 62%, during 2005.
Figure 4 shows the CR3, CR4, CR5, CR6 and CR7 of the Mexican commercial banking market, that is, the joint market share of the main 3, 4, 5, 6, and 7 banks, respectively.
Profitability
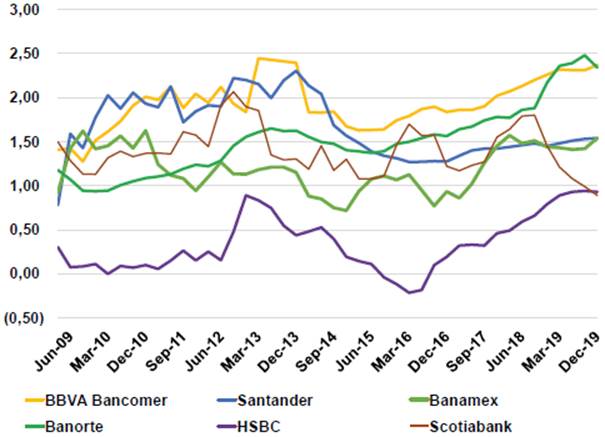
In Mexico, as in every other country, bank profitability is highly linked to the economic environment. From 2009 and up to December 2019, profitability remained considerably stable, as Figures 5 and 6 display.
Source: Authors elaboration with data from the statistical bulletins of the Comisión Nacional Bancaria.
Figure 5 Return on Assets (ROA), Mexican Commercial Banking Market, March 2009-December 2019.
Source: Authors elaboration with data from the statistical bulletins of the Comisión Nacional Bancaria.
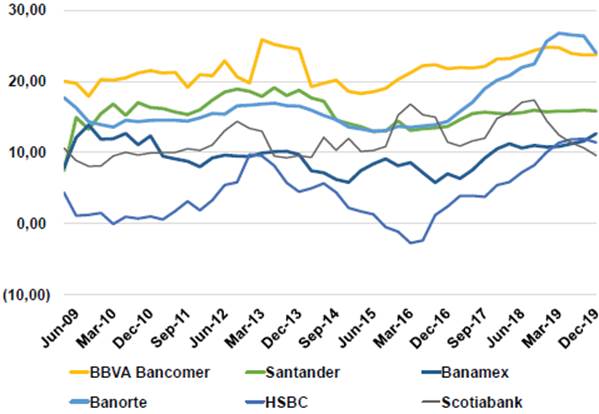
Figure 6 Return on Equity (ROE), Mexican Commercial Banking Market, March 2009-December 2019.
In a competitive banking system within an open economy, the return on equity (ROE)-net profits divided by stockholder equity-of banks should be similar, after being risk-adjusted, to that observed in other countries characterized by having competitive banking markets. It should be highlighted that the ROE of the main banks in the Mexican market (Figure 6) consistently reaches double digit values-with the exception of HSBC and Banamex-, thus being superior to the observed in countries with competitive markets (Figure 8) and to the Mexican average. This despite the risk adjustment of the ROE estimation for banks in the Mexican market, as can be observed in the Appendix.
Source: Authors elaboration with data from the Federal Reserve Bank of St. Louis.
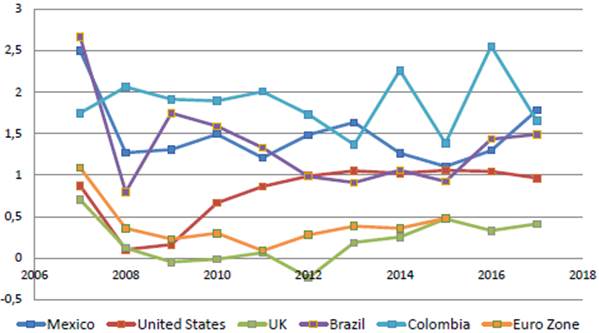
Figure 7 Return on Assets (ROA), Selected Countries, 2007-2017.
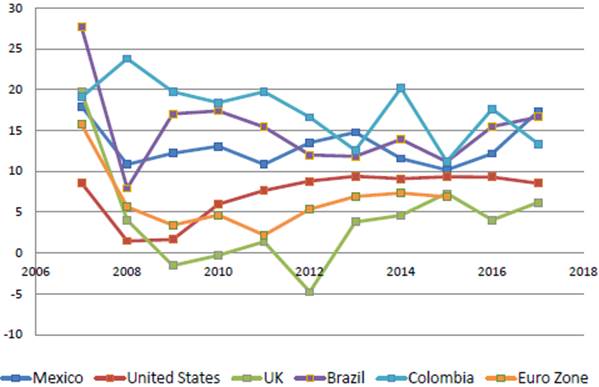
Source: Authors elaboration with data from the Federal Reserve Bank of St. Louis.
Figure 8 Return on Equity (ROE), Selected Countries, 2007-2017.
The return on assets (ROA) of the main banks (Figure 5), risk-adjusted, as can be observed in the Appendix, is considerably higher than the one observed in banking systems characterized by being competitive, such as the European Union and the US markets (Figure 7). In relative terms, profitability in the Mexican banking system-measured in terms of ROA-is slightly lower than in Colombia; nevertheless, when compared to developed countries (Figure 7) such as the United Kingdom or the European Union, bank profitability in Mexico is visibly higher.3
In terms of profitability, some small banks, usually with market shares below one percent, which serve sub-markets non attended by large banks, known as niche banks (e.g. Compartamos), as well as banks that have a captive market, among them the ones belonging to commercial chains (e.g. Bancoppel), reach also high ROA and ROE values.
The facts stated in the previous paragraphs suggest that banking institutions in Mexico do not belong to a perfectly competitive economic environment, which allows them to obtain rents in economic terms.
Barriers to Economic Competition and Free Market Access
Following microeconomic theory (see section III), the research results so far attained, such as high relative prices, high profitability of major banks during a long period of time, high concentration market regardless the offering of lower prices by small banks, and a large number of potential unserved consumers, are indicative of the existence of barriers to entry.
Moreover, for highly concentrated and profitable industries, microeconomic theory states that it constitutes a profitable-although legally forbidden-strategy for incumbent firms, in our case major banks, to set diverse barriers in order to deter the entrance of new firms (Belleflamme & Peitz, 2012; Carlton & Perloff, 2004).
There are several types of barriers that incumbents may set, or new firms may face, when trying to access a market. These barriers may completely or partially limit the ability of potential new entrants to compete against firms with a large market share (Mota, 2004). Legal barriers, essential inputs that are not available to the entirety of firms, network economies and economies of scope and scale, required major investments, as well as barriers to the mobility of users constitute an important part of possible barriers to economic competition and free market access, and have an effect on costs and competitiveness of new entrants or small firms (Belleflamme & Peitz, 2012).
Among essential inputs in the commercial banking market we find customer information, which is needed to be able to offer customers an array of services, such as different types of credits. In this matter, the volume discount policy of credit information companies' (bureaus) consultation services constitutes a clear protection of major banks, as it rises costs for new entrants or for banks already established but with a small market share. It is also worth stressing that the credit bureau, in the hands of major banks, has no obligation of sharing its information with the entirety of the authorized credit information companies.
Non-trivial infrastructure investment, such as bank branches and ATM networks, restrains small competitors from matching the offer. In this regard, it is worth noticing the high fees charged for the usage of ATMs that belong to a bank different than that of the account holder, which significantly increases the costs customers have to cover when their bank has a small ATM infrastructure.
The high fees discussed in the previous paragraph constitute the establishment of barriers to entry by incumbent firms. More specifically, they constitute barriers to the mobility of customers. The existence of this kind of barriers was already inferred from the previous sub-sections, where we observed that major banks charge the highest interest rates and, nevertheless, they do not lose their joint market share.
Regarding the total amount of banks in the market, it could be said that the final results also suggest the existence of barriers to entry. This, given that regardless of high profitability in this market, the number of new banks in Mexico did not increase significantly during the studied period.
It is also worth noting that there are other structural characteristics that limit free competition and access to the Mexican commercial banking market, such as economies of scale and scope, and the existence of markets on both sides (Comisión Federal de Competencia Económica, 2014).
ESTIMATION OF MARKET POWER IN THE MEXICAN COMMERCIAL BANKING MARKET
The present section offers the results of the estimation of market power that commercial banks have in the Mexican commercial banking market, as well as a weighted average of said power in the totality of this market, both of them measured through the Lerner index.4 To estimate the market power of each individual bank, Equation 4 was used, while the estimation of the weighted average of said power in the totality of a market was based on Equation 5. The derivation of both equations was presented in Section
Given the difficulty/impossibility to obtain information on each firm's marginal cost, using the right-hand side of Equations 4 and 5 permits to estimate market power. The research here presented subscribes to this practice, estimating first the market price elasticity of demand for bank credit, which constitutes the denominator of Equations 4 and 5.
Data Description
The results presented in this section were obtained using the following three datasets:
Commercial Banking Statistical Bulletin, December 2019 (Boletín Estadístico de Banca Múltiple). This is a monthly official statistical publication issued by the Comisión Nacional Bancaria y de Valores.5
Historical financial indicators of commercial bankings (dataset: SH_BM_201912) (Indicadores financieros históricos de banca múltiple). Available in the information portfolio of the Comisión Nacional Bancaria y de Valores.6
Economic Databank,Economic Trend Indicators (Banco de Información Económica, BIE, Indicadores económicos de coyuntura), Instituto Nacional de Estadística y Geografía.7
All retrieved variables correspond to the period from January 2001 to December 2019. Following the standard procedure, the original variables were transformed into real values, in our case into prices as of July 2013, and into their natural logarithm.
Estimation of the Price Elasticity of Demand for Bank Credit in the Mexican Commercial Banking Market
It is well-known that market equilibrium price and quantity are defined by the intersection of demand and supply curves, where the equilibrium quantity depends on the equilibrium price, and vice versa. In view of the foregoing, any demand or supply equation intended to estimate econometrically the demand or supply quantity as a function of the price-or the corresponding elasticity-will be limited by the endogenous character of the price regressor. In other words, price is determined inside the model and is correlated with the error term of the equation being estimated, breaking, this way, one of the necessary assumptions to estimate said equations through ordinary least squares.
Given this endogeneity, it is necessary to use instrumental variables or to estimate demand and supply curves through simultaneous equations (Pindyck & Rubinfield, 2001; Gujarati, 2010; Greene, 2018). Thus, following the previous authors, as well as Gross and Souleles (2002) and Carbó et al. (2003), in order to evidence the robustness of our results, we estimate the market price elasticity of demand using both methods, the first one through two-stage least squares, and through different combinations of the exogenous variables, besides the relevant one (ln r).
It is worth noting that, in the estimation of the demand curve parameters (analogous for the estimation of the supply curve), both techniques yield practically identical results if the variables included in the supply curve, which are not present in the demand curve, are used as instrumental variables of the endogenous regressor.
However, simultaneous equations have the advantage of estimating the parameters of both sides of the market (that is, demand and supply) at the same time.
Thus, considering similarity and space limitations, we have omitted the results obtained using instrumental variables when the combination of instruments corresponds to the same variables included in the simultaneous equations.
In accordance with microeconomic theory, the system of simultaneous equations, proposed and estimated in this research, is attached to standard theoretical assumptions and economic laws. Thus, the good demanded follows the law of demand, and therefore the demanded quantity decreases with respect to its price, being the former also a normal good, increasing the demanded quantity in relation to consumer income. On the other hand, following the law of supply, the supplied quantity increases with respect to its price, and, in line with economic logic, the former decreases respecting its input price.
As a result, Equations 6 and 7 were constructed in such a way that the bank credit demand (QR D ) is an inverse function of the interest rate paid by the borrower (r), and a positive one with respect to the aggregated demand, measured through the GDP or the Global Index of Economic Activity (Indicador Global de Actividad Económica, IGAE). While the bank credit supply (QR s ) is an inverse function of the interest rate paid by the bank (rpb), and a positive one in relation to the interest rate it charges (r). Once both equations are linearized-taking logarithms from both sides of them-, we obtain the equations to be estimated.
where α 1 and α 2 correspond to the natural logarithm of the constants k 1 and k2’ respectively, while 𝛆1and 𝛆2 to the error terms.
Tables 3 and 4 display the results of the estimation of the market price elasticity of demand for bank credit in the Mexican commercial banking market (𝛆 d). Following Pindyck & Rubinfield (2001), Gujarati (2010), Greene (2018), and Karlan & Zinman (2005), this elasticity was estimated through a log-log econometric model -using the logarithm of deflated variables-, in a time series framework, in which the market price elasticity of demand is equal to the parameter obtained for the natural logarithm of the interest rate paid for a bank credit (ln r).
Table 3 Estimation of Price Elasticity of Demand for Bank Credit in the Mexican Commercial Banking Market.
| (Estimation method: Instrumental variables) | |||||
| Endogenous regressor (Ln r) | |||||
| (1) | (2) | (3) | (4) | (5) | |
| ln r | -0.206* (0.114) | -0.238** (0.116) | -0.323*** (0.116) | -0.698** (0.301) | -0.366** (0.172) |
| lnGDP | 3.154*** (0.155) | 3.062*** (0.113) | |||
| LnIGAE | 2.968*** (0.068) | 2.990*** (0.071) | 3.042*** (0.073) | ||
| C | 1.666*** (0.293) | 1.645*** (0.291) | 1.621*** (0.291) | 35.786*** (2.108) | 35.109*** (1.643) |
| Endogenous regressor (ln r) | |||||
| lnGDP | 0.861** (0.408) | 0.339 (0.408) | |||
| LnIGAE | 0.627*** (0.076) | 0.437* (0.232) | 0.363 (0.237) | ||
| ln rpb | 0.195*** (0.025) | 0.193*** (0.025) | 0.196*** (0.025) | 0.152*** (0.048) | 0.165*** (0.046) |
| ln QR.L1 | 2.083** (0.811) | 1.991** (0.798) | -0.099 (0.138) | 2.932*** (0.800) | |
| ln QR.L2 | -2.028*** (0.785) | 0.091 (1.111) | -2.890*** (0.747) | ||
| ln QR.L3 | -2.008*** (0.755) | ||||
| C | -0.592 (0.368) | -0.548 (0.387) | -0.505 (0.381) | -10.480** (0.000) | -3.988 (4.904) |
| Min eig stat | 60.36 | 20.22 | 16.10 | 5.61 | 8.69 |
| Sargan | -- | 208.24 | 195.73 | 35.64 | 58.70 |
| Observations | 228 | 227 | 226 | 75 | 74 |
/1 Prices as of July 2013. Period under study: January 2001 to December 2019.
*Statistically significant at 10%.
** Statistically significant at 5%.
*** Statistically significant at 1%. Standard errors between parenthesis.
ln r: Natural logarithm of the implicit annualized monthly interest rate charged by the bank.
ln rpb: Natural logarithm of the implicit annualized monthly interest rate paid by the bank.
ln QR.L1: First lag of the natural logarithm of the performing loans portfolio.
ln QR.L2: Second lag of the natural logarithm of the performing loans portfolio.
Source: Authors elaboration using data from the Comisión Nacional Bancaria and the Instituto Nacional de Estadística y Geografía.
Table 4 Estimation of Price Elasticity of Demand for Bank Credit in the Mexican Commercial Banking Market/1.
| (Estimation method: Simultaneous equations) | |||||
| Endogenous variable: Natural logarithm of the performing loans portfolio | |||||
| (6) | (7) | (8) | (9) | (10) | |
| Demand equation | |||||
| In r | -0.117 | -0.093* | -0.111** | -0.206* | -0.168 |
| (0.186) | (0.056) | (0.057) | (0.114) | (0.113) | |
| lnGDP | 2.913*** | 0.332*** | 0.460*** | ||
| (0.100) | (0.063) | (0.086) | |||
| lnIGAE | 2.968*** | 2.956*** | |||
| (0.068) | (0.068) | ||||
| ln QR.L1 | 0.915*** | 0.870*** | |||
| (0.016) | (0.026) | ||||
| C | -33.269*** | -3.995*** | -5.428*** | 1.666*** | 1.625*** |
| (0.462) | (0.745) | (0.996) | (0.293) | (0.290) | |
| R2 | 0.938 | 0.997 | 0.996 | 0.915 | 0.916 |
| Supply equation | |||||
| ln r | 4.800*** | 4.520*** | 0.423** | 4.528*** | 0.036 |
| (1.055) | (0.992) | (0.181) | (0.558) | (0.081) | |
| ln rpb | -0.914*** | -0.792*** | -0.081** | -0.922*** | -0.012 |
| (0.196) | (0.187) | (0.032) | (0.109) | (0.016) | |
| ln QR.L1 | 0.923*** | 0.996*** | |||
| (0.036) | (0.016) | ||||
| C | 3.773 | 4.322* | 0.175 | 4.472*** | -0.019 |
| (2.574) | (2.460) | (0.264) | (1.349) | (0.098) | |
| R2 | -1.36 | -1.071 | 0.985 | -1.224 | 0.999 |
/1 All variables in constant prices as of July 2013. Period under study: January 2001 to December 2019.
*Statistically significant at 10%.
** Statistically significant at 5%.
*** Statistically significant at 1%. Standard errors between parenthesis.
ln r: Natural logarithm of the implicit annualized monthly interest rate charged by the bank.
ln rpb: Natural logarithm of the implicit annualized monthly interest rate paid by the bank.
ln QR.L1: First lag of the natural logarithm of the performing loans portfolio.
Source: Authors elaboration using data from the Comisión Nacional Bancaria and the Instituto Nacional de Estadística y Geografía.
It is worth to mention that, while the number of banks vary between 29 and 52 during the studied period, the current research uses the national average of the required variables in the estimation of elasticity. Also, given that IGAE is a monthly-based index, whereas GDP is quarterly-based observable variable, the use of the former permits econometric regressions to have up to 228 observations-increasing this way the degrees of freedom-, while the use of GDP constraint the regressions to have a maximum of 75 observations, as can be read in the last line of Table 3.
As noted in Tables 3 and 4, and as it might be expected, the negative slope of the demand curve is confirmed. Additionally, the results show that the demand curve is inelastic, that is, the price elasticity of demand is consistently lower than 1. A standout is that the elasticity is very low, regardless the combination of exogenous variables included in the regression, which confirms low elasticities obtained by other authors, including Karlan and Zinman (2005), who obtained medium-run elasticity values of (-0.17); as well as Karlan and Zinman (2008), Dehejia et al. (2012), and Ponce et al. (2017), who obtained short-run elasticity values of (-0.32), (-0.39), and (-0.57), respectively.
Regarding the results presented in Tables 3 and 4, the most plausible correspond to Equation 3. This is because the parameter of the variable that concerns us (ln r) is statistically the most significant one among all regressions, the regression is among the ones with more observations, and its result is supported by the results of Karlan and Zinman (2008), and Dehejia et al. (2012). Therefore, we conclude that the market price elasticity of demand for bank credit is (-0.32).
Estimation of Market Power of Participant Banks in the Mexican Commercial Banking Market
Once the market price elasticity of demand for bank credit was estimated, the results were used to estimate the market power of each participant bank in the Mexican commercial banking market (for which we used the right-hand side of Equation 4), as well as the weighted average of the same for the totality of the market under study (for which we used the right hand-side of Equation 5).
Table 5 Market Power in the Mexican Commercial Banking Market.
| Market share | Market price elasticity of demand | Lerner index | |
|---|---|---|---|
| BBVA Bancomer | 0.2183 | -0.323 | 0.68 |
| Santander | 0.1427 | -0.323 | 0.44 |
| Banamex | 0.1265 | -0.323 | 0.39 |
| Banorte | 0.1178 | -0.323 | 0.36 |
| HSBC | 0.0810 | -0.323 | 0.25 |
| Scotiabank | 0.0600 | -0.323 | 0.19 |
| Inbursa | 0.0371 | -0.323 | 0.11 |
| ICBC | 0.0005 | -0.323 | 0.00 |
| Forjadores | 0.0001 | -0.323 | 0.00 |
| Dondé Banco | 0.0001 | -0.323 | 0.00 |
| Pagatodo | 0.0000 | -0.323 | 0.00 |
| Market as a whole /1 | -0.323 | 0.34 |
/1 For evaluating the market as a whole, we use the HHI instead of the market share.
Source: Authors elaboration using data from the Comisión Nacional Bancaria and the Instituto Nacional de Estadística y Geografía.
Our estimations conclude that major banks hold a high market power-measured through the Lerner index-, yielding the following results: BBVA Bancomer (0.68), Santander (0.44), Banamex (0.39), Banorte (0.36), HSBC (0.25), Scotiabank (0.19) and Inbursa (0.11); for small banks (0.00); and for the weighted average of commercial banks as a whole (0.34).
Our findings are also in line with Gómez Rodríguez et al. (2018), except for two of the mayor banks. Their results show that the banks with the highest market power are Inbursa (0.44), Bancomer (0.37), Santander (0.33), Banamex (0.33), Banco del Bajío (0.32), Banregio (0.31), and Banorte (0.28).
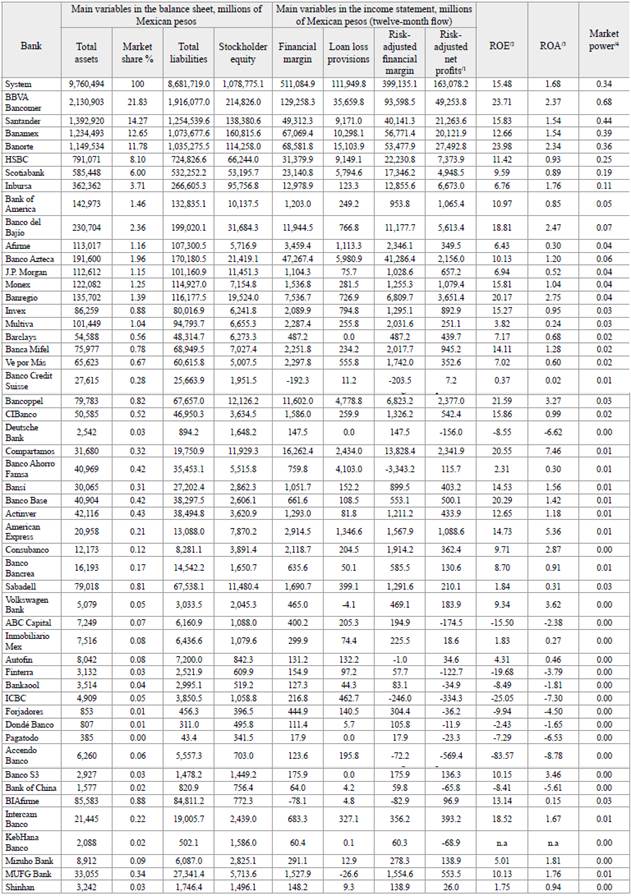
The market power of each of the participant banks in the market under study, as of December 2019, is presented in the Appendix.
CONCLUSIONS
Based on microeconomic theory, this research integrates the analysis of competition conditions with the estimation of market power in the Mexican commercial banking market. We conclude that in the market for commercial banking in Mexico there are a series of barriers to competition and free market access, resulting in a market with non-competitive characteristics where, as the economic competition indicators suggest, market power has been exercised for at least the last decade.
It is in the access to financial services by the population and by Micro, Small and Medium Enterprises (MSME) where the Mexican commercial banking market lags furthest behind. A large fraction of the population is unserved by commercial banks; a situation shared by MSME. These results evidence the existence of a deadweight loss, fulfilling one of the main characteristics of a non-competitive market.
With respect to concentration levels, our analysis demonstrates that the joint market share of the main banks in Mexico has remained high during the last nineteen years-March 2001 to December 2019-, and practically unchanged during the last seven years. On the other hand, overall concentration has remained relatively stable during the studied period.
Regarding profitability indicators, it can be noted that the ROE of the main banks in the Mexican market is notoriously higher to that observed in countries with competitive markets and to that of the Mexican average. In addition, the ROA of these banks, and the Mexican banking system as a whole, is remarkably superior to the ROA of banking systems deemed competitive such as those of the US and the European Union, even if both indicators were risk-adjusted. The latter suggests, in economic terms, the existence and exercise of market power with its ensuing collection of rents.
This paper shows that one of the factors that have influenced both the number of economic agents without access to banking services and the high profitability of major banks is the elevated prices of products and services offered by these banks. When compared to small banks, in the national market, major banks charge prices up to 100% higher than small ones; while, at the international level, the largest banks in the Mexican market can charge prices as far as 1,000% higher than those observed in the UK.
The results stemming from the aforementioned indicators are congruent with our estimations regarding the price elasticity of demand for bank credit and market power, measured through the Lerner Index, concluding that major banks hold and exercise a high market power.
In such a way, the market power, which major banks benefit from, has contributed, through the means discussed in this paper, to generate a national production below its efficient level, as well as to a lack of improvement in income distribution. An increased competition in the market for commercial banking would enhance the number and characteristics of products and services offered in the banking system, reduce their prices, and expand the number of users, consumer surplus, and social welfare.