


 English (pdf)
 Article in xml format
 Article references
 Send this article by e-mail
 Cited by SciELO
  Cited by Google
  Similars in
SciELO
Similars in
SciELO  Similars in Google
 Permalink
INTRODUCTION
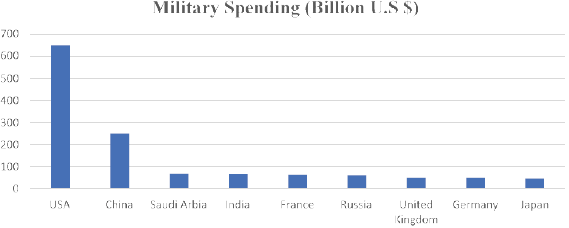
Military expenditure constitutes an integral part of the overall budget of most economies of the world (Figure 1,2). A large amount of money is invested by countries toward military budgets, to safeguard their sovereignty and national security. Data from Stockholm International Peace Research Institute (SIPRI) shows that even during the time of economic recession in 2008-09, military expenditure witnessed a massive growth of 14% in the trading of arms (Wezeman,2014). Previous studies conclude that military spending promotes economic stability, which can also be confirmed from the case of China. Over the past many years, China has incurred huge expenses toward strengthening its military power, which has resulted in promoting economic stability in the Chinese economy (Hitch & McKean, 1965).
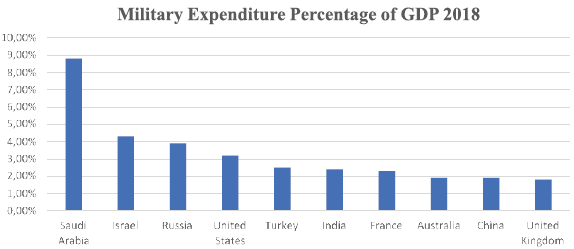
Source: SIPRI database, 2018
Figure 1 Countries with the highest military expenditure percentage of GDP
On the contrary, countries like Israel have projected that they have a negative direct relationship between economic development and defence spending. Since the Cold War, Israel has continuously reduced its military expenditure and witnessed a massive surge in its economic growth. One point drawn from Israel's defence expenditure pattern is that initially, Israel had built its military base for national security, and once they reached the stage of stability, they started reducing their defence budget. Thus, this significant initial investment in the defence sector provided economic dividends in the later years (Bitzinger, 2012).
Apart from the case of Israel, if we see the case of the United States of America, we can find that initially, the United States of America witnessed massive economic growth along with investing in military expenditure. But over the years, due to the simultaneous war with Iran, Iraq, Afghanistan, and Libya, the relationship between both economic development and defence spending has shown a mixed response.
As the popular notion states, military spending boosts the economic growth of a nation, on the assumption that when a country goes to war, it promotes investments in war-related industries, thus providing income and employment opportunities for both formal and informal sectors. The Military Keynesianism position states that the government should raise its military spending to increase their economic growth. Over the years, the war in different countries like the U.S., Iran, Vietnam, etc., shows that Military Keynesianism postulates do not have any substantial empirical support (Dunne, 2011). Thus, to examine the significance of Military Keynesianism, this study tries to employ the data of India, Pakistan, and China to analyze the influence of increased defence spending on economic development or growth.
This paper further proceeds as follows: the second section covers the review of different studies, providing an insight into the existing literature along with the research gap; the third section covers the data and methodology, and the last section covers the results and discussions which are part of the paper.
LITERATURE REVIEW
The first study which explored the above relationship was conducted by Benoit (1973,78) among the less developed countries, and the findings suggested that military expenditure has a direct impact on the economic growth of less developed countries. Military expenditure promotes infrastructure development, employment opportunities, and helps in economic development. Contrary to Benoit, the study conducted by Lim, (1983) and Biswas and Ram, (1986) suggested that an increase in defence spending is more favorable for developed economies as compared to less developed economies. Studies that support the above views are Deger (1986) and Yakovlev (2007).
Batchelor (2000) conducted a study on the economic benefits of military spending on the South African countries by employing the ARDL approach. The findings of the study suggest that military spending boosts the manufacturing sector; thus, in the long-run, military spending has a direct influence on economic development. On the contrary, a study conducted by Dunne et al. (2001), using modern vector autoregressive (VAR) between Greece and Turkey, concluded that defence expenditure has an inverse relationship with the fundamental development of Turkish economies.
Yang et al. (2011) explored the nexus between defence and economic growth expenditure. The results of the paper suggested that 23 countries that have an income below a threshold limit of U.S. $ 475.93 conclude that there is a negative relationship between the two variables, whereas when the income increases above the threshold limit, economic growth tends to show a decreasing trend. Similar findings were suggested by Dunne and Tian (2013), who employed a dynamic panel and exogenous growth model in 106 countries, covering the period between 1988 and 2010.
Aye et al. (2014) analyzed the association between military spending and economic growth in African nations during the period 1951-2010 by employing a bootstrap rolling window. The findings suggested that for the periods 1966-1972, 1973-1975, 1975, 1977, and 1979-1984, military spending had a direct influence on economic growth; however, for the rest of the period, military spending had an indirect relationship with economic growth. Mosikari and Matlwa (2014) also supported the findings by employing the Johnsen and Eagle cointegration technique and concluding that military spending has a direct influence on economic growth.
One of the latest studies based on the above relationship was conducted by Raju et al. (2019) using cointegration and causality test on the panel data of three South Asian countries. The findings of the study suggested that there is a positive long-run relationship between military expenditure and economic growth. The study also concluded that there is a unidirectional long-run causality among the variables in all the three South Asian countries. Similar findings were also reported by Khalid and Mustapha (2014), who analyzed the relationship between military expenditure and economic growth of India using an autoregressive distribution lag approach. Findings suggested that military expenditure has a direct relationship with economic growth in the short-run. The study also concluded that there is a unidirectional relationship among the variables as per causality analysis.
Studies that stated a positive relationship between military spending and economic growth include the ones by Kollias, Mylonidis, and Paleologou (2007); Awaworyi and Yew (2014) and Sezgin (2001). Studies that concluded the negative relationship between military spending and economic growth are those by Lebovic and Ishaq (1987); Vougas (1999); Dunne and Tian (2013). Apart from the positive and negative relationship, studies that have pointed out that military spending has no impact on economic growth are the ones conducted by Abu-Qarn and Abu- Bader (2003); Habibullah, Law and Dayang-Afizzah (2008), and Pradhan (2010).
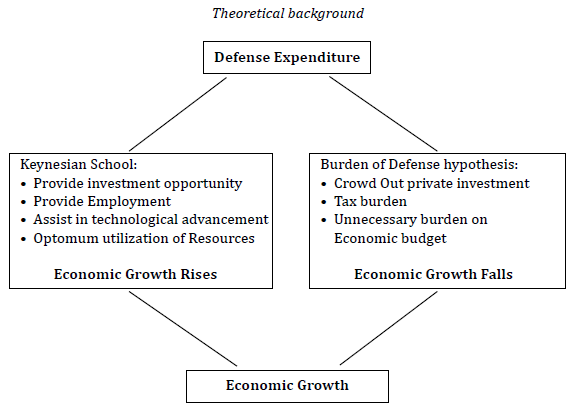
Theoretical background
There are two contrary schools of theories that provide a theoretical background for this work. Keynesian schools state that military expenditure boosts economic growth by offering investment and employment opportunities, and providing technological advancement. Contrary to this hypothesis of defence burden postulates, Benoit (1978) says that huge defence expenditure not only promotes tax burden on the society but also crowds out private investment opportunities. Figure 3 shows the theoretical background, and based on these theories, the study further explores the above topic.
Research gap
Although various studies have investigated the impact of military spending on economic growth, this study is quite different on the following grounds from the previous work. First, it incorporates South Asian countries, which was not fully explored in previous works. Second, the main limitations of the above studies were that they have assumed time series to be linear and have just checked the symmetric effect by employing a linear ARDL approach. Anoruo (2011) postulated the non-linear nature of time series. Thus, to find the hidden cointegration, as advised by Yoon (2002), this study has investigated both non-linear and linear aspects of the variables involved by employing an asymmetric ARDL approach (NARDL). Lastly, this study also tried to relate the work with military Keynesianism, which was also not explored in previous work, together with examining the role of military expenditure on industrial productivity.
METHODOLOGY AND DATA ESTIMATION TECHNIQUE
This study analyses the asymmetric relationship between economic growth and military expenditure in India, China, and Pakistan, covering the period from 1990 to 2018. The data for Economic growth(EG), Inflation (In), and Industrial Productivity(IIP) were collected from the International Monetary Fund statistics database, and the data for military expenditure (ME) were retrieved from Stockholm International Peace Research Institute (SIPRI). This study is only limited to India, Pakistan, and China, as they are the most important South Asian countries and also considered as the three lions of South Asia. Also, these countries have a convoluted history of unresolved border disputes, with military confrontations between India and China at the Line of Actual Control (LAC), and India and Pakistan at the Line of Control (LoC), occurring intermittently. Therefore, studying the impact of military expenditure on economic growth and industrial productivity will help in better understanding military confrontations and their implications.
This study has explored the asymmetric relationship between the variables using the NARDL approach. NARDL approach is employed as it jointly verifies the asymmetry and cointegration of the variables under study (Ullah et al., 2020). Moreover, they also consider hidden cointegration (Shahzad et al., 2017). The NARDL model jointly investigates long run and short asymmetric effects along with the flexibility of order of integration: I(0), (Shin et al., 2014). The NARDL model is also much superior to other error correction models as it jointly explores asymmetries and cointegration, and provides robust findings even with small samples (Granger, 2002).
The following equation was used for long-run analysis:

Where EG represents Economic Growth; ME shows Military Expenditure; In, inflation; IP, Industrial Productivity, and β i . shows the coefficient vector representing the long-run period. We have further segregated the military expenditure into negative and positive components to obtain asymmetric results.
Hence, Eq (1) is written as:

Where ME t + and MEt - represent positive and negative changes in Military Expenditure, and Ωi shows the long-run coefficient vector.
Equation 2 has been rewritten in the ARDL framework as stated by Shin et al. (2014)

Where a, b, c, d, and e are the respective lags.
Before proceeding with the results of NARDL and ARDL, certain pre-tests are required. The order of integration has to be I (0), I (1) for applying the NARDL model; therefore, for checking the order of integration, the Augmented Dicky Fuller test is employed, as suggested by Pesaran et al., (2001). As the Augmented Dicky Fuller test may provide specious results due to the problem of structural breaks, we have also used Zivot and Andrews test (Qazi et al., 2017; Raza et al. 2017).
Table 1 and Table 2 show the results of the Augmented Dicky Fuller and Zivot and Andrews test. As the unit root test confirms that none of the variables is I (2), so the study further proceeded with the NARDL estimation, Schwartz Information Criteria (SIC), and the FPss test, used for optimum lag selection and for checking cointegration. In the FPss test null hypothesis represents no cointegration against the alternative hypothesis of cointegration. In the FPss test if the calculated value is more than the upper bound value, then, in that case, the null hypothesis is rejected and vice versa. The results show rejection of the null hypothesis, meaning variables have asymmetric cointegration. In addition to the above test, other diagnostic tests are also performed. Annex 1 depicts the results of the diagnostic tests. Lastly, the WALD test is also employed to find out the short and long-run asymmetric effect of military spending on economic growth. Annex 2 shows the result of the WALD test. The null hypothesis, H0: No long-run asymmetric relationship, and H0: No short-run asymmetric relationship was checked against their alternative hypothesis.
Table 1 ADF test results
| Levels | First difference | |||
|---|---|---|---|---|
| Variables | Constant (5% Critical value) | Constant & trend (5% Critical value) | Constant (5% Critical value) | Constant & trend (5% Critical value) |
| EG(China) | -1.2303 (-2.0132) | -2.0342 (-2.3256) | -1.5674 (-2.3512) | -1.3467 (-2.3465) |
| ME(China) | -3.4276 (-1.3426) | -3.2315 (-2.6034) | -4.3245 (-3.2453) | -2.3454 (-1.2564) |
| In(China) | -2.1301 (-1.0542) | -3.0212 (-2.5421) | -4.3524 (-1.235) | -2.4563 (-1.414) |
| IIP(China) | -1.3226 (-3.2413) | -4.2375 (-2.8324) | -4.1265 (-2.3476) | -5.0943 (-1.1132) |
| EG(India) | -.432 (-.12354) | -1.2343 (-2.342) | -1.4365 (-2.1232) | -2.453 (-2.6732) |
| ME(India) | -4.3212 (-2.3242) | -4.6745 (-2.1345) | -4.1231 (-3.5412) | -5.3241 (-2.4513) |
| In(India) | -2.1215 (-1.2353) | -4.6524 (-2.1109) | -2.9843 (-1.1109) | -5.3421 (-2.1984) |
| IIP(India) | -2.6512 (-1.3498) | -3.5490 (-1.1236) | -4.5672 (-2.1104) | -4.8120 (-1,9653) |
| EG(Pakistan) | -1.2315 (-2.1232) | -2.34215 (-4.2134) | -1.3245 (-1.1324) | -1.4562 (-2.2413) |
| ME(Pakistan) | -3.2431 (-2.1342) | -3.1253 (-2.1236) | -3.4512 (-3.0867) | -4.1235 (-1.4412) |
| In(Pakistan) | -2.3098* (-1.1342) | -3.1983 (-2.1345) | -2.5472 (-1.1098) | -2.5412 (-1.1984) |
| IIP(Pakistan) | -4.1290 (-1.1324) | -3.0987 (-2.0921) | -2.1432 (-1.0932) | -6.5432 (-3.2412) |
* 5 percent level of significance.
Source: author's calculation.
RESULTS AND DISCUSSION
Unit Root Test: Although the Asymmetric ARDL approach is appropriate for a mixed order of integration, it is required to check the absence of the second level of integration. Thus, to check the unit root, the ADF test was employed to analyze the data of all three countries. Table 1 shows the result of the ADF test. Results show that none of the variables is of the second level of integration. The results imply that the study can then proceed with NARDL estimation.
Sometimes, due to a structural break, a traditional method like ADF and PP gives spurious results. Thus, to re-confirm the level of integration, the study has also employed Zivot and Andrews structural break test, whose results are shown in Table 2. The result of the Z&A test confirms that all the variables are either I(0) and and none is I(2); it also shows the presence of a structural break in the series due to national and international events. The structural break of 2008 is due to the impact of the global financial recession, and the structural break in military expenditure in 2001 is attributed to the 9/11 terrorist attack. Majorly, all the countries after 9/11 resorted to increasing their military budget to safe their territorial integrity from terrorist attacks. China increased its military expenditure from US $ 14.6 billion to US $17 billion in 2000 (Pan, L., & Mishra, V., 2018).
Table 2 Zivot & Andrew test
| Levels | First difference | |||
|---|---|---|---|---|
| Variables | t-value | Structural break | t-value | Structural break |
| EG(China) | -1.1333 | 2008 | -2.4214* | 2008 |
| ME (China) | -2.3153** | 2001 | -4.1245** | 2001 |
| In (China) | -2.2811** | 2001 | -2.3678** | 2000 |
| IIP (China) | -3.1324 | 2008 | -3.2241 | 2008 |
| EG(India) | -3.2243** | 2008 | -2.5325** | 2008 |
| ME(India) | -2.4355** | 2001,2014 | -1.2356 | 2001,2014 |
| In(India) | -2.3245** | 2000 | -2.4213** | 2001 |
| IIP(India) | -4.2234 | 2008 | -3.1234 | 2008 |
| EG(Pakistan) | -2.3892 | 2008 | -3.5466 | 2008 |
| ME(Pakistan) | -1.2342*** | 2001 | -3.4235*** | 2001 |
| In(Pakistan) | -3.1243 | 2001 | -2.1243 | 2000 |
| IIP(Pakistan) | -4.9123 | 2008 | -3.2231 | 2007 |
*,**,***shows the level of significance at 10%, 5%, and 1% respectively.
Source: author's calculation.
As there are time breaks in the series, BDS (Brock, Dechert, and Scheinkman) tests were used to confirm nonlinear time series dependencies. The results of the BDS test show nonlinearity in time series by rejecting the null hypothesis and entail to apply Asymmetric ARDL models. Table 3 shows the results of the BDS test.
Table 3 BDS test results
| BDS Statistics | Embedding Dimensions | ||||
|---|---|---|---|---|---|
| m=2 | m=3 | m=4 | m=5 | m=6 | |
| ME [China] | .13232** | .24326*** | .13623*** | .24312*** | .33425*** |
| ME( India] | .43221*** | .43198*** | .12323*** | .12122*** | .11032*** |
| ME [Pakistan] | .12435*** | .06743*** | .32221*** | .26321*** | .11986*** |
| In [China] | .23413** | .03242*** | .11234*** | .12303*** | .34210*** |
| In( India] | .06453* | .05123** | .02341*** | .21983** | .14123*** |
| In (Pakistan] | .01245** | .02343** | .06512** | .06123*** | .22911** |
| IIP [China] | .02245*** | .12351*** | .17629*** | .05764*** | .08712*** |
| IIP( India] | .01453** | .22341** | .12430* | .21334*** | .13251*** |
| IlP(Pakistan) | .22134** | .05643*** | .07865*** | .14326*** | .06512*** |
*,**,***shows the rejection of H0 at 10%, 5% and 1%
Source: author's calculation.
Next, the FPss test and SIC criteria are used to check cointegration among the variables and select the suitable lag length, which comes to be 2 in all the three panels. In the FPss test, the study has used upper and lower bound values to accept and reject the null hypothesis. In all three cases, the computed critical F statistic is above the upper bound value. Therefore, the null hypothesis is rejected at a 5% level of significance. It is accepted that the variables have cointegration, and they move together in the long run. Table 4 depicts the results.
Table 4 Bound Test results
| F-value | Lower Bound value I(0) | Upper Bound value | Results | |
|---|---|---|---|---|
| Linear (China] | 2.43054 | 2.13 | 3.23 | Not cointegrated |
| Nonh'near(China) | 3.22543 | 2.02 | 3.03 | Cointegrated |
| Linear (Pakistan) | 2.37646 | 2.12 | 3.65 | Not cointegrated |
| Nonlinear(Pakistan) | 3.87123 | 2.01 | 3.14 | Cointegrated |
| Linear (India) | 2.87435 | 2.54 | 3.87 | Not cointegrated |
| Nonlinear(India) | 3.78546 | 2.13 | 3.34 | Cointegrated' |
Source: author's calculation.
The cointegration analysis shows how economic growth responds to positive and negative shocks to military expenditure. Table 5 shows the results of the short-run analysis for all the three countries taken for this study. Results show that for China and India positive shocks in the short-run in military expenditure significantly affect economic growth, meaning that a 1 % increase in military expenses in china affects economic growth by .82 %, and for India, it is .56 % thus, supporting the findings of (Aye et al., 2014; Dayang-Afizzah, 2008). Results show that for Pakistan, the relationship between military expenditure and economic growth is negatively significant in the short run, meaning that a 1% increase in the military expenses negatively affects economic growth by .23 %. The results also conclude that the effect of negative shocks of military expenditure and economic growth rate for India and China is insignificant in the short run, meaning that both the independent and dependent variables have a symmetric relationship in the short run.
Table 5 Short-run results
| DV: Economic Growth EG t | |||
|---|---|---|---|
| Coefficient | Standard. Error | t-Statistics | |
| AME t + (China) | 0.8223 | 0.2132 | 3.3287*** |
| AME t - (China) | 0.3242 | 0.3424 | 0.4532 |
| ΔInt (China) | -0.0412 | 0.0389 | -1.2134 |
| AIIP t (China) | 0.2314 | 0.0132 | 4.1240** |
| AME t - (India) | 0.5639 | 0.2234 | 2.4387** |
| AME t - (India) | 0.2434 | 0.1324 | 0.5463 |
| ΔInt (India) | -0.0711 | 0.0123 | -2.2143 |
| ΔIIP t (India) | 0.1324 | 0.2354 | 2.3167** |
| ΔMEt* (Pakistan) | 0.5499 | 0.4532 | 1.3422 |
| AME t - (Pakistan) | 0.2393 | 0.1243 | 0.6544 *** |
| ΔInt (Pakistan) | -0.1244 | 0.1154 | -1.1243 |
| ΔIIP t (Pakistan ) | 0.0974 | 0.1235 | 3.2341** |
| ΔECM t - 1 (China) | -0.9724 | 0.1654 | -4.3213** |
| ΔECM t-1 (India) | -0.9234 | 0.1342 | -3.0243** |
| ΔECM t-1 (Pakistan) | -0.6534 | 0.8453 | -2.1434 |
** 5% level of Significance, *** 1 % level of Significance
Source: author's calculation.
Along these lines, industrial productivity and economic growth show a positive and significant association for all three countries. As industrial productivity promotes income and employment opportunities, therefore, economic development is enhanced [Narula, Rajneesh, 2005]. In the short-run, inflation and economic growth show an insignificant relationship for all the sample countries; however, the negative coefficient value shows an inverse relationship between economic growth and inflation rate [Garcia & Liu, 1999]. As both India and China are growing at a tremendous speed in terms of their development and economic growth, so increased investment in military expenditure provides peaceful investment opportunities to investors apart from promoting skill and research development [Nikolaidou & Smith, 2002). It also helps in bringing foreign investments, promotes production opportunities, along with that investment in defence sectors and contributes to infrastructure development. Thus, in the short-run, this study supports the Military Keynesianism theory for China and India.
In the case of Pakistan, the results of the short-run show that military expenditure harms the economic development as it can be interpreted that investment in the defence sector crowds out investment opportunities from other sectors like education, skill development, private investment opportunities and also results in a negative balance of payments, etc. [Hou, 2010; Kentor & Kick, 2008]. Apart from this, external terrorist activities also provide a negative push to the economic activities of Pakistan. Thus, in the short-run in Pakistan, too much investment in the defence sector is detrimental to economic growth. The ECM significance level confirms long-run association among the variables, and these ECM results also show how disequilibrium in EG is adjusted while moving from the short-run to the long-run.
The long-run results of NARDL shown in Table 6 confirm that for India and China positive impacts of ME boost economic growth, whereas negative ones worsen economic growth, meaning 1 % increase [decrease] in ME will increase [decrease] EG by .45% [.32%] for China and .32% [.23%], respectively. Therefore, confirming the asymmetric relationship in the long run in the case of India and China. The above findings suggest that increase military expenditure is beneficial for India and China, as an increased military budget promotes infrastructure development, employment opportunities, creates a peaceful environment for investment opportunities, and also helps in optimum utilization of resources and capital stock (Alptekin et al.,2012).
Table 6 Long run Results
| DV: Economic Growth EG t | |||
|---|---|---|---|
| Coefficient | Standard. Error | t-Statistics | |
| ME t + (China) | 0.4532 | 0.2045 | 4.2314*** |
| ME t - (China) | -0.3242 | 0.3100 | -2.143** |
| ME t + (India) | 0.3241 | 0.0762 | 3.2341** |
| ME t - (India) | -0.2354 | 0.0542 | -1.1232*** |
| ME t + (Pakistan) | 0.4421 | 0.1432 | 2.3241 |
| ME t - (Pakistan) | -0.0533 | 0.2313 | -1.2327 |
| Int (China) | -0.4532 | 0.0231 | -1.1347 |
| In t (India) | -0.1436 | 0.0345 | -0.3452*** |
| In t (Pakistan) | -0.1342 | 0.0231 | -0.0764** |
| IIP t (China) | 0.2451 | 0.0135 | 0.2654** |
| IIP t (India) | 0.1342 | 0.0124 | 0.1522** |
| IIP t (Pakistan ) | 0.1146 | 0.0321 | 0.1105*** |
** 5% level of Significance, *** 1 % level of significance
Source: author's calculation.
These findings also support Military Keynesianism and Keynesian optimum demand philosophy, which promoted that military expenditure is as important as government spending. Thus, policymakers should take appropriate steps to utilize a military budget in the best possible ways for the development of an economy. The results of other variables show that in the long-run, industrial productivity has a positive and significant relationship with economic growth for all three countries, which also substantiates the findings of previous literature. Industrial development is an integral part of countries' development, as it helps in reducing unemployment both formal and informal, and also helps in income generation (Wu, Yanrui, 2010). Whereas the relationship between economic growth and inflation is insignificant for China in the long run, for India and Pakistan, inflation has a significant and negative impact on economic growth, as it affects the real income of the salaried class. Therefore, too much inflation is bad for economic growth in the long run as the coefficient of inflation shows a negative relationship with economic growth [Mallik, 2001; Mahmood, 2002).
Lastly, the Wald Test also reconfirms the long-run asymmetric association between economic growth and defence expenditure. The results of the table confirm the long-run asymmetric relationship between military expenditure and economic growth in the case of India and China.
CONCLUSION AND MANAGERIAL IMPLICATIONS
This study investigated the asymmetric relationship between economic growth and military spending on the panel data of India, China, and Pakistan, covering the period from 1990 to 2018. Using the asymmetric relationship, the objective of this research was also to examine the Military Keynesianism philosophy on the panel of the three countries separately. Unit root, structural break, and BDS test are employed to analyze the above relationship. The findings of the FPss confirm an asymmetric cointegration between military spending and economic growth for India and China. Using NARDL, as proposed by Shin et al., the study concluded that military spending has a significant long-run impact on the economic development of India and China along with the fact that positive influence of military expenditure on economic growth is much more powerful than the negative shock. Meaning the linear model will show the hidden cointegration among the variable in the long run. On the other hand, in the short run, this relationship turns out to be symmetric.
Findings suggest that policymakers should pay more attention to nonlinearity for military spending and economic growth, and accordingly devise appropriate policies for the betterment of the economy. The study shows that for India and China, military expenditure is beneficial in the long run as, according to Keynesian demand, high military spending will promote high demand for labour, infrastructure development, and resource allocation. It will also help in providing employment opportunities, along with investment opportunities. Research for better weapons and advanced technology boost research and development funds, which can be used in different research work related to industrial and domestic productivity. As military spending promotes national security, thus countries that are at a stable pace of development like India and China should keep fuelling their military spending as this will contribute to economic growth, as postulated by the Military Keynesianism approach.
But countries like Pakistan who are still struggling to maintain their economic stability should focus more on their internal domestic development and other sectors apart from just concentrating on the defence sector. The results show that military spending in Pakistan is not so significant to economic growth. Thus, too much military spending crowds out the economic budget, which results in the budget constraint for other sectors like education, health, and industrial productivity. Thus, from this study, it is concluded that military expenditure is beneficial for developed or developing countries that have a stable growth rate.
Limitations/ future scope of the study
This work focuses only on the panel of three countries: India, Pakistan, and China, thus allowing replicating the same study with other countries like the U.S or Russia, which are spending significantly in their defence sector. This study has taken only selected variables such as economic growth, industrial productivity and inflation, which also provide an opportunity to see the effect of military spending on other key macro-economic variables.
Practical implication for Asian countries
Over the years, the defence expenditure of most South Asian countries is showing a downturn. This fall in the defence budget is also affecting the research and development funds of South Asian countries. This downturn could reflect the end of a military-modernization cycle that began after the 1997-98 Asian financial crisis. In 2012 the rate of defence expenditure growth of South Asian countries was higher than that of the whole of Europe. But over the years, defence expenditure is showing a downfall which is negatively affecting the economic development of South Asian countries as well, as this study projects that appropriate defence spending or military expenditure is beneficial for the economic growth of a country as a whole. An increased defence sector budget not only helps in infrastructure development and employment opportunities but also helps in the development of better technologies and the know-how, which can be used in the creation of countries' business, production, and overall economic growth.
Thus the findings of this study will help in understanding the importance of defence budget for the overall growth of a country based on the Military Keynesianism Postulate. As India and China are the most emerging markets among South Asian countries, the outcome of this study will help to understand the significance of the defence budget on business and economic growth in overall South Asian countries, from a broader perspective.

