


 English (pdf)
 Article in xml format
 Article references
 Send this article by e-mail
 Cited by SciELO
  Cited by Google
  Similars in
SciELO
Similars in
SciELO  Similars in Google
 Permalink
INTRODUCTION
In recent years, examples of a new payment method, called cryptocurrencies, have emerged. Cryptocurrencies can clearly be interpreted as a new generation of money, given that their characteristics are fundamentally different from traditional currency systems. Within the huge variety of existing cryptocurrencies, the Bitcoin system can be identified as the most important one at present (Ali et al., 2014). The original idea of Bitcoin is quite convincing, since users of this system are supposed to realize national and international financial transactions in a more time and cost-efficient manner than users of the traditional banking sector (Abramova & Böhme, 2016)). However, recently, it is possible to identify a rapidly growing tendency of using Bitcoin as a speculative asset (Agosto & Cafferata, 2020). Especially during the period 2017-2018, this tendency even resulted in a behavior of Bitcoin market prices that seems to be characterized by one or more financial bubbles.
Nonetheless, from a scientific perspective, it is not correct to identify a Bitcoin asset price bubble simply based on the apparently bubble-like behavior of Bitcoin market prices. Actually, one should be able to directly identify a growing difference between the cryptocurrency's observable market price and its fundamental value. Determining the fundamental value of assets like stocks or real estate is already a formidable task. Calculating the fundamental value of a much less studied asset like cryptocurrencies is even more difficult, if not impossible (Chen & Hafner, 2019).
Hence, a reliable direct detection of a Bitcoin asset price bubble based on a comparison between market price and fundamental value is not yet possible. Consequently, different ideas are necessary to investigate the possible existence of financial bubbles in the Bitcoin system. The present paper aims to statistically analyze historical Bitcoin price data together with the price data of a well-known and generally accepted historical asset price bubble (the 1720 South Sea Bubble) seeking to identify possible similarities. The South Sea Bubble is chosen as a comparative reference point because it seems interesting-especially with respect to potential conclusions that could be derived-to carry out this comparison during the year 2020, which marks the 300th anniversary of the South Sea Bubble. Furthermore, Bitcoin market prices and those of the South Sea Company show the same behavior (accelerating price increase followed by price crash) in roughly the same time scale of about one year. Hence, the research objective of this paper is to statistically compare time series data of the South Sea Company and Bitcoin in order to find empirical evidence of speculative bubble tendencies in Bitcoin price history.
To the effect, the paper is divided into five main sections. After this introductory part, the second section (Theoretical and Contextual Background) introduces the theoretical fundamentals and provides some context with respect to the crypto-currency Bitcoin and asset price bubbles. The third part (Methodology) describes the underlying dataset and statistical approach of the study. The fourth section (Comparison of Bitcoin and the South Sea Company) presents and interprets the test results. Finally, the article ends with some concluding remarks in the fifth section.
THEORETICAL AND CONTEXTUAL BACKGROUND
Origins and Definition of the Cryptocurrency Bitcoin
According to Abramova and Böhme (2016), cryptocurrencies are innovative, digital instruments with the potential to destroy traditional payment systems that are based on financial intermediation through commercial banks. Ali et al. (2014) identify Bitcoin as the first and most influential digital currency and define it as "a privately developed, internet-based currency and payment system that requires no intermediaries (like banks) for the processing of payments" (266). Furthermore, they mention that the Bitcoin system is not regulated by any public authority (e. g. a central bank) and its information exchange is based on cryptography in order to ensure a secure processing of financial transactions.
Nakamoto (2008) was the first who introduced the idea of an autonomous, decentralized, and anonymous payment system called Bitcoin in a paper titled "Bitcoin: A Peer-to-Peer Electronic Cash System." According to Bonneau et al. (2015), Bitcoin's genesis block was mined in January 2009 and the first transaction based on this currency was realized in 2010. Although Bitcoin appears to be a revolutionary and innovative instrument, introduced just about 10 years ago, the concept of cryptocurrencies is not new at all. Already in 1983, David Chaum presented his idea of an automated payment system, which offers a high degree of anonymity using techniques of cryptography (Chaum, 1983).
Since then, the idea described above was refined by multiple researchers and practitioners, which led to the emergence of a huge variety of cryptocurrencies existing today. In its list of currently (as of 06/18/2020) existing cryptocurrencies, CoinMarketCap (2020), one of the key sources of information on the market, mentions 2,685 different cryptocurrencies around the world. Table 1 presents the 10 most important cryptocurrencies worldwide, based on the mentioned list.
Table 1 Top 10 Cryptocurrencies by Market Capitalization (USD) (06/18/2020)
| Cryptocurrency | Market Capitalization (USD) |
|---|---|
| 1. Bitcoin | 173,129,642,404 |
| 2. Ethereum | 25,688,550,159 |
| 3. Tether | 9,185,031,267 |
| 4. XRP | 8,418,211,688 |
| 5. Bitcoin Cash | 4,386,216,140 |
| 6. Bitcoin SV | 3,235,174,195 |
| 7. Litecoin | 2,832,239,369 |
| 8. Binance Coin | 2,524,629,513 |
| 9. EOS | 2,365,908,722 |
| 10. Cardano | 2,111,258,574 |
Source: CoinMarketCap (2020).
According to Table 1, Bitcoin is by far the most important cryptocurrency worldwide with a market capitalization of more than USD 173 billion. At this point, market capitalization is simply the amount of circulating coins multiplied by the current market price of each coin. As evidenced by data included in the table, the differences between Bitcoin and Ethereum as the 2nd, as well as Tether as the 3rd most important cryptocurrencies are impressive. Comparing the value of the top cryptocurrencies with the total market capitalization of all the 2,685 cryptocurrencies (USD 266,469,751,315) listed on CoinMarketCap (2020), it can be concluded that the global cryptocurrency market is highly concentrated, given that the portion of Bitcoin on the total market capitalization is currently almost 65%, and the top 10 cryptocurrencies, combined, reach almost 88% of the total cryptocurrency market.
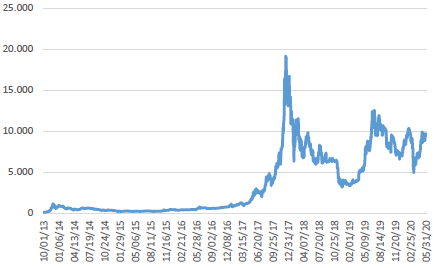
Figure 1 shows daily Bitcoin price data for the period 10/01/2013 to 05/31/2020, obtained from cryptocurrency information provider CoinDesk (2020a). The Bitcoin Price Index of CoinDesk represents an average of Bitcoin prices across leading global Bitcoin exchanges (CoinDesk, 2020b). As can be seen in the figure, the database started with a value of USD 123.26 (10/01/2013) and reached its all-time high on 12/18/2017 with a price of USD 19,395.84. As of 05/31/2020, the Bitcoin price quotes at USD 9,437.96.
Source: CoinDesk (2020a).
Figure 1 CoinDesk Bitcoin Price Index on a Daily Basis for the Period 10/2013-05/2020
Functioning and Characteristics of the Bitcoin System
According to Godsiff (2015), in the Bitcoin system, transactions are realized directly between the two parties of a financial transfer-payer and payee. Hence, Bitcoin can be interpreted as a system that seeks disintermediation, i.e. a payment system that eliminates the financial intermediary. In traditional, bank-based payment systems, a centralized process can be found, as payers transfer their money to payees using financial intermediaries-a process that, especially in an international context, can be characterized as costly and time-consuming. Within the Bitcoin system, direct transactions do not require financial intermediaries, which results in cost and time advantages. Using Bitcoins, transactions are usually executed, according to Nakamoto (2008), within ten minutes at cero costs (or with a marginal, optional fee per transaction). Transactions are realized anonymously, using encrypted public and private keys. Furthermore, this encrypted information is published in a public ledger, which automatically serves as a mean of control (Bech & Garratt, 2017; Bradbury, 2013).
Within the Bitcoin system, the system's very own users are in charge of executing individual transactions, which are organized in blocks (blockchain technology). By providing their computational capacities and resolving complex computational puzzles, Bitcoin users carry out the work performed by commercial banks in traditional payment systems. Once again, this demonstrates the characteristic autonomy of the Bitcoin system (Antonopoulos, 2017; Dwyer, 2015).
This autonomy can also explain the concept of mining. New blocks of transactions are solved during a competitive process in which multiple participants (usually groups of people and their computational capacities) try to solve a specific block. At the end, the participant who finds the optimal solution for the specific computational puzzle and validates outstanding transactions receives newly created Bitcoins as compensation (Bradbury, 2013; Dwyer, 2015; Godsiff, 2015). Hence, the money creation process is also carried out by network users, and no legal entity-a central bank, for example-is needed. Finally, as another feature of Bitcoin's functioning, it is important to mention that, as Bitcoin is a digital currency, digital money storage systems are needed as well, such as web services, applications or USB memory sticks (Dwyer, 2015).
According to Lara and Demmler (2018), in comparison to traditional payment systems, various advantages of the Bitcoin-and cryptocurrency systems in general-can be highlighted. For example, the already mentioned cost and time advantages stand out. Moreover, for a sensitive issue like financial transfers, the high degree of anonymity within the Bitcoin system is very important. However, there also exist plenty of disadvantages. Bryans (2014), for example, indicates criminal intentions-e.g. money laundering-as a subject of discussion. Also, tax evasion and terror financing can be mentioned as criminal activities, which are easier to be carried out in completely anonymous payment systems like Bitcoin. Other disadvantages, such as insufficient regulation (De Filippi, 2014) and an uncertain regulatory future (European Parliament, 2016), also need to be highlighted. Furthermore, security risks in form of possible malware attacks (Bradbury, 2013) should be mentioned too.
Especially for the present paper, financial risks related to the Bitcoin system are important. On the one hand, using weekly return data for the period 2010-2013, Brière et al. (2015) identify high average returns and significant diversification benefits for Bitcoin due to low correlation coefficients with other traditional financial assets. Similar results are provided by Bouri et al. (2017), as they also confirm that Bitcoin is suitable for diversification purposes.
On the other hand, however, Conlon and McGee (2020) doubt the diversification potential of Bitcoin, since, analyzing portfolio returns during the worldwide Covid-19 crisis, they find that even a small allocation to Bitcoin significantly increases portfolio downside risk. Baek and Elbeck (2015) report substantial volatility for Bitcoin and consider it to be a highly speculative asset; similarly, Lara and Demmler (2018), taking into account daily returns for the period 2010-2018, report high values of volatility and other risk measures for the Bitcoin market price.
In line with the mentioned studies, Agosto and Cafferata (2020) classify Bitcoin as pure financial asset and object of speculative activity. Even international central banks publicly warn of investment risks associated with cryptocurrencies like Bitcoin and their potential to worsen future financial crises (Weidmann, 2018). Because of studies that identify Bitcoin and cryptocurrencies in general as speculative assets, it is not clear in the financial literature whether cryptocurrencies such as Bitcoin should be considered as alternative currencies or speculative investment vehicles. For example, Fry and Cheah (2016) claim that two currency functions (store of value and unit of account) are not adequately covered by Bitcoin. Hence, it is at least questionable whether Bitcoin could be characterized as a currency.
Asset Price Bubbles
Definition and Characteristics
There exist numerous definitions of an asset price bubble. For example, according to Kindleberger and Aliber (2005), an asset price bubble can be defined as a phenomenon in financial markets, which is based on speculation and where the market price of an asset first sharply increases and then collapses. Agosto and Cafferata (2020) also differentiate between these two main phases of a financial bubble: expansion of the bubble and crash. These authors define asset price bubbles as extremely rapid accelerations of an asset's market price-from a statistical perspective, they are usually referred to as explosive behaviors-, followed by drastic market price drops. Additionally, Jarrow et al. (2010) describe an asset price bubble as a considerable difference between the market price of an asset and its fundamental value. At this point, an asset's market price can be defined as the visible price for which the asset is exchanged between its buyers and sellers and depends solely on the factors of current demand and supply. On the other hand, the fundamental value (also known as fair or intrinsic value) is the result of a sophisticated analysis (fundamental analysis), which determines the present value of the asset's future cash flows. In other words, the fundamental value is what the asset should cost if its market valuation was fair.
In their definition of an asset price bubble, Blanchard and Watson (1982) include a reference to its cause. They state that a financial bubble is a movement in the market price of an asset that is not justified by fundamental news. Thus, according to these authors, a bubble is caused by factors different from fundamental information (fundamental information refers to information that changes the fundamental value of an asset). According to the efficient market hypothesis (Fama, 1970, 1991; Jensen, 1978)-still one of the dominating theories in financial literature nowadays-, only this type of information drives market prices.
In fact, the efficient market hypothesis interprets financial bubbles as inefficiencies, i.e. differences between the market price of a financial asset and its fundamental value, which (according to the theory) are not possible given that capital markets operate efficiently due to a perfect arbitrage process realized by perfectly rational market participants (Barberis & Thaler, 2002). Therefore, in the efficient market hypothesis, market prices and fundamental values are equal and asset price bubbles cannot emerge. Nevertheless, real asset markets can be characterized by market imperfections and limited arbitrage, which simply do not permit an adequate, stabilizing arbitrage (Abreu & Brunnermeier, 2002; Shleifer & Vishny, 1997).
Therefore, numerous historical examples of asset price bubbles exist within different types of markets, including, for example, stocks, bonds, real estate, crude oil, and even tulip bulbs. There is a multitude of theoretical approaches with reference to the explanation of asset price bubbles. Generally, financial literature establishes a difference between rational and irrational bubbles. On the one hand, rational financial bubbles are in line with the rational (benefit maximizing) investment behavior of market participants. This category of asset price bubbles encompasses theories such as stochastic bubbles (Blanchard, 1979), intrinsic bubbles (Froot & Obstfeld, 1991), information bubbles (Allen & Gale, 2000; Allen & Gorton, 1993), as well as a super-exponential rational model of bubbles (Sornette & Andersen, 2002).
On the other hand, irrational bubbles contradict rational investment behaviors. Under this category fall, for example, theories that define financial bubbles as fashions and fads (Camerer, 1989; Shiller, 1988). Furthermore, nowadays, behavioral finance approaches provide very promising and convincing irrational explanations for asset price bubbles. One of the most important and influential behavioral approaches is the positive feedback theory of bubbles of Nobel laureate Robert J. Shiller (2005, 2015).
Central to this theory is a feedback mechanism that provokes both the expansion and crash of the bubble. According to the author, in the expansion phase, an exponentially growing demand results in exponentially growing market prices of the asset, while in the crash phase an exponentially growing supply leads to falling market prices. With respect to this feedback mechanism, Shiller (2015) uses the medical term epidemic in order to express the importance of social interactions between market participants, which underlie the described demand and supply processes during a financial bubble.
Regarding the positive feedback theory of Shiller (2005), Demmler (2017) enumerates a variety of behavioral anomalies (for instance, investor sentiment, herding, selective awareness, biased self-attribution, overconfidence, etc.) that form the psychological basis for an irrational investment behavior, which consequently leads to the speculative process called financial bubble. Similarly, Akerlof and Shiller (2009) put instinctive investment behaviors forward as a subject of discussion within financial decision-making processes and speculative phenomena like asset price bubbles.
The South Sea Bubble as an Example of a Historical Asset Price Bubble
Since 1637, the year of the first registered asset price bubble (tulipmania) in the Netherlands (Garber, 1989), numerous examples of financial bubbles have been seen on the international financial markets until today. Among these historical financial bubbles, Demmler (2017) mentions, for example, the asset price bubble of the roaring twenties of the twentieth century on the US stock market, which principally affected stocks of the then innovative sectors of media, telephone, electronics, aerospace, power supply, and chemical industry. As another mayor example of a historical asset price bubble, the New Economy (internet, telecommunications, and biotechnology) bubble at the turn of the millennium on the US, British, French, and German stock markets can be highlighted (Brunnermeier & Nagel, 2004). Finally, the more recent subprime bubble (Brunnermeier, 2009) on the US housing market should be mentioned here, which resulted in worldwide recessional tendencies at the beginning of 2007.
The present article has a special interest in yet another historical financial bubble, which will be part of the statistical analysis. Hence, this specific bubble should be presented in more depth. 300 years ago, in 1720, an asset price bubble appeared on the English stock market, known as the South Sea Bubble since it occurred primarily in shares of the South Sea Company, a trading company and financing firm of the English government at the moment. However, this bubble was not limited to this single enterprise as it spread to numerous other newly founded firms that became known as "bubble companies" (Frehen et al., 2009).
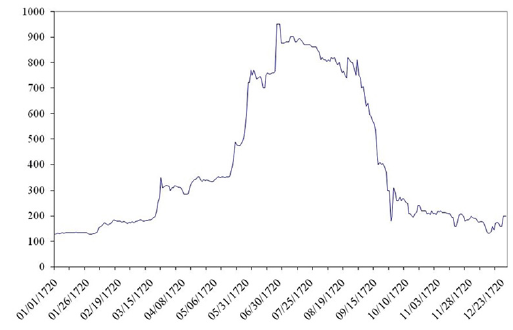
As can be seen in Figure 2, the entire financial bubble only lasted about one year. At the beginning of 1720, the South Sea Company stock quoted at 128 pounds; the maximum market price was reached at the end of June with 950 pounds. Until the end of the year, the asset price bubble was eliminated again as the Company's market price fell back to 200 pounds. Figure 2 clearly shows the typical phases (expansion and crash) of an asset price bubble. Garber (1990) estimates that before the beginning of the crash of the South Sea Bubble, the South Sea Company was about 5 times overvalued in comparison to its fundamental value.
Bitcoin and Asset Price Bubbles
During the last years, the topic "Bitcoin and asset price bubbles" has been analyzed by a growing number of scientific research studies. For example, Grinberg (2011) indicates the possibility that the Bitcoin network could be vulnerable to speculative movements, similar, for example, to asset price bubbles. Regarding the fundamental value of the cryptocurrency Bitcoin, Weidmann (2018) is convinced that it does not have an intrinsic value. In line with this argument, Cheah and Fry (2015) also calculate the fundamental value of Bitcoin with 0. Consequently, every positive market price of Bitcoin would fulfill the direct definition of an asset price bubble. Nevertheless, in general, scientific approaches to determine the fundamental value of cryptocurrencies are (still) limited (Chen & Hafner, 2019).
In general, Chen and Hafner (2019) believe that cryptocurrencies could be more vulnerable to financial bubbles than, for example, stock markets. They consider that within cryptocurrency markets, compared to stock markets, a necessary stabilizing process that aligns potentially differing market prices and fundamental values is more difficult due to greater effects of existing limits of arbitrage (e.g., lack of short-sale instruments) and market imperfections (e.g., limited fundamental information).
In another research study, Phillips and Gorse (2018a), after analyzing four cryptocurrencies including Bitcoin, came to the conclusion that cryptocurrencies in general are vulnerable to speculative investment behavior and bubble-like price growth in case of increasing interest levels of market participants. Furthermore, Phillips and Gorse (2018b), using social media and trading volume data, show that financial bubbles in cryptocurrencies can be predicted by epidemic modelling. Moreover, and in line with Shiller (2015), they provide empirical evidence that asset price bubbles mirror the social epidemic-like spread of an investment idea among market participants.
In a similar result to Phillips and Gorse (2018b), Garcia et al. (2014) point out the existence of self-reinforcing positive feedback processes between the volume of Twitter messages and Bitcoin prices. Additionally, Chen and Hafner (2019) present empirical evidence for multiple bubble periods in cryptocurrency market prices and find an explanation in exuberant investor sentiment movements. Eom et al. (2019) also emphasize the high dependency of Bitcoin market price behavior on investor sentiment and, as a consequence, the vulnerability of Bitcoin to financial bubble tendencies.
Examining harmful speculative movements and explosive behaviors within time series of Bitcoin market prices, Bianchetti et al. (2018) demonstrate strong bubble tendencies in Bitcoin market prices during 2017, reaching a maximum in December; a result confirmed by studies of Agosto and Cafferata (2020) and Geuder et al. (2019), who as well find financial bubbles in Bitcoin and other cryptocurrencies especially in late 2017. On the other hand, there are studies that speak against bubble processes in Bitcoin market prices in 2017. For example, in their analysis of daily and high-frequency Bitcoin market prices, Chaim and Laurini (2019) find evidence for a Bitcoin bubble during the years 2013 and 2014, but not for late 2017. Furthermore, Fry (2018) urges to be cautious with preliminary conclusions about financial bubbles in cryptocurrency markets given that, as he demonstrates, dramatic booms and busts cycles can occur even in the absence of bubbles due to liquidity risks.
METHODOLOGY
The research objective of the present article is to statistically compare time series data of the South Sea Company and Bitcoin seeking to find empirical evidence of speculative bubble tendencies in Bitcoin's price history. The South Sea Bubble is chosen as a comparative reference point because, from a scientific perspective, it appears interesting to compare a generally accepted asset price bubble from 1720 with a potential recent asset price bubble in Bitcoin 300 years later. Furthermore, the two assets show the same price behavior (accelerating price increase followed by price crash) in roughly the same time scale.
To the effect, three statistical methods based on Baur et al. (2018) and Phillips et al. (2015) are applied in order to compare the market price returns of Bitcoin (BTC) and the stock returns of the South Sea Company (SSC). Firstly, statistical moments such as mean, standard deviation, skewness, and kurtosis are analyzed for the distributions of each financial asset's returns. To examine possible similarities between the two phases of a (potential) financial bubble, statistical moments are also estimated before (bubble expansion) and after (bubble crash) the maximum price date (MPD) (i.e., the moment the bubble is presumed to burst). Moreover, the stationarity of each financial asset's returns are analyzed by estimating the coefficient p in a first-order autoregressive model [1], and performing the Augmented Dickey-Fuller (ADF) and Phillips-Perron (PP) unit root tests. To properly specify these tests, the number of lags is set according to the Akaike, Schwarz-Bayesian, and Hannan-Quinn information criterions, and the inclusion of a constant or a trend term according to their statistical significance.
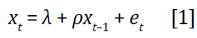
In equation [1], x t indicates the financial asset returns, and e t is an error term, assumed to be normally distributed e t ~ N(0, σ2). If the financial asset returns follow a stationary process, then p < 1, and the ADF and PP tests reject the null hypothesis of a unit root.
Also, TARCH type models [2] are estimated to analyze the volatility of each financial asset's returns. The specification of the model allows estimating persistence, as well as the asymmetric effects of shocks in the volatility equation.
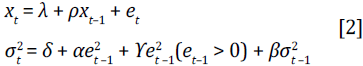
In equation [2], x t denotes the financial asset returns, and e t is an error term (also called innovation), assumed to be normally distributed e t ~ N(0, a2). δ is a constant parameter that shows the general volatility of the returns and (e > 0) represents an indicator function that takes the value of 1 when the lagged error is positive and 0 otherwise. Moreover, Y is the TARCH parameter that shows additional volatility due to a positive shock (i.e., asymmetric effect). Lastly, α and β are the ARCH and GARCH parameters, respectively, that show whether there is persistence in the volatility (due to past innovations or volatility).
Finally, the results of the Supremum Augmented Dickey-Fuller (SADF) and the Generalized Supremum Augmented Dickey-Fuller (GSADF) tests proposed by Phillips et al. (2015) for each financial asset's prices in logs are compared. Simply put, the tests rely on the recursive estimation of Augmented Dickey-Fuller statistics on a forward expanding sample (ADF r2 r1 ) obtained through equation [3].
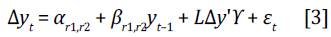
In equation [3], LAy denotes a vector of lags of the dependent variable, Y is a vector of parameters, e t is an independent and identically distributed error term, and r1 and r2 denote the fraction of the total sample for which the estimation is made. For the SADF test, r1 is fixed at a starting point, and r2 increases in each recursion (single recursive); for the GSADF, both r1 and r2 increase (double recursive). Since the SADF and GSADF tests use recursive testing, 2% of the available data is established as the starting testing point, as suggested by the authors, and increased by one observation (one day) at a time for each recursion. As before, to correctly specify the ADF version, the number of lags is set according to the Akaike, Schwarz-Bayesian, and Hannan-Quinn information criterions, and the inclusion of a constant or a trend term according to their statistical significance in the recursion that included the maximum price day.
As Phillips et al. (2015) remark, the SADF and GSADF test are a right-tail variation of the ADF unit root test, which tests the null Ho: ρ = 1 (unit root) against the alternative Ha: ρ > 1 (i.e., a mildly explosive process defined as an asset price bubble). It is important to note that the GSADF test is consistent even if there are multiple bubbles, whereas the SADF test is not. In order to decide whether to reject the null hypothesis, the asymptotic critical values provided by Phillips et al. (2015) are used, which are considered to apply more adequately for practical work.
COMPARISON OF BITCOIN AND THE SOUTH SEA COMPANY
Data Analysis
This document uses BTC and SSC daily price data spanning nearly two years (one year before and one year after the maximum price date). Estimations were made using Stata 13. BTC price data go from 12/18/2016 to 12/18/2018 and were obtained from Coindesk (2020a). SSC prices were obtained from the European State Finance Database (2020) and go from 07/01/1719 to 07/12/1721. As it is evident from Figures 1 and 4, data used for each financial asset show the typical sharp rise and decline of prices, which is characteristic of a financial bubble.
The returns of each financial asset are obtained as the percentage of daily log-price differences: r t = [ln(Pt) _ ln(Pt-1)] x 100. Figure 3 displays respective returns, as well as maximum price dates (MPD) marked with a red vertical line: 12/18/2017 for BTC and 06/30/1720 for SSC.
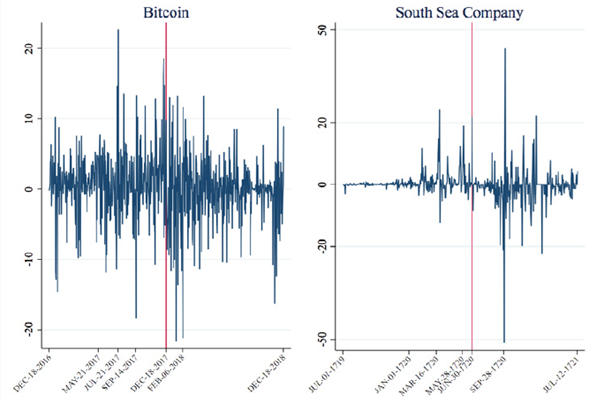
Figure 3 suggests that the two series are stationary around zero, so a less-than-unity AR(1) coefficient could be expected. The figure indicates that SSC is the asset with greater volatility (minimum return close to 50% negative and maximum return close to 44% near 09/28/1720). Moreover, Figure 3 also shows that the greatest volatility in returns happened after MPD for SSC (06/30/1720), whereas for BTC the picture is not that clear. The maximum positive return of BTC occurred before MPD (close to 23% on 07/21/2017), while in the case of SSC it was after MPD (close to 44% near 09/28/1720). Interestingly, both assets display a return greater than 20% within five months before MPD (starting on 07/21/2017 for BTC and on 03/16/1720 for SSC), and both assets have negative returns greater than 20% within three months after MPD (01/17/2018 and 02/06/2018 for BTC; 09/28/1720 for SSC).
Table 2 shows return distributions and exhibits several similarities between BTC and SSC. Considering the whole sample, BTC and SSC mean returns are positive, though those of BTC are considerably higher. BTC standard deviation is similar to that of SSC in magnitude, suggesting that overall volatility is similar for both assets. The skewness of returns is negative for both assets, so most returns are greater than their mean. The fact that the SSC return mean is close to zero indicates that most of its returns were positive. Moreover, each asset shows similar absolute values for maximum and minimum returns, i.e., close to 22 for BTC (maximum of 22.64 and minimum of -21.57) and greater than 40 for SSC (maximum of 43.83 and minimum of -51.08).
Table 2 Statistical Moments of BTC and SSC Returns
| Mean | SD | Skewness | Kurtosis | Min | Max | N | ||
|---|---|---|---|---|---|---|---|---|
| Whole Sample Period | BTC | 0.20 | 4.67 | -0.23 | 6.13 | -21.57 | 22.64 | 729 |
| SSC | 0.02 | 5.03 | -0.51 | 36.80 | -51.08 | 43.83 | 546 | |
| Before MPD | BTC | 0.88 | 4.70 | 0.11 | 6.05 | -18.30 | 22.64 | 364 |
| SSC | 0.69 | 3.18 | 3.64 | 24.41 | -12.14 | 24.12 | 302 | |
| After MPD | BTC | -0.47 | 4.55 | -0.64 | 6.05 | -21.57 | 13.20 | 365 |
| SSC | -0.82 | 6.54 | -0.75 | 26.34 | -51.08 | 43.83 | 244 |
Note: MPD = Maximum Price Date
Source: authors' elaboration.
Table 2 also shows that, before MPD, the BTC return mean is positive and relatively large in magnitude, similar to that of SSC. Moreover, in terms of BTC returns, standard deviation is somewhat greater than that of SSC, suggesting that BTC returns were slightly more volatile before MPD. Interestingly, Table 2 demonstrates that BTC and SSC return skewness is positive before MPD, indicating that most daily returns were smaller than their mean during this period. However, after MPD, the return mean, as well as return skewness, were negative for both assets. Additionally, the standard deviation of BTC returns decreased slightly compared to the period before MPD, but that of SSC increased, suggesting that SSC asset returns became more volatile after MPD, contrary to BTC.
Table 3 AR(1) Coefficients and Unit Root Tests (Asset Returns)
| AR(1) | ADF | PP | N | ||
|---|---|---|---|---|---|
| Whole Sample Period | BTC | 0.0136 | -4.901** | -26.848** | 728 |
| SSC | 0.0812 | -5.788** | -21.466** | 546 | |
| Before MPD | BTC | 0.0268 | -5.875** | -18.681** | 364 |
| SSC | 0.219** | -5.768**t | -14.606** | 302 | |
| After MPD | BTC | -0.0453 | -6.101** | -19.993** | 365 |
| SSC | 0.131 | -4.385** | -15.516** | 244 |
Notes: *, ** denotes significance at a 5% and 1% level, respectively. f ADF test provides different results depending on the information criterion chosen. Under the Schwarz-Bayesian information criterion, the null is rejected; the PP test always rejects the null.
Source: authors' elaboration.
According to the discussion of data presented in Figure 3, Table 3 presents evidence that none of the asset returns follow a unit root process during the whole sample period, nor after MPD. Only SSC shows some evidence of following a unit root before MPD, depending on the information criterion chosen in the ADF test. Also, BTC and SSC returns do not follow a (stable) AR(1) process in the whole sample period, nor after MPD. Only SSC returns exhibit evidence of following a (stable) AR(1) process before MPD. These results support the argument that even though asset returns show volatility, deviations from a long-term value (ρ in equation [1]) do not last forever, and the process returns to equilibrium.
A deeper analysis of return volatility is shown in Table 4, which presents the estimation of equations [2]. The insignificant ρ coefficients in the mean equation show that none of the asset returns follow a stable AR(1) process in any period analyzed when volatility is estimated along with the AR(1) equation. Considering the whole sample period, the insignificant constant coefficients suggest that the long-term expected value of returns moves close to zero. Furthermore, BTC has the highest δ, so BTC returns present the greatest general volatility. Also, both asset returns present a positive ARCH coefficient (α), so past innovations have a positive effect on current volatility. For BTC, a is relatively small compared to SSC, so SSC past innovations have a greater positive effect on current volatility. Moreover, only BTC returns display a statistically significant negative TARCH coefficient ( ү ), meaning that a positive shock has a smaller effect on BTC return volatility than a negative shock. For SSC returns, on the other side, a positive or negative shock has the same effect on volatility. Finally, GARCH coefficients (β) are similar for both assets considering the whole sample period, as well as before and after MPD. Hence, past volatility has nearly the same effect on current volatility for BTC and SSC.
Table 4 TARCH Models (Asset Returns)
| Whole Sample Period | Before MPD | After MPD | |||||
|---|---|---|---|---|---|---|---|
| Model | Coeff. | BTC | SSC | BTC | SSC | BTC | SSC |
| Mean | ρ | 0.041 | 0.063 | 0.039 | -0.003 | 0.137 | 0.028 |
| (-1.01) | (-1.15) | (-0.64) | (-0.05) | (-1.64) | (-0.5) | ||
| λ. | 0.185 | 0.011 | 0.836** | -0.44* | 0.021 | -0.73** | |
| (-1.11) | (-0.23) | (3.60) | (1.97) | (-0.63) | (2.91) | ||
| Variance | α | 0.146** | 0.307** | 0.247** | 0.07** | 0.047 | 0.519** |
| (6.42) | (13.87) | (4.55) | (4.90) | (-1.47) | (5.38) | ||
| ү | -0.046* | 0.03 | -0.064 | -0.063** | 0.511** | -0.563** | |
| (2.03) | (-0.8) | (-1.09) | (3.39) | (6.81) | (5.79) | ||
| β | 0.835** | 0.82** | 0.71** | 0.942** | 0.815** | 0.715** | |
| (35.22) | (141.36) | (13.56) | (56.46) | (115.09) | (17.96) | ||
| δ | 1.035** | 0.006* | 2.115** | 0.283** | 0.003 | 2.915** | |
| (4.74) | (1.99) | (3.51) | (2.77) | (-0.77) | (7.12) | ||
| N | 728 | 545 | 363 | 183 | 272 | 384 | |
Notes: *, ** denotes significance at a 5% and 1% level, respectively.
Source: authors' elaboration.
Regarding the subsample before MPD, Table 4 also displays significant constant coefficients, suggesting that the long-term expected value of returns moved close to a positive value for BTC, but to a negative value for SSC. Again, both asset returns show positive ARCH coefficients, so past innovations have a positive effect on volatility. Within this subperiod, for BTC, α is higher than that of SSC. Before MPD, SSC returns were the only ones displaying a statistically significant negative TARCH coefficient ( ү ), meaning that, for SSC, a positive shock had a smaller effect on volatility than a negative shock. On the other hand, for BTC, a positive or negative shock had the same effect on volatility.
When analyzing the subsample after MPD, only SSC's constant coefficient was significant, but negative, indicating that the long-term expected value of SSC returns moved close to a negative value. For BTC, δ is not significant after MPD, contrary to what was found considering the whole sample period (i.e., BTC volatility was significantly smaller). Both asset returns still show a positive ARCH coefficient, though for BTC, it is not significant at a 95% level, indicating that past innovations did not have a positive effect on BTC return volatility. Moreover, both assets present a relatively large and significant TARCH coefficient, though this was positive for BTC and negative for SSC. Therefore, after MPD, a positive shock had a greater effect on volatility than a negative shock for BTC, and vice versa for SSC. This suggests that, after MPD, investors reacted more after falls in SSC returns.
Table 5 SADF and GDSAF Tests (Asset Prices)
| SADF | GSADF | |||||||
|---|---|---|---|---|---|---|---|---|
| Critical values | Critical values | |||||||
| Statistic | 10% | 5% | 1% | Statistic | 10% | 5% | 1% | |
| BTC | 3.722 | 1.18 | 1.49 | 2.01 | 5.603 | 1.89 | 2.14 | 2.57 |
| SSC | 4.462 | 1.18 | 1.49 | 2.01 | 6.272 | 1.89 | 2.14 | 2.57 |
Source: authors' elaboration.
Table 5 demonstrates that asset statistics reject the SADF and GSADF null at a 99% level. Hence, there is evidence that both BTC and SSC experienced bubble behavior. In order to identify the dates when BTC and SSC prices had a mildly explosive behavior, Figure 4 shows the SADF test recursions. It is clear that the SADF test statistics for both assets reach their highest values close to MPD. Also, it is interesting to note that SADF test recursions reject the null generally during episodes of greater return volatility. For instance, when BTC returns reached their lowest value before MPD (close to -18% on 09/14/2017 as shown in Figure 3), the SADF test statistic started to increase until it reached its maximum value. Similarly, when SSC returns reached their greatest value before MPD (over 20% on 03/16/1720 as shown in Figure 3), the SADF test statistic started to increase until it reached its maximum value.
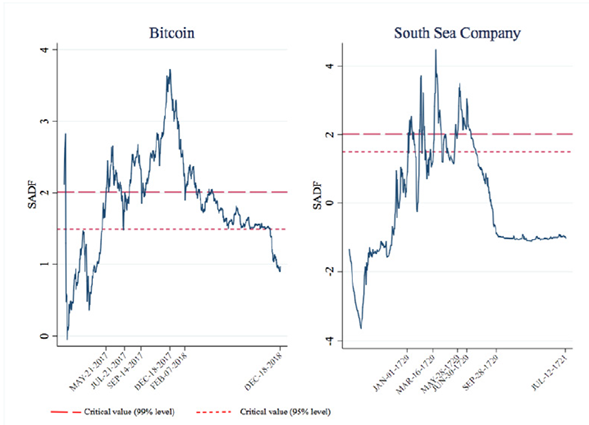
The SADF test recursions displayed in Figure 4 suggest that there are at least two periods where the SADF statistics for BTC and SSC reject the null, confirming the presence of financial bubbles, as discussed in the results of Table 5. However, Phillips et al. (2015) argue that if there is more than one episode of exuberance, the SADF test is not consistent. Therefore, the GSADF test is carried out.
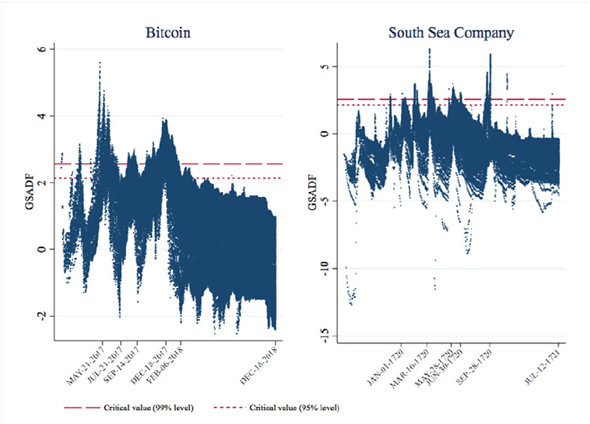
Figure 5 evidences several explosive moments of BTC and SSC returns, which implies that the assets exhibit more than one financial bubble. For SSC, the GSADF statistic rejects the null at a 99% level in several moments in 1720, including near 01/01, 03/16, 05/28, 06/30 (MPD), and 09/28. For BTC, the GSADF statistic rejects the null at a 99% level in 2017 around 05/21, between 07/21 and 09/14, and around 12/18 (MPD). As discussed before, these dates coincide with periods of greater return volatility in both assets.
DISCUSSION
The results of the statistical approach confirm important similarities between the two assets. Hence, it can be concluded that Bitcoin's price history (12/18/2016 to 12/18/2018) shows sufficient empirical evidence of the existence of speculative bubble tendencies as the behaviors of the two analyzed assets have important characteristics in common.
Firstly, the price movements of Bitcoin show, beginning in early 2017 until 2018, the typical two phases of an asset price bubble-expansion and crash-, just like the prices of the South Sea Company in 1720. Secondly, descriptive statistics such as return mean, standard deviation, and skewness are essentially similar between the two assets, taking into account the whole two-year study period, but also the subsamples of one year before and one year after the respective maximum price. Thirdly, the results of the SADF and the GSADF tests find clear evidence of multiple speculative bubble tendencies for both analyzed assets.
The evidence of bubble tendencies for Bitcoin in 2017 presented in this study is in line with recent studies by Agosto and Cafferata (2020), Bianchetti et al. (2018), as well as Geuder et al. (2019). By defining an asset price bubble as a mildly explosive process and, hence, using a methodological design based on Phillips et al. (2015) and the mentioned studies, this paper identified multiple bubble tendencies in Bitcoin market prices in general, which reached their maximum in late 2017. As in case of the South Sea Bubble, for Bitcoin, a suitable explanation of financial bubble tendencies seems to be the growing influence of speculative investment motives and exuberant investor sentiment outlined by Chen and Hafner (2019) and Eom et al. (2019).
Based on the results, the present paper also characterizes Bitcoin as a speculative asset constantly vulnerable to financial bubble tendencies, comparable to the studies of Agosto and Cafferata (2020), Baek and Elbeck (2015), and Fry and Cheah (2016). Understanding Bitcoin as a highly speculative, possible multi-bubble asset might be crucial for market participants in determining their investment risk and portfolio decisions.
The presented statistical analysis between the South Sea Bubble and Bitcoin and its results lead to some specific lessons. First, it seems surprising that despite undoubted, significant progresses during the last 300 years (between the South Sea Bubble and the Bitcoin Bubble) regarding, for example, the liberalization and technologization of national and international financial markets, generation, diffusion, and transparency of information, as well as average investor financial literacy, the investment behaviors causing these financial bubbles are very much comparable.
Second, it can be concluded that the above-mentioned progresses do not cover the full spectrum of the determinants of financial decision-making. Especially within asset price bubbles, behavioral factors also seem to play an important role, as it was already outlined by Akerlof and Shiller (2009) and Demmler (2017) in general, and by Chen and Hafner (2019) and Eom et al. (2019) specifically for the concept of investor sentiment within the Bitcoin market. As these behavioral factors are mostly based on instinctive as well as subconscious behavioral patterns, they are very difficult to change. This might be one of the central reasons why we saw asset price bubbles in 1720 and we still see them in present financial markets.
CONCLUDING REMARKS
The present article aimed to statistically compare time series data of the South Sea Company and Bitcoin in order to find empirical evidence of speculative bubble tendencies within Bitcoin's price history. This comparative approach was chosen as the direct identification of a potential Bitcoin asset price bubble using the concepts of market price and fundamental value appears to be impossible, given that Bitcoin's fundamental value cannot be clearly determined. Nevertheless, statistical similarities between Bitcoin market prices and prices of a specific historical asset price bubble (South Sea Bubble)-widely accepted by the scientific community as a speculative bubble-present convincing evidence of existing financial bubble tendencies in Bitcoin's price history.
The statistical comparison of the South Sea Company and Bitcoin market prices confirm important similarities between the two assets, such as, for example, their overall boom-bust behavior, as well as their descriptive statistics (return mean, standard deviation, and skewness), taking into account the whole two-year study period, but also the subsamples of one year before and one year after the respective maximum price. Moreover, further results of the SADF and the GSADF tests find clear evidence of financial bubbles for the analyzed time series of the South Sea Company and Bitcoin. Thus, based on the South Sea Bubble experience, it can be concluded that Bitcoin's price behavior also shows convincing empirical evidence of the existence of speculative bubble tendencies.
The present article proposes the idea of an indirect identification of a Bitcoin asset price bubble by means of a comparison with a generally accepted historical financial bubble. Future research studies might expand on the determination of the fundamental value of cryptocurrencies in order to advance the direct identification of "cryptobubbles" as well. Furthermore, and in line with multiple other studies, the methodology used in this paper defines an asset price bubble, from a statistical point of view, as a mildly explosive behavior, based on which, as already mentioned, convincing empirical evidence of an existing bubble behavior was found for both of the studied assets. Nevertheless, an additional line of research could work on the development of specific asset price bubble tests for cryptocurrencies, which consider their innovative characteristics in a potentially more adequate way.

