


 English (pdf)
 Article in xml format
 Article references
 Send this article by e-mail
 Cited by SciELO
  Cited by Google
  Similars in
SciELO
Similars in
SciELO  Similars in Google
 Permalink
INTRODUCTION
The study of the capital structure of companies is a crucial topic for corporate finance. Since the seminal article by Modigliani & Miller (1958) about the irrelevance of the capital structure and its subsequent rectification with the effect of corporate taxes (Modigliani & Miller, 1963), numerous studies have been published about companies and corporations particularly about developed countries ( Zavertiaeva & Nechaeva, 2017; Dong, Loncarski, Horst, & Veld, 2012; Adair & Adaskou, 2015; Huang, Boateng, & Newman, 2016; Kenourgios, Savvakis, & Papageorgiou, 2019) and lately, also about companies from emerging economies (Espinosa, Maquieira, Vieito, & Gonzalez, 2012; Zeidan, Galil, & Shapir, 2018; Mardones & Cuneo, 2019; Almahadin & Oroud, 2020), among others. In these economies, it is important to consider two characteristics: i) less efficient emerging markets than developed ones and ii) asymmetric information and reverse selection problems are greater in these markets (Ebaid, 2009) (Eldomiaty TI, Ismail, 2009).
During these last six decades, many studies have been carried out, of which mainly three theories stand out: trade-off theory (TOT), pecking order theory (POT) and market timing theory (MTT). The TOT supports the existence of an optimal financing structure that maximizes the value of the company (Modigliani & Miller, 1958), (Modigliani & Miller, 1963), (Miller, 1977). The POT is based in the asymmetry of information and the agency dilemma among the different investors, either internal or external of the company, so that it sets forth an order of preference among the various sources of financing, prioritizing internal financing and, later, external financing of debt over the own capital (Myers, 1984) and (Myers & Majluf, 1984). For MTT the capital structure of the company is a cumulative result of previous at-tempts to time the stock market through issuances or withdrawals (Baker & Wurgler, 2002), companies issue corporate assets when they receive a low share price and issue debt when they receive a high share price (Chen, Chen, Chen, & Huang, 2013). Some authors conclude that MTT requires new models to be analyzed (Jahanzeb, Bajuri, & Karami, 2013), (San Martín & Saona, 2017).
Do Latin American companies change their financing structures (share issues or redemption) before opportunities in the stock market? Otherwise, do these change their debt level or structure for reasons other than the stock market behavior of their shares? Debt needs are likely to be based on growth opportunities or on exchanging or replacing debt on more beneficial terms. Horna-Zegarra (2020) analyzes this situation in the Peruvian economy in two periods 2005-2010 and 2015-2016.
This research aims to answer the following questions: How do Latin American companies finance their monetary deficit and shape their capital structure? Also, do Latin American companies take advantage of favorable conditions in the stock market to satisfy their debt needs?
The first hypothesis is that Latin American companies satisfy their financial deficit needs indistinctly with debt, capital, and equity, without privileging any of them. The second hypothesis is that Latin American companies decide their capital structure considering the effects of favorable conditions of the stock market, they prefer the issuance of capital when the price of their shares is overvalued.
BIBLIOGRAPHIC REVIEW
The market timing hypothesis has created controversy because it disagrees with both main existing theories about the structure of capital (Mahajan & Tartaroglu, 2008), such as: i) The Static Equilibrium Theory (Trade-off theory) that attempts the combination of equity and debt that maximizes the value of the company based on the benefits of the debt, that is, it supports the existence of an optimal debt level and/or financial structure (Myers, 1977) and ii) The pecking order theory (POT), proposed by Myers (1984) and Myers & Majluf (1984), based on the asymmetry of information among the controller shareholders with the other ones, and from these latter with the managers, since these are the ones that generally have real information of the situation of the company promoting adverse selection and agency problems. In order to minimize the investment choices per underinvestment and overinvestment, this theory (POT) sets forth a hierarchical order for the financing of new projects: with resources generated by the company (profits and depreciation), later debt issuance and lastly issuance of new shares.
Baker & Wurgler (2002) highlighted two patterns. First, the most profitable companies issue less equity, since the consequence of a higher profit is the reduction of leverage and second, the size of the companies represents an important role in the change in leverage, because the issuance of shares is lower proportionally than assets in larger companies.
Alti's work (Alti, 2006) shows that companies resort to the market to issue shares after periods of high share profitability. The effect of the highly active or dynamic market is considerably sturdy. The effects of this market disappear from the second year after the issuance of shares. Therefore, the effects of MTT are an essential determinant of financing activities in the short term, but its effects in the long term are limited.
In the context of more advanced economies, there is mixed evidence on the relationship between the level of indebtedness and the ratio of market value debt and its permanent effects on the capital structure of companies in developed countries (Mahajan & Tartaroglu, 2008). A study that uses the methodology proposed by Baker & Wurgler (2002) on companies in the G-7 countries during 10 years (1996-2005), revealed that companies adjust their structures of capital after equity issuance, except for Japan (Mahajan & Tartaroglu, 2008). In the Russian market, using the same methodo-logy, they find no evidence that companies follow the MTT (Zavertiaeva & Nechaeva, 2017). Some results may be combined with the other theories (TOT and POT), such as the case of the study carried out in the Canadian market (Dong et al., 2012).
Considering a global market, a study in 50 countries, with twenty-one thou-sand companies, during the 2010 - 2011 period, the impact of the culture in the capital structure was analyzed. Evidence was found that companies get closer to the MTT when these want to reduce their indebtedness ratio and when their stock market prices grow or increase (Arosa, Richie, & Schuhmann, 2015). This study used the return of shares as proxy of the MTT and two dimensions of Hofstede culture (Hofstede, 2001): Uncertainty Avoidance (UA) and Power Distance (PD), created in the seventies.
Regarding evidence in emerging markets, during 2003-2014, 106 Egyptian companies were selected and, following the Baker and Wurgler methodology (Baker & Wurgler, 2002), they found that the price ratio over the book value (Market to Book) does not have a significant effect on the financing structure of companies, neither evidence the existence of POT (Allini, Rakha, McMillan, & Caldarelli, 2018).
In Asian markets, in a sample of 14 Indonesian companies that issued shares during the period 2008-2009, it was applied an ordinary least squares (OLS) model getting results that allowed them to accept the MTT hypothesis (Setyawan, 2015). On the other hand, with an analysis with panel data, a study on Taiwanese companies for the period 1990-2005 found evidence that supports MTT between 1990 and 2001, but not POT (Chen et al., 2013).
Using as proxy the natural logarithm of the share price to assess the MTT in the Egyptian market, ElBannan (ElBannan, 2017) selected a total of 154 Egyptian companies and a total of 1,386 yearly observations, during the 2006 - 2014 period.
He found a negative and significant ratio with the price index on the book value (Market to Book), which would indicate that the companies with high price of their shares prefer to make new issuances to capitalize the high prices. In other study, about Chile, the share price is used as MTT variable (San Martín & Saona, 2017), with similar results.
A study on five Latin American countries (Argentina, Brazil, Chile, Mexico, and Peru) and considering a total of 432 companies, during the period 2006-2014, found favorable evidence for MTT in Argentina, Brazil, and Peru. In contrast, the results were not proper in Chile and Mexico (Dani, Padilha, Santos, & Santos, 2016).
Besides the MTT, other attempts have arisen to explain the capital structure of the companies; in this regard, studies have been carried out with non-traditional or atypical variables, such as beliefs, the gender of top management, the organizational culture, among others. For instance, the research made by Yang (2013) shows that heterogeneous beliefs of managers and investors can have a great impact on the financing policy of companies. This author also concludes that financial regulation that improves shareholder control can reduce market behavior (MTT) and improve the welfare of the company. Other study on the Mexican economy about the relationship between the level of debt and gender in strategic positions within the company found that in those corporations with a greater number of women, the tendency to assume debt decreases (Mendoza-Quintero, Briano-Turrent, & Saavedra-Garcia, 2018).
METHODOLOGY
To answer the questions asked, econometric analyses are carried out through several panel data regression models with fixed and random effects (fe and re), later these ones are assessed and submitted according to the Hausmann test. The models attempt to analyze whether the POT and MTT theories are fulfilled in the Latin American context.
Regarding the POT theory, the Shyam-Sunder & Myers (1999) methodology is followed to estimate the relationship between the financial gap and the debt variation. This model has been used in several studies (review, (Chirinko & Singha, 2000; Frank & Goyal, 2003; Huang & Ritter, 2009; Lemmon & Zender, 2010; Chen et al., 2013; Komera & Lukose, 2015; Allini et al., 2018)).
The financial deficit (DEF) can be estimated by different methodologies, for example, as the sum of capital issues, paid dividends, the increase in net working capital and long-term debt (at the beginning of the period) minus the operating cash flows, after interest and taxes (Shyam-Sunder & Myers, 1999). In this paper, we will evaluate the financial gap as the change in total assets minus the change in retained profits (Fama & French, 2005).
The three linear regression models applied have the Financial Deficit (DEF) as exploratory variable, and as dependent variables: DNE Net debt issued, CNE Net capital issued, and PNE Variation in net equity issued. The models used are:
Also, following (Chen et al., 2013) and (Allini et al., 2018) we will substitute CNE in the DNE model, which corresponds to the issue of capital, excluding the other equity accounts as accumulated results.
To assess if there is a linear relationship between the capital and retention of benefits of the companies and the financial deficit, the model (3) is applied.
To assess the MTT we use four different models with capital structure exploratory variables and an average external financing variable at market value or average equity at market value. These models also include variables to examine pecking order theory (POT):
The nomenclature for the description of the results will indicate the model (m), number, and afterwards, the panel data methodology used. For example, "m1re" corresponds to the results of model 1 with the methodology of random effects, and "m3fe" corresponds to model 3 with the methodology of fixed effects.
Two indebtedness ratios are used as a proxy for the capital structure of companies, one on book values (B_Lev) and the other on market prices (M_Lev): i) the ratio of total financial debt over market value (M_Lev) and ii) the ratio of total financial debt over total assets (B_Lev). The market value corresponds to the total financial debt plus the value of the stock market equity.
The exploratory variables are: estimated as the natural logarithm over total assets and sales respectively. The tangibility of assets (TANG), estimated as the ratio of tangible assets to total assets. Finally as a measure of profitability the net margin (Mg_Net).
Following Baker and Wurgler (Baker & Wurgler, 2002) the average external financing by market value is used, EFWAMB for its acronym "external financing weighted average market-to-book" ratio:
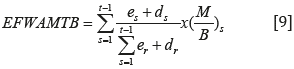
Where e and d are the net emissions of equity and debt (changes), M / B is the relationship between the market and book value of equity, s is the starting year, and t-1 the last year of the sample. This indicator is used in other studies (Mahajan & Tartaroglu, 2008), (Jahanzeb et al., 2013), (Zavertiaeva & Nechaeva, 2017), (Allini et al., 2018), among others.
We have adapted the former formula by replacing equity (e) with capital (c), in this way we isolate the effects of other equity accounts such as reserves, accumulated profits, among others.
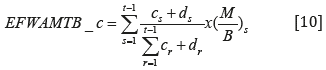
Where c is the net capital emissions (changes).
In the same way, following Mahajan & Tartaroglu (2008), the EQUITYMB is used (equity issue weighted market to book):
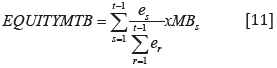
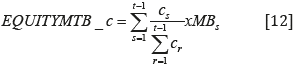
Where e corresponds to the net change in equity and c in the capital.
RESEARCH SAMPLE
A total of 170 companies from different economic sectors from four Latin American countries were chosen: Brazil, Chile, Mexico, and Peru. Companies in the financial sector were excluded because they had a particular financing structure. A total of 1454 annual observations were found, corresponding to the period 2010-2018.
Table 1 Economic sectors by country.
| Economic sectors | Brazil | Chile | México | Perú | Total |
|---|---|---|---|---|---|
| Agro & Fishing | 8 | 2 | 2 | 12 | |
| Food and Drink | 4 | 8 | 8 | 2 | 22 |
| Commerce | 6 | 7 | 10 | 1 | 24 |
| Building | 2 | 2 | 7 | 1 | 12 |
| Electric power | 6 | 5 | 5 | 16 | |
| Industrial machinery | 1 | 2 | 3 | ||
| No met minerals | 2 | 7 | 2 | 11 | |
| Mining | 1 | 3 | 3 | 11 | 18 |
| Paper and Pulp | 1 | 1 | |||
| Oil and Gas | 2 | 1 | 1 | 4 | |
| Chemistry | 1 | 1 | 3 | 5 | |
| Siderur & Metalur | 4 | 1 | 3 | 3 | 11 |
| Software and Data | 2 | 1 | 3 | ||
| Telecommunications | 2 | 2 | 6 | 1 | 11 |
| Textile | 1 | 1 | |||
| Transportation service | 3 | 6 | 4 | 13 | |
| Vehicles and Parts | 1 | 2 | 3 | ||
| Total | 36 | 47 | 58 | 29 | 170 |
Source: Compiled by authors.
The data is obtained from the indicators and financial statements from the economic platform. The values are shown in US dollars to make them comparative among the different countries.
RESULTS
Tables 2 and 3 describe the statistical results of the variables. Comparing the debt ratio (B_Lev) of the countries, it is observed that as a whole it is 40%, Brazil being the country with the highest ratio (51%) and Peru with the lowest value, 32%.
Table 2 Statistics of debt Índices Summary.
| Country | Variable | Obs | Mean | Std. Dev. | Min | Max |
|---|---|---|---|---|---|---|
| Brazil | M_Lev | 324 | 0.37 | 0.22 | 0 | 0.95 |
| B_Lev | 324 | 0.51 | 0.31 | 0 | 3.38 | |
| Chile | M_Lev | 376 | 0.33 | 0.22 | 0 | 0.93 |
| B_Lev | 376 | 0.36 | 0.20 | 0 | 1.92 | |
| Mexico | M_Lev | 522 | 0.29 | 0.21 | 0 | 0.98 |
| B_Lev | 522 | 0.40 | 0.23 | 0 | 1.03 | |
| Peru | M_Lev | 232 | 0.28 | 0.21 | 0 | 0.89 |
| B_Lev | 232 | 0.32 | 0.18 | 0.002 | 0.68 | |
| All | M_Lev | 1454 | 0.31 | 0.22 | 0 | 0.98 |
| B_Lev | 1454 | 0.40 | 0.25 | 0 | 3.38 |
Source: Authors' estimates.
Table 3 Variable statistics Summary.
| Variable | Obs | Mean | Std. Dev. | Min | Max |
|---|---|---|---|---|---|
| EFWAMB_c | 1.454 | 14.63 | 105.34 | - 314.41 | 1.302.40 |
| EFWAMB | 1.454 | 5.22 | 23.59 | - 203.02 | 214.44 |
| EQUITYMB | 1.454 | 2.48 | 33.65 | - 358.60 | 348.79 |
| EQUITYMB_c | 1.454 | 2.40 | 20.63 | - 217.37 | 91.20 |
| DEF | 1.453 | 107,198 | 3,480,075 | - 35,800,000 | 98,400,000 |
| TAM_AT | 1.454 | 14.70 | 1.57 | 10.25 | 19.62 |
| TANG | 1.454 | 0.37 | 0.23 | 0.00 | 0.93 |
| Mg_Neto | 1.454 | 0.06 | 1.07 | - 39.96 | 3.74 |
| DNE | 1.454 | 70,290 | 1,422,582 | - 24,900,000 | 18,300,000 |
| CNE | 1.454 | 3,595 | 2,632,592 | - 24,500,000 | 77,600,000 |
| PNE | 1.454 | - 16,751 | 3,224,989 | - 51,000,000 | 92,500,000 |
Source: Authors' estimates.
These values can be compared to the results obtained from 17% in Egyptian companies (Allini et al., 2018), 46% in Chinese companies (Chen, 2004) and, 51% in developed countries (Booth, L., Aivazian, V., Demirguc- Kunt, A., & Maksimovic, 2001). The average debt ratio of Latin American companies shows that financing through third parties is relevant for this group of organizations. Considering dispersion, Brazil presents the highest volatility with a standard deviation of 30% (0.3). Table 3 shows the statistics collected for the exploratory variables applied in the models.
On the other hand, Table 4 presents the correlational analysis carried out between the variables investigated. The correlation indices, in general, are low, the highest being 92.5%, which shows the correlation between the size variables and 83.87% between the PNE and the financial deficit (DEF).
Table 4 Correlation matrix.
| M_Lev | B_Lev | EFW-AMB_c | EFWAMB | EQUITYMB | EQUITY_c | DEF | TAM_AT | TANG | Mg_ Neto | DNE | CNE | PNE | |
|---|---|---|---|---|---|---|---|---|---|---|---|---|---|
| M_Lev | 1,00 | ||||||||||||
| B_Lev | 0,44 | 1,00 | |||||||||||
| EFWAMB_c | 0,01 | 0,03 | 1,00 | ||||||||||
| EFWAMB | -0,05 | 0,05 | 0,11 | 1,00 | |||||||||
| EQUITYMB | -0,12 | -0,03 | -0,14 | 0,21 | 1,00 | ||||||||
| EQUITYMB_c | 0,02 | 0,06 | 0,05 | -0,04 | -0,07 | 1,00 | |||||||
| DEF | -0,07 | -0,02 | 0,00 | 0,02 | 0,01 | 0,02 | 1,00 | ||||||
| TAM_AT | 0,17 | 0,26 | 0,02 | -0,01 | 0,02 | 0,06 | 0,06 | 1,00 | |||||
| TANG | 0,05 | -0,08 | -0,02 | 0,05 | 0,08 | -0,17 | -0,01 | -0,04 | 1,00 | ||||
| Mg_Neto | 0,01 | -0,05 | 0,01 | 0,01 | 0,01 | 0,02 | 0,01 | 0,05 | 0,04 | 1,00 | |||
| DNE | -0,01 | 0,01 | 0,00 | 0,01 | 0,01 | 0,03 | 0,46 | 0,08 | 0,01 | 0,00 | 1,00 | ||
| CNE | -0,07 | -0,03 | 0,00 | 0,06 | 0,00 | 0,01 | 0,80 | 0,01 | -0,01 | 0,01 | 0,15 | 1,00 | |
| PNE | -0,10 | -0,05 | 0,00 | 0,01 | 0,00 | 0,01 | 0,84 | -0,03 | -0,03 | 0,02 | 0,10 | 0,87 | 1,00 |
Source: Authors' estimates.
Regarding the validity of the POT theory, the results by countries of models 1, 2, and 3 are observed in table 5. For example, for the case of Brazil, the results of Hausman test for the model 1 and 2 were of 0.59 and 1.02 respectively, so the random effect method is preferable; on the contrary, for the model 3 the fixed effects method is better, since the test was of 377.64. In the case of model 1, with a dependent variable DNE, for all countries, it is observed that all the Model coefficients (betas) were significant and positive (except for Chile), indicating a direct ratio, which proves that the variations in financial debt respond to variations in the financial deficit. This effect is more relevant for Mexico and Peru with betas of 0.471 and 0.776 than in Brazil, with beta of 0.176.
Table 5 POT Estimator Models by countries.
| Country | Variable | DNE | CNE | PNE |
|---|---|---|---|---|
| m1re | m2re | m3fe | ||
| Brazil | DEF | 0.176 | 0.640 | 0.835 |
| Std. Err | 0.019 | 0.025 | 0.027 | |
| t-value | 0.000 | 0.000 | 0.000 | |
| _cons | 3.1e+04 | -1.0e+05 | -3.4e+05 | |
| Std. Err | 1.4e+05 | 1.8e+05 | 1.9e+05 | |
| t-value | 0.823 | 0.560 | 0.073 | |
| N | 324 | 324 | 324 | |
| r2 | 0.773 | |||
| r2_a | 0.744 | |||
| F | 974819 | |||
| Chile | m1re | m2re | m3fe | |
| DEF | 0.014 | 0.135 | 0.303 | |
| Std. Err | 0.020 | 0.016 | 0.017 | |
| t-value | 0.480 | 0.000 | 0.000 | |
| _cons | 4.8e+04 | 6.618.457 | -1.6e+03 | |
| Std. Err | 2.0e+04 | 1.6e+04 | 1.6e+04 | |
| t-value | 0.015 | 0.672 | 0.919 | |
| N | 376 | 376 | 376 | |
| r2 | 0.503 | |||
| r2_a | 0.432 | |||
| F | 332.073 | |||
| Mexico | m1fe | m2re | m3fe | |
| DEF | 0.471 | 0.080 | 0.253 | |
| Std. Err | 0.021 | 0.014 | 0.030 | |
| t-value | 0.000 | 0.000 | 0.000 | |
| _cons | 4.5e+04 | -1.0e+04 | 2.0e+04 | |
| Std. Err | 2.6e+04 | 1.8e+04 | 3.7e+04 | |
| t-value | 0.083 | 0.571 | 0.588 | |
| N | 522 | 522 | 522 | |
| r2 | 0.515 | 0.131 | ||
| r2_a | 0.455 | 0.022 | ||
| F | 492.508 | 69.861 | ||
| Peru | m1fe | m2fe | m3fe | |
| DEF | 0.776 | 0.085 | 0.134 | |
| Std. Err | 0.029 | 0.019 | 0.049 | |
| t-value | 0.000 | 0.000 | 0.007 | |
| _cons | -1.6e+04 | 1.918.865 | 3.4e+04 | |
| Std. Err | 6.332.263 | 4.228.830 | 1.1e+04 | |
| t-value | 0.015 | 0.650 | 0.002 | |
| N | 231 | 231 | 231 | |
| r2 | 0.781 | 0.088 | 0.035 | |
| r2_a | 0.749 | -0.043 | -0.104 | |
| F | 716.515 | 19.426 | 7.391 |
Source: Authors’ estimates.
As anticipated in model 2, with the dependent variable CNE, the coefficients are also significant and positive, but variations in the financial deficit in capital variations (CNE) have lower effects compared to equity (PNE). For the model 3, for instance, in the case of Mexico the CNE beta is of 0.080 and the one of PNE is 0.253.
This difference may indicate that the financial deficit for these companies opts for a mix of financing strategies between financial debt (DNE), capital (CNE), and equity (PNE). The latter includes accumulated profits.
Table 6 Latin America POTEstimator Models.
| Country | Variable | DNE | CNE | PNE |
|---|---|---|---|---|
| m1re | m2re | m3fe | ||
| Latin America | DEF | 0.188 | 0.602 | 0.798 |
| Std. Err | 0.010 | 0.012 | 0.013 | |
| t-value | 0.000 | 0.000 | 0.000 | |
| _cons | 5.0e+04 | -6.1e+04 | -1.0e+05 | |
| Std. Err | 3.3e+04 | 4.2e+04 | 4.6e+04 | |
| t-value | 0.131 | 0.146 | 0.027 | |
| N | 1453 | 1453 | 1453 | |
| r2 | 0.732 | |||
| r2_a | 0.696 | |||
| F | 3.500.908 |
Source: Authors' estimates.
Table 6 exhibits the results including all countries (Latin America). In model 1 the beta coefficient of 0.188 is quite far from the 0.340 reported by Allini (Allini et al., 2018) for Egyptian companies and the 0.30 of Chen (Chen et al., 2013) for Chinese companies. The results of the models show that in the face of a financial deficit, Latin American companies choose to finance themselves with variations in capital (CNE) and equity (PNE) to a greater extent than with financial debt (DNE).
Table 7 shows the results for the four countries of the regression of panel data for models 4, 5, 6, and 7 with the dependent variable the ratio of financial debt to market value (M_Lev).
Table 7 MTT Estimator Models by countries, dependent variable M_Lev.
| Brasil | Variable | m4re | m5re | m6fe | m7re | Chile | Variable | m4fe | m5fe | m6fe | m7fe |
| TAM_AT | 0.007 | 0.007 | -0.026 | 0.007 | TAM_AT | 0.173 | 0.172 | 0.172 | 0.172 | ||
| Std. Err | 0.015 | 0.015 | 0.019 | 0.015 | Std. Err | 0.028 | 0.028 | 0.028 | 0.028 | ||
| t-value | 0.637 | 0.624 | 0.185 | 0.645 | t-value | 0.000 | 0.000 | 0.000 | 0.000 | ||
| TANG | -0.058 | -0.058 | -0.096 | -0.058 | TANG | 0.511 | 0.508 | 0.509 | 0.510 | ||
| Std. Err | 0.091 | 0.090 | 0.106 | 0.091 | Std. Err | 0.074 | 0.074 | 0.074 | 0.074 | ||
| t-value | 0.524 | 0.524 | 0.367 | 0.519 | t-value | 0.000 | 0.000 | 0.000 | 0.000 | ||
| Mg_Neto | -0.618 | -0.617 | -0.601 | -0.618 | Mg_Neto | -0.006 | -0.006 | -0.006 | -0.006 | ||
| Std. Err | 0.054 | 0.054 | 0.055 | 0.054 | Std. Err | 0.022 | 0.022 | 0.022 | 0.022 | ||
| t-value | 0.000 | 0.000 | 0.000 | 0.000 | t-value | 0.775 | 0.774 | 0.768 | 0.774 | ||
| EFWAMB | 0.000 | EFWAMB | 0.000 | ||||||||
| Std. Err | 0.000 | Std. Err | 0.001 | ||||||||
| t-value | 0.949 | t-value | 0.877 | ||||||||
| EFWAMB_c | 0.000 | EFWAMB_c | -0.000 | ||||||||
| Std. Err | 0.000 | Std. Err | 0.000 | ||||||||
| t-value | 0.659 | t-value | 0.890 | ||||||||
| EQUITYMB | 0.000 | EQUITYMB | -0.000 | ||||||||
| Std. Err | 0.000 | Std. Err | 0.000 | ||||||||
| t-value | 0.976 | t-value | 0.485 | ||||||||
| EQUITYMB_c | 0.000 | EQUITYMB_c | 0.001 | ||||||||
| Std. Err | 0.000 | Std. Err | 0.002 | ||||||||
| t-value | 0.968 | t-value | 0.644 | ||||||||
| _cons | 0.325 | 0.319 | 0.857 | 0.327 | _cons | -2.293 | -2.286 | -2.286 | -2.288 | ||
| Std. Err | 0.240 | 0.240 | 0.308 | 0.241 | Std. Err | 0.402 | 0.399 | 0.399 | 0.399 | ||
| t-value | 0.176 | 0.184 | 0.006 | 0.174 | t-value | 0.000 | 0.000 | 0.000 | 0.000 | ||
| N | 324 | 324 | 324 | 324 | N | 376 | 376 | 376 | 376 | ||
| r2 | 0.301 | r2 | 0.207 | 0.207 | 0.208 | 0.207 | |||||
| r2_a | 0.205 | r2_a | 0.085 | 0.085 | 0.086 | 0.085 | |||||
| F | 30.627 | F | 21.185 | 21.183 | 21.331 | 21.244 | |||||
| Mexico | TAM_AT | 0.013 | 0.013 | 0.012 | 0.013 | Peru | TAM_AT | -0.023 | -0.023 | -0.024 | -0.028 |
| Std. Err | 0.014 | 0.014 | 0.014 | 0.014 | Std. Err | 0.025 | 0.025 | 0.025 | 0.025 | ||
| t-value | 0.353 | 0.343 | 0.379 | 0.349 | t-value | 0.343 | 0.357 | 0.340 | 0.266 | ||
| TANG | 0.064 | 0.063 | 0.052 | 0.054 | TANG | 0.139 | 0.144 | 0.140 | 0.139 | ||
| Std. Err | 0.078 | 0.079 | 0.077 | 0.077 | Std. Err | 0.085 | 0.086 | 0.085 | 0.085 | ||
| t-value | 0.407 | 0.421 | 0.499 | 0.482 | t-value | 0.103 | 0.092 | 0.101 | 0.102 | ||
| Mg_Neto | -0.001 | -0.001 | -0.001 | -0.001 | Mg_Neto | -0.174 | -0.174 | -0.175 | -0.176 | ||
| Std. Err | 0.003 | 0.003 | 0.003 | 0.003 | Std. Err | 0.053 | 0.053 | 0.053 | 0.053 | ||
| t-value | 0.823 | 0.826 | 0.830 | 0.830 | t-value | 0.001 | 0.001 | 0.001 | 0.001 | ||
| EFWAMB | 0.001 | EFWAMB | 0.000 | ||||||||
| Std. Err | 0.000 | Std. Err | 0.001 | ||||||||
| t-value | 0.043 | t-value | 0.780 | ||||||||
| EFWAMB_c | 0.000 | EFWAMB_c | 0.000 | ||||||||
| Std. Err | 0.000 | Std. Err | 0.000 | ||||||||
| t-value | 0.443 | t-value | 0.388 | ||||||||
| EQUITYMB | 0.000 | EQUITYMB | 0.000 | ||||||||
| Std. Err | 0.000 | Std. Err | 0.000 | ||||||||
| t-value | 0.614 | t-value | 0.703 | ||||||||
| EQUITYMB_c | -0.000 | EQUITYMB_c | -0.001 | ||||||||
| Std. Err | 0.001 | Std. Err | 0.000 | ||||||||
| t-value | 0.990 | t-value | 0.041 | ||||||||
| _cons | 0.069 | 0.069 | 0.087 | 0.075 | _cons | 0.549 | 0.542 | 0.553 | 0.604 | ||
| Std. Err | 0.206 | 0.207 | 0.208 | 0.207 | Std. Err | 0.347 | 0.352 | 0.349 | 0.352 | ||
| t-value | 0.739 | 0.737 | 0.675 | 0.716 | t-value | 0.114 | 0.124 | 0.113 | 0.086 | ||
| N | 522 | 522 | 522 | 522 | N | 232 | 232 | 232 | 232 |
Source: Authors’ estimates.
For Brazil in the four models (4, 5, 6, and 7) the significant variable is Mg_Net, with an inverse ratio, which would indicate that before rises of profits, the indebtedness level decreases. On the other hand, for Chile, the significant and positive variables are TAM_AT and TANG, the bigger size of the assets and/or asset tangibility, the bigger is the indebtedness ratio. For Mexico, only the EFWAMB variable has some extent of significance and direct ratio. And for Peru, only the Mg Net and EQUITYMB_c have statistical significance, both with an inverse ratio.
Table 8 shows the results for the four countries of models 4, 5, 6, and 7 with the dependent variable of the ratio of debt to book value, that is, total financial debt over total assets (B_Lev).
Table 8 MTT Estimator Models by countries, with dependent variable B_Lev.
| Brasil | Variable | m4re | m5re | m6re | m7fe | Chile | Variable | m4fe | m5fe | m6fe | m7fe |
| TAM_AT | -0.020 | -0.020 | -0.020 | -0.058 | TAM_AT | 0.146 | 0.145 | 0.145 | 0.145 | ||
| Std. Err | 0.027 | 0.027 | 0.027 | 0.040 | Std. Err | 0.028 | 0.028 | 0.028 | 0.028 | ||
| t-value | 0.463 | 0.452 | 0.461 | 0.143 | t-value | 0.000 | 0.000 | 0.000 | 0.000 | ||
| TANG | -0.276 | -0.277 | -0.277 | -0.574 | TANG | 0.466 | 0.460 | 0.462 | 0.461 | ||
| Std. Err | 0.167 | 0.167 | 0.168 | 0.218 | Std. Err | 0.073 | 0.073 | 0.072 | 0.072 | ||
| t-value | 0.098 | 0.097 | 0.099 | 0.009 | t-value | 0.000 | 0.000 | 0.000 | 0.000 | ||
| Mg_Neto | -0.310 | -0.310 | -0.309 | -0.233 | Mg_Neto | -0.007 | -0.007 | -0.007 | -0.007 | ||
| Std. Err | 0.109 | 0.108 | 0.108 | 0.114 | Std. Err | 0.022 | 0.022 | 0.022 | 0.022 | ||
| t-value | 0.004 | 0.004 | 0.004 | 0.041 | t-value | 0.732 | 0.730 | 0.729 | 0.731 | ||
| EFWAMB | 0.000 | EFWAMB | 0.000 | ||||||||
| Std. Err | 0.000 | Std. Err | 0.001 | ||||||||
| t-value | 0.812 | t-value | 0.589 | ||||||||
| EFWAMB_c | -0.000 | EFWAMB_c | -0.000 | ||||||||
| Std. Err | 0.000 | Std. Err | 0.000 | ||||||||
| t-value | 0.723 | t-value | 0.708 | ||||||||
| EQUITYMB | 0.000 | EQUITYMB | -0.000 | ||||||||
| Std. Err | 0.001 | Std. Err | 0.000 | ||||||||
| t-value | 0.950 | t-value | 0.976 | ||||||||
| EQUITYMB_c | 0.001 | EQUITYMB_c | -0.001 | ||||||||
| Std. Err | 0.001 | Std. Err | 0.001 | ||||||||
| t-value | 0.186 | t-value | 0.475 | ||||||||
| _cons | 0.930 | 0.940 | 0.933 | 1.603 | _cons | -1879 | -1855 | -1855 | -1.853 | ||
| Std. Err | 0.424 | 0.425 | 0.426 | 0.630 | Std. Err | 0.394 | 0.392 | 0.392 | 0.392 | ||
| t-value | 0.028 | 0.027 | 0.029 | 0.012 | t-value | 0.000 | 0.000 | 0.000 | 0.000 | ||
| N | 324 | 324 | 324 | 324 | N | 376 | 376 | 376 | 376 | ||
| r2 | 0.047 | r2 | 0.174 | 0.174 | 0.173 | 0.175 | |||||
| r2_a | -0.083 | r2_a | 0.047 | 0.046 | 0.046 | 0.048 | |||||
| F | 3.532 | F | 17114 | 17068 | 17026 | 17.180 | |||||
| México | TAM_AT | 0.127 | 0.127 | 0.117 | 0.128 | Perú | TAM_AT | 0.099 | 0.102 | 0.100 | 0.098 |
| Std. Err | 0.023 | 0.023 | 0.023 | 0.024 | Std. Err | 0.020 | 0.020 | 0.020 | 0.020 | ||
| t-value | 0.000 | 0.000 | 0.000 | 0.000 | t-value | 0.000 | 0.000 | 0.000 | 0.000 | ||
| TANG | 0.044 | 0.092 | 0.019 | 0.020 | TANG | 0.242 | 0.241 | 0.240 | 0.235 | ||
| Std. Err | 0.098 | 0.100 | 0.098 | 0.099 | Std. Err | 0.061 | 0.060 | 0.061 | 0.061 | ||
| t-value | 0.653 | 0.359 | 0.842 | 0.841 | t-value | 0.000 | 0.000 | 0.000 | 0.000 | ||
| Mg_Neto | -0.001 | -0.001 | -0.001 | -0.001 | Mg_Neto | -0.157 | -0.155 | -0.158 | -0.157 | ||
| Std. Err | 0.003 | 0.003 | 0.003 | 0.003 | Std. Err | 0.035 | 0.035 | 0.035 | 0.035 | ||
| t-value | 0.646 | 0.650 | 0.659 | 0.648 | t-value | 0.000 | 0.000 | 0.000 | 0.000 | ||
| EFWAMB | 0.001 | EFWAMB | 0.001 | ||||||||
| Std. Err | 0.000 | Std. Err | 0.000 | ||||||||
| t-value | 0.007 | t-value | 0.101 | ||||||||
| EFWAMB_c | 0.000 | EFWAMB_c | 0.000 | ||||||||
| Std. Err | 0.000 | Std. Err | 0.000 | ||||||||
| t-value | 0.001 | t-value | 0.046 | ||||||||
| EQUITYMB | 0.001 | EQUITYMB | 0.000 | ||||||||
| Std. Err | 0.000 | Std. Err | 0.000 | ||||||||
| t-value | 0.012 | t-value | 0.188 | ||||||||
| EQUITYMB_c | -0.000 | EQUITYMB_c | -0.000 | ||||||||
| Std. Err | 0.001 | Std. Err | 0.000 | ||||||||
| t-value | 0.827 | t-value | 0.269 | ||||||||
| _cons | -1.491 | -1.504 | -1.336 | -1.487 | _cons | -1.181 | -1.216 | -1.187 | -1.167 | ||
| Std. Err | 0.337 | 0.336 | 0.341 | 0.349 | Std. Err | 0.284 | 0.282 | 0.284 | 0.283 | ||
| t-value | 0.000 | 0.000 | 0.000 | 0.000 | t-value | 0.000 | 0.000 | 0.000 | 0.000 | ||
| N | 522 | 522 | 522 | 522 | N | 232 | 232 | 232 | 232 | ||
| r2 | 0.077 | 0.083 | 0.075 | 0.063 | r2 | ||||||
| r2_a | -0.045 | -0.038 | -0.047 | -0.062 | r2_a | ||||||
| F | 9.608 | 10.471 | 9.363 | 7.674 | F |
Source: Authors' estimates.
For Brazil in the four models (4, 5, 6, and 7) the significant variables are TANG and Mg_Net, with inverse ratio, this last one in line differs from the theory, since bigger tangibility of the assets is interpreted as a better collateral to obtain debt.
For Chile, like in the previous analysis (table 7), the significant and direct ratio variables are TAM_AT and TANG. For Mexico, the significant variables are TAM_AT and EFWAMB, EFWAMB c and EQUITYMB, all with direct ratio; these results are very different from those obtained on the dependent variable of indebtedness on the market value (M_Lev). Finally, for Peru, the variables TAM_AT, TANG, and Mg Net resulted significant; for MTT variables, EFWAMB c resulted positive significant coefficient.
Table 9 shows the results for Latin America of the regression of panel data of models 4, 5, 6, and 7 with the dependent variable of the ratio of debt to market value (M_Lev).
Table 9 MTT Estimator Models for Latin America, with dependent variable M_Lev.
| Latin America | Variable | m4fe | m5re | m6fe | m7re |
| TAM_AT | 0.017 | 0.023 | 0.018 | 0.023 | |
| Std. Err | 0.014 | 0.008 | 0.014 | 0.008 | |
| t-value | 0.206 | 0.003 | 0.197 | 0.003 | |
| TANG | 0.259 | 0.185 | 0.255 | 0.181 | |
| Std. Err | 0.048 | 0.039 | 0.048 | 0.039 | |
| t-value | 0.000 | 0.000 | 0.000 | 0.000 | |
| Mg_Neto | -0.003 | -0.003 | -0.003 | -0.003 | |
| Std. Err | 0.003 | 0.003 | 0.003 | 0.003 | |
| t-value | 0.358 | 0.360 | 0.359 | 0.360 | |
| EFWAMB | 0.000 | ||||
| Std. Err | 0.000 | ||||
| t-value | 0.309 | ||||
| EFWAMB_c | 0.000 | ||||
| Std. Err | 0.000 | ||||
| t-value | 0.181 | ||||
| EQUITYMB | -0.000 | ||||
| Std. Err | 0.000 | ||||
| t-value | 0.870 | ||||
| EQUITYMB_c | -0.000 | ||||
| Std. Err | 0.000 | ||||
| t-value | 0.377 | ||||
| _cons | -0.035 | -0.092 | -0.039 | -0.095 | |
| Std. Err | 0.200 | 0.116 | 0.201 | 0.116 | |
| t-value | 0.861 | 0.429 | 0.846 | 0.412 | |
| N | 1454 | 1454 | 1454 | 1454 | |
| r2 | 0.025 | 0.024 | |||
| r2_a | -0.107 | -0.108 | |||
| F | 8.205 | 7.946 |
Source: Authors'.
For the group of companies from the different Latin American countries in the study, it is seen that the tangibility variable (TANG) has a direct relationship, which is consistent with the static equilibrium theory. There are not indicators that Latin companies follow the theory of market synchronization (MTT).
Table 10 shows the results for Latin America of the regression of panel data of models 4, 5, 6, and 7 with the dependent variable of the ratio of total financial debt over total assets (B_Lev).
Table 10 MTT Latin America Estimator Models, with dependent variable B_Lev.
| Latin America | Variable | m4re | m5re | m6re | m7re |
| TAM_AT | 0.051 | 0.052 | 0.051 | 0.051 | |
| Std. Err | 0.008 | 0.008 | 0.008 | 0.008 | |
| t-value | 0.000 | 0.000 | 0.000 | 0.000 | |
| TANG | 0.093 | 0.097 | 0.090 | 0.090 | |
| Std. Err | 0.044 | 0.044 | 0.044 | 0.044 | |
| t-value | 0.032 | 0.027 | 0.040 | 0.039 | |
| Mg_Neto | -0.003 | -0.003 | -0.003 | -0.003 | |
| Std. Err | 0.003 | 0.003 | 0.003 | 0.003 | |
| t-value | 0.361 | 0.365 | 0.365 | 0.364 | |
| EFWAMB | 0.000 | ||||
| Std. Err | 0.000 | ||||
| t-value | 0.100 | ||||
| EFWAMB_c | 0.000 | ||||
| Std. Err | 0.000 | ||||
| t-value | 0.060 | ||||
| EQUITYMB | 0.000 | ||||
| Std. Err | 0.000 | ||||
| t-value | 0.306 | ||||
| EQUITYMB_c | 0.000 | ||||
| Std. Err | 0.000 | ||||
| t-value | 0.545 | ||||
| _cons | -0.392 | -0.396 | -0.385 | -0.386 | |
| Std. Err | 0.126 | 0.126 | 0.126 | 0.126 | |
| t-value | 0.002 | 0.002 | 0.002 | 0.002 | |
| N | 1454 | 1454 | 1454 | 1454 | |
| r2 | |||||
| r2_a | |||||
| F |
Source: Authors' estimates.
When analyzing total financial debt over total assets, it is observed that the variables of size (TAM_AT) and tangibility (TANG) of assets have a direct relationship with the ratio of debt over total assets, which would support the static equilibrium theory. None of the variables do so in support of one of the POT and MTT.
Finally the last regression model applied attempts to measure which of the different sources of financing (DNE, CNE, or PNE) has a greater dominance, for the regression coefficients, over the dependent variable financial deficit (DEF). Tables 11 and 12 present the results of this analysis.
Table 11 Analysis of the DEF relationship and sources of financing by countries.
| Brazil | Variable | m8fe | Chile | Variable | m8fe |
| DNE | 0.855 | DNE | 0.028 | ||
| Std. Err | 0.051 | Std. Err | 0.093 | ||
| t-value | 0.000 | t-value | 0.761 | ||
| CNE | 0.214 | CNE | -1.295 | ||
| Std. Err | 0.053 | Std. Err | 0.172 | ||
| t-value | 0.000 | t-value | 0.000 | ||
| PNE | 0.727 | PNE | 2.454 | ||
| Std. Err | 0.044 | Std. Err | 0.135 | ||
| t-value | 0.000 | t-value | 0.000 | ||
| _cons | 2.6e+05 | _cons | 3.4e+04 | ||
| Std. Err | 1.4e+05 | Std. Err | 3.5e+04 | ||
| t-value | 0.062 | t-value | 0.330 | ||
| N | 324 | N | 376 | ||
| r2 | 0.892 | r2 | 0.577 | ||
| r2_a | 0.877 | r2_a | 0.514 | ||
| F | 782.600 | F | 148.344 | ||
| Mexico | Variable | m8fe | Peru | Variable | m8re |
| DNE | 1.241 | DNE | 0.998 | ||
| Std. Err | 0.040 | Std. Err | 0.029 | ||
| t-value | 0.000 | t-value | 0.000 | ||
| CNE | -0.694 | CNE | 0.797 | ||
| Std. Err | 0.085 | Std. Err | 0.094 | ||
| t-value | 0.000 | t-value | 0.000 | ||
| PNE | 0.752 | PNE | 0.131 | ||
| Std. Err | 0.041 | Std. Err | 0.034 | ||
| t-value | 0.000 | t-value | 0.000 | ||
| _cons | -3.9e+04 | _cons | 1.7e+04 | ||
| Std. Err | 3.0e+04 | Std. Err | 5.817.944 | ||
| t-value | 0.206 | t-value | 0.003 | ||
| N | 522 | N | 231 | ||
| r2 | 0.722 | r2 | |||
| r2_a | 0.685 | r2_a | |||
| F | 398.271 | F |
Source: Authors'.
Table 12 Analysis of the DEF relationship and sources of financing, Latin America.
| Latin America | Variable | m8fe |
| DNE | 0.874 | |
| Std. Err | 0.026 | |
| t-value | 0.000 | |
| CNE | 0.197 | |
| Std. Err | 0.028 | |
| t-value | 0.000 | |
| PNE | 0.736 | |
| Std. Err | 0.023 | |
| t-value | 0.000 | |
| _cons | 5.7e+04 | |
| Std. Err | 3.5e+04 | |
| t-value | 0.102 | |
| N | 1453 | |
| r2 | 0.866 | |
| r2_a | 0.848 | |
| F | 2.764.958 |
Source: Authors' estimates.
Table 11 shows that the three variables are important for all countries, but the DNE variable for Chile. It is seen that the coefficient associated with the DNE variable presents the highest coefficient for Brazil, Mexico, and Peru (table 11), as well as for the group of Latin American companies in the 4 countries (table 12). Consequently, debt financing would be a priority. In contrast, Chile favors the source of financing related to equity (PNE).
The results of the exploratory variables (EFWAMB, EFWAMB c, EQUITYMB and EQUITYMB c) of MTT are not very satisfactory, few of them became relevant and the values of their betas very low (very close to zero) compared with the other significant betas of the different models. For instance, this is case of the m4fe model for Mexico, where EFWAMB beta is 0.001, very low compared with the beta of the variable TAM AT of 0.127 (both relevant variables), that means, the size variable explains much more the indebtedness ratio of the companies than the exploratory variable of MTT (EFWAMB). The aforesaid is sign of a low presence of MTT in Latin American companies.
CONCLUSIONS
Regarding the pecking order theory (POT), given the first hypothesis that proposed that Latin American companies fulfill their financial deficit needs indistinctly with debt, capital, and equity, without privileging any of them, it can be concluded that for Latin American companies this theory is not fully fulfilled because the three sources of financing were important. Furthermore, not all the independent variables of the applied models were significant for the companies of different countries. For Chile, the net debt variable was not relevant. Although the PNE variable was important, it does not permit a conclusion to be drawn by the POT theory.
Considering the market timing theory (MTT) and the second hypothesis that suggested that Latin American companies decide their capital structure considering the effects or favorable conditions of the stock market, it can be concluded that in the four models studied the most significant is found with the tangibility variables of the assets and the book value price relationship. Therefore, the share price on the stock market is relevant when financing the financial deficit.
Regardless of the capital structure indices used in the different models, the results do not significantly vary. Considering the ratio of debt to market value, for Brazilian companies, there is evidence of the market timing theory (MTT), as well as the pecking order theory (POT). For Chilean companies, the evidence points to the market timing theory (MTT) given that the book-value price ratio has the expected sign and significance. For Mexican companies, there is evidence that they follow the MTT since the beta of EFWAMB is significant and positive. For Peru, there is no evidence that companies follow pecking order theory (POT) or market synchronization (MTT).
When considering the total sample, there is no cross-sectional evidence in all the models that Latin American companies follow the market timing theory (MTT), this is only found when we consider the financing structure at market values and not at book value. But the variables of tangibility and size present evidence that companies could follow the static equilibrium theory (TOT, indicating that they follow a mixture of several theories, which shows that Latin American companies have their own characteristics in the capital structure.
The results found partly coincide with the found ones in developing markets as the Taiwanese and the Egyptian ones in the studies of Chen et al. (2013) and Allini, et al. (2018) respectively, concerning the Latin American companies giving more preference to the debt issuance than to the financing for equity issuance. On the other hand, these results are consistent with studies on developed markets made by Mahajan & Tartaroglu (2008) in which there is no evidence that the markets follow the MTT hypothesis. Furthermore, this study and the previous ones of this paragraph differs from what was found by Dani, et al. (2016); that MTT influences in the choices of Argentina, Brazil and Peru.
Regarding the last model, where the independent variables were DNE, CNE, and PNE, it was found that all three are significant, but when analyzing the coefficients, it was noticed that the DNE variable presented a higher positive value, showing that this source of financing is preferred by Latin American companies to cover their financial gap.
One of the restrictions of this study is the low number of companies in the region that carry out new share issues. For this reason, the results obtained do not let us draw definitive conclusions for the region, but they enable us to open the way to new studies and models aimed at verifying the market timing theory in Latin American markets.

